




Richmond CA 94804 July 2025 Real Estate Trends – What Sellers and Investors Need to Know

By Harv Balu, Realtor® – Realty Experts
Staying on top of the local housing market is crucial, whether you're a home seller or a real estate investor. July 2025 brought some notable shifts in Richmond’s 94804 zip code market. The good news for sellers: the scales still tip in your favor as low inventory continues to drive a seller’s market. For investors, understanding these trends can help pinpoint opportunities (and risks) in the current climate. Let’s break down what happened in July and what it means for you.
July 2025 Market Highlights (Richmond 94804)
-
Median Sold Price: $595,000 for single-family homes – a sharp +19% jump from June. (Prices are roughly 3–5% lower than last summer, reflecting some year-over-year cooling (redfin.com.)
-
Homes Sold Above Asking: On average, homes sold for 101.6% of their list price (slightly above asking), indicating strong buyer competition.
-
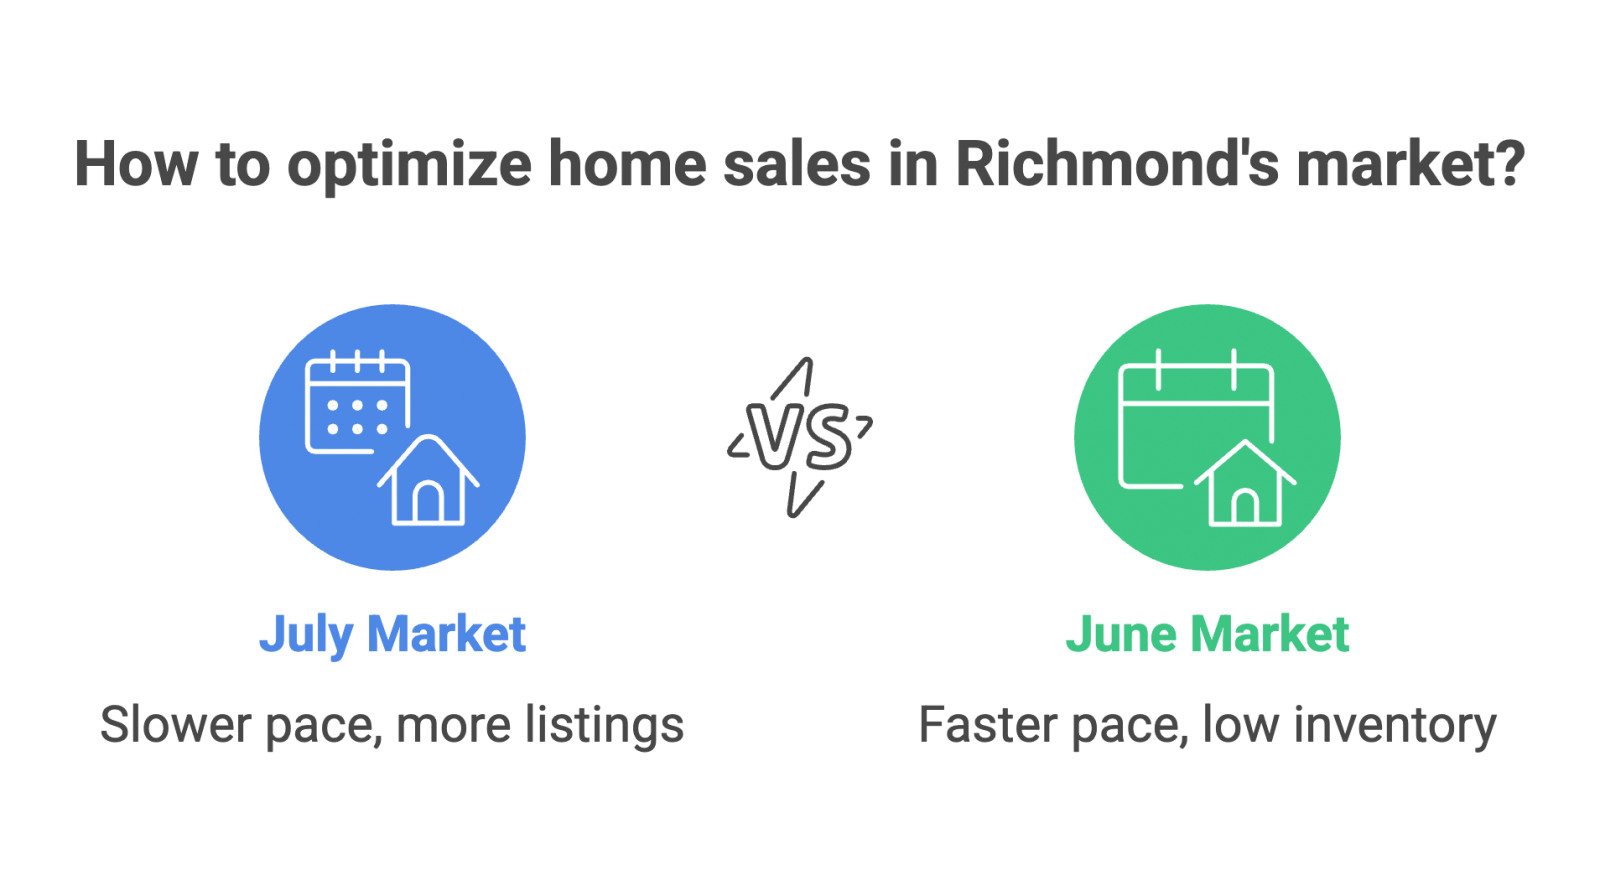
Speed of Sales: 22 days median time on market for sold homes. That’s up from about 15 days in June (homes took a week longer to sell), but still only ~3 weeks – pretty quick!
-
Inventory Supply: 2.23 months of inventory at July’s sales pace. This is well below the 5–6 months considered a balanced market, confirming a seller’s market (fewer homes than buyers). Inventory is down ~17% from last year, so supply remains tight.
-
Active Listings: 40 homes actively for sale by end of July, with a median list price of ~$589K. Active listings’ median days on market was 38 days (up a bit, as some homes take longer to find the right buyer).
-
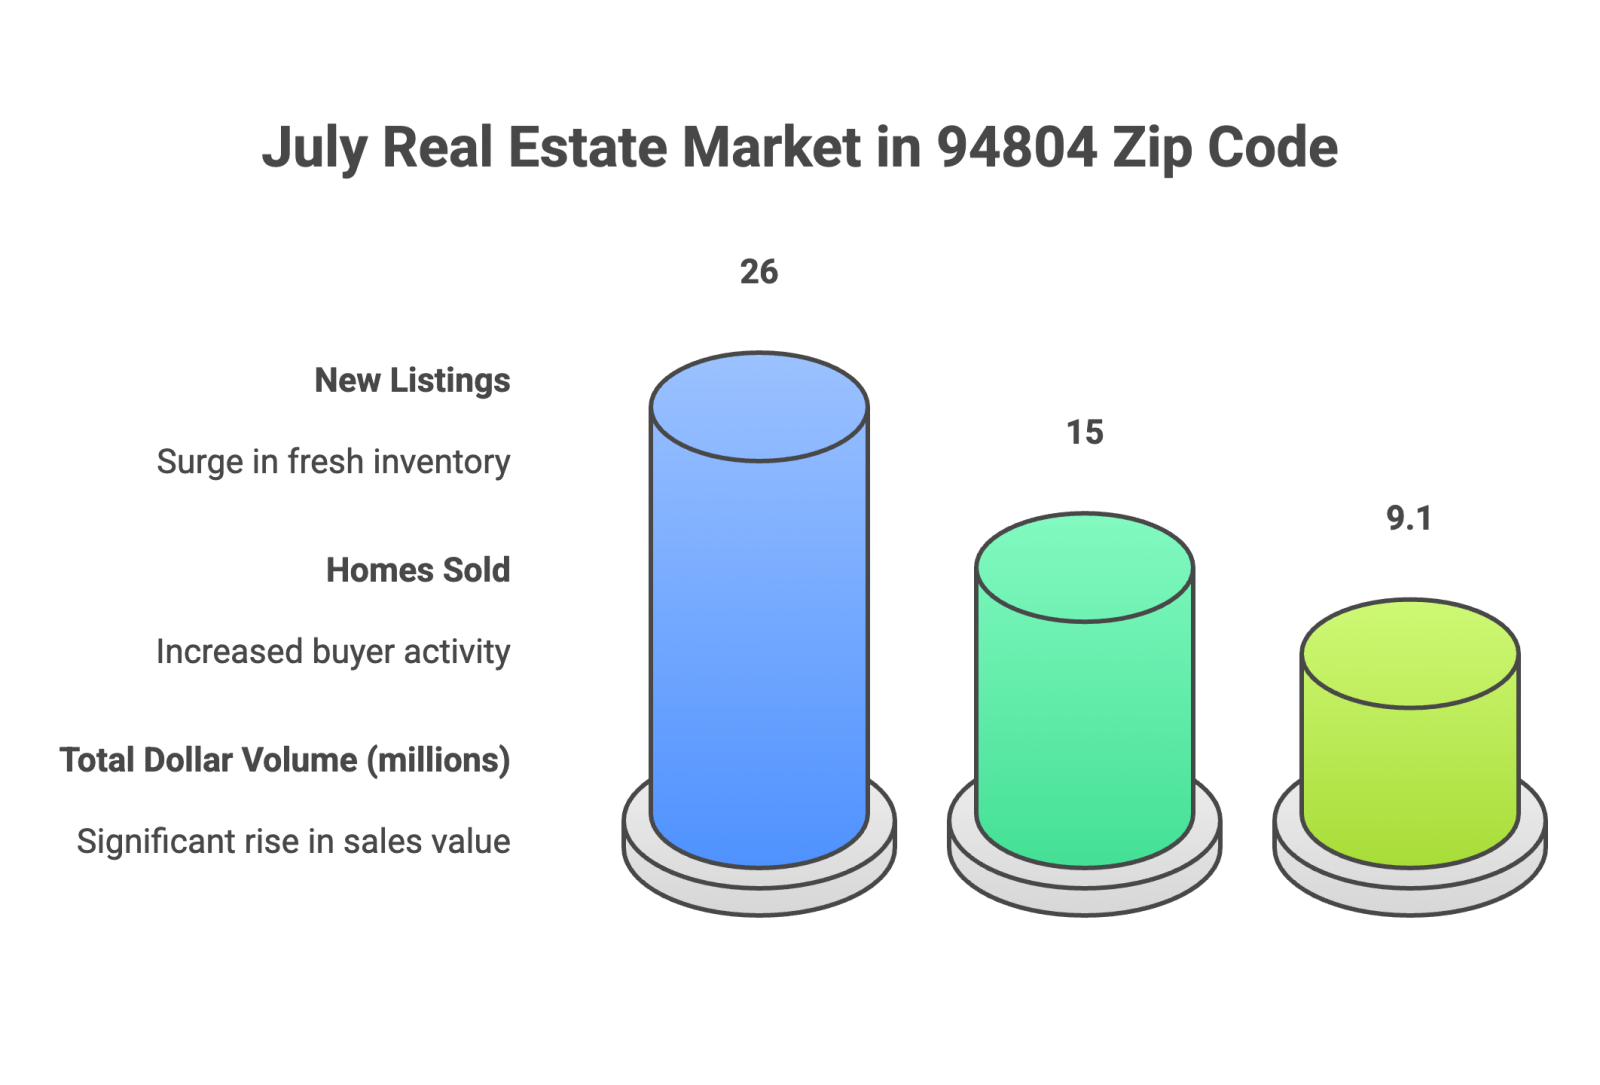
New Listings & Sales Activity: 26 new listings hit the market in July (a healthy uptick of +36% vs. June), and 15 homes sold during the month (+25% vs. June sales). More activity all around – summer brought both more sellers listing and more buyers closing deals.
Low Inventory = Strong Seller’s Market
With only about 2.2 months of inventory available, Richmond 94804 firmly remains a seller’s market. In practical terms, buyer demand is outpacing the supply of homes – there are more people looking to buy in this zip code than there are homes for sale. A balanced market typically has around 5-6 months of inventory, so 2.2 months is very low. In fact, inventory is 17% lower than a year ago, which means even fewer options for buyers now than last summer.
For sellers, this is favorable: limited competition from other listings can lead to more buyer interest in your property. Many buyers, facing few choices, may act quickly and even bid above asking to secure a home. This dynamic is exactly what we saw in July, with the average sale-to-list price at 101.6% – homes selling slightly above listing price on average. When buyers consistently pay over asking, it’s a hallmark of a heated market. As a seller, you could expect strong offers, provided your home is priced right and shows well.
That said, we did see a small increase in inventory from June (thanks to more new listings coming on). If this trend continues, buyers might get a bit more breathing room in the coming months. But for now, inventory is still historically low, so the leverage remains with sellers.
.png)
Home Prices on the Rise (Month-over-Month)
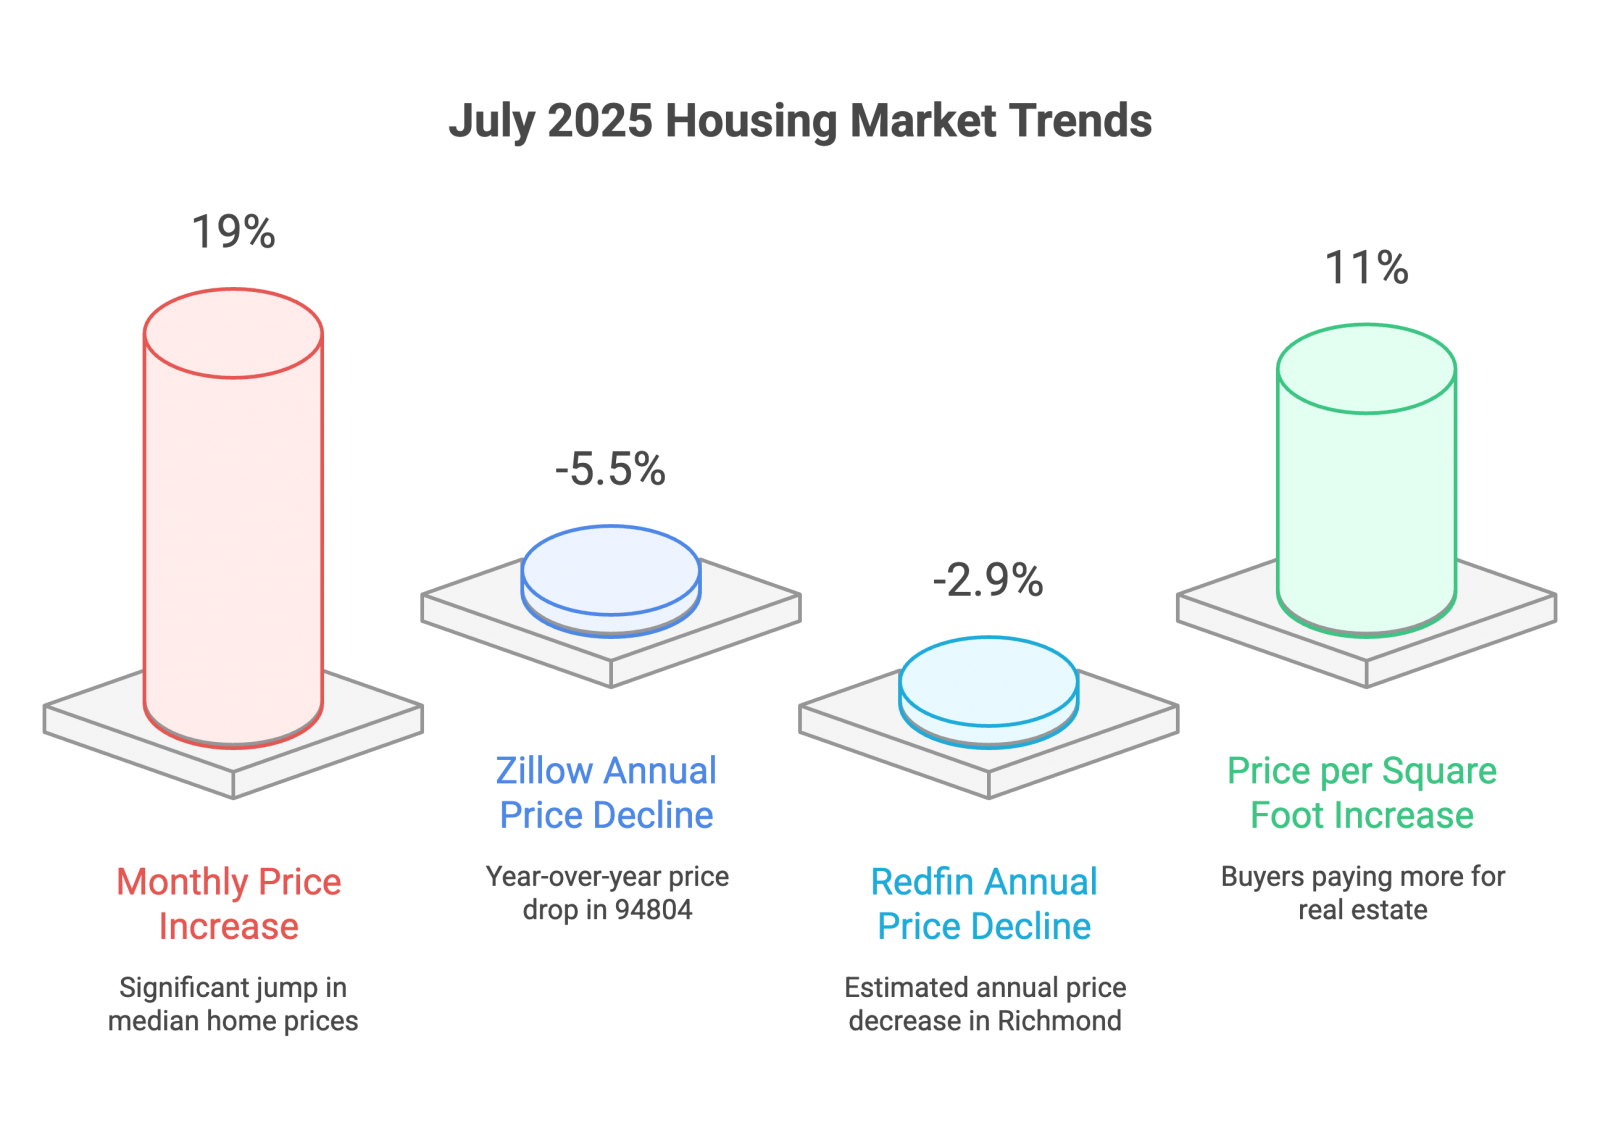
Perhaps the most eye-catching change in July was the surge in median sold price. The median price for single-family homes jumped to $595,000, up 19% from June. This kind of one-month jump is significant. It could be influenced by a mix of factors: possibly a few higher-end home sales in July, seasonal demand peaking, or simply the result of buyers willing to stretch budgets to compete.
Year-over-year, prices are actually slightly lower – roughly 3–5% below July 2024 levels, depending on the data (source redfin.com). (For instance, Zillow reports values in 94804 are down ~5.5% vs. last year (zillow.com), and Redfin estimates about a 2.9% annual decline for this zip (redfin.com.) This suggests that the market cooled off in the past year (likely due in part to higher interest rates in 2024-2025), but now prices are ticking back up on a monthly basis. In short, we may have passed the price dip and are seeing prices climb again this summer.
For investors evaluating deals, note the median price per square foot hit around $529 in July (up ~11% from June). Rising $/sqft and rising sale prices imply buyers are paying more value for the same real estate. If you’ve been waiting for the “bottom” to invest, the data hints that the market is regaining momentum. However, keep an eye on interest rates – higher borrowing costs can cap price growth even in tight markets. It’s a good idea to run your rental or flip projections with some cushion, but overall Richmond’s trend of limited supply bodes well for holding property long-term.
Homes Are Selling Fast (But Slightly Slower than June)
Homes in Richmond 94804 are still selling quickly by any normal standard. The typical home that sold in July was on the market for 22 days (median). That’s just a little over 3 weeks from listing to going under contract – lightning-fast compared to many markets. By comparison, in a cooler market it might take 1-2 months or more for a home to sell. Here we’re seeing many homes move in under a month.
It is worth noting that 22 days is a bit slower than in June, when the median was about 15 days. So, while buyers are still snapping up homes, they aren’t quite as frenzied as a month ago. A likely reason? June’s low inventory and summer rush might have caused a flurry, and July saw more new listings giving buyers a few extra choices, so homes took a week longer on average to sell. Additionally, as prices rise, some buyers may be getting priced out or just taking a bit more time to decide.
For sellers, 22 days on market is still great – that’s a quick sale! To maximize your chances of a swift transaction, price your home competitively and make it show-ready from day one. Many Richmond buyers are well-informed and act fast when they see a good property. We also continue to see multiple-offer situations (remember that 5+ offers per home on average in Richmond in recent months (redfin.com), so a well-priced listing can still ignite a bidding war and possibly push that sale price above asking.
More Listings and Sales Activity in July
July brought a welcome influx of fresh inventory: 26 new listings in the 94804 zip. That’s over one-third more than we saw in June. This surge of new properties could be seasonal (summer is often a popular time to list) or driven by sellers trying to capitalize on the high buyer demand. Either way, if you’re an owner thinking of selling, it shows others are seizing the moment – and buyers did absorb the inventory pretty readily.
On the demand side, 15 homes sold in July, up from June’s sales. So buyers were out there and ready to make offers, keeping the market moving. Interestingly, the total dollar volume of homes sold jumped over 40% month-to-month, reflecting both the higher number of sales and the higher prices. In dollar terms, about $9.1 million worth of single-family homes transacted in July in 94804.
For investors, an increase in sales activity can mean more comparable sales data to gauge property values. If you’re looking to buy, you might face competition, but you also have a few more listings to choose from than earlier in the year. It’s encouraging to see more listings because it hints that some homeowners feel confident to sell now, possibly aiming to lock in gains from the past few years of appreciation. If you find a property that meets your criteria, be prepared to move quickly (popular listings still go into contract in just days or a couple weeks). Make sure your financing is lined up so you can put in a strong offer when the right deal appears.
What the July Trends Mean for You
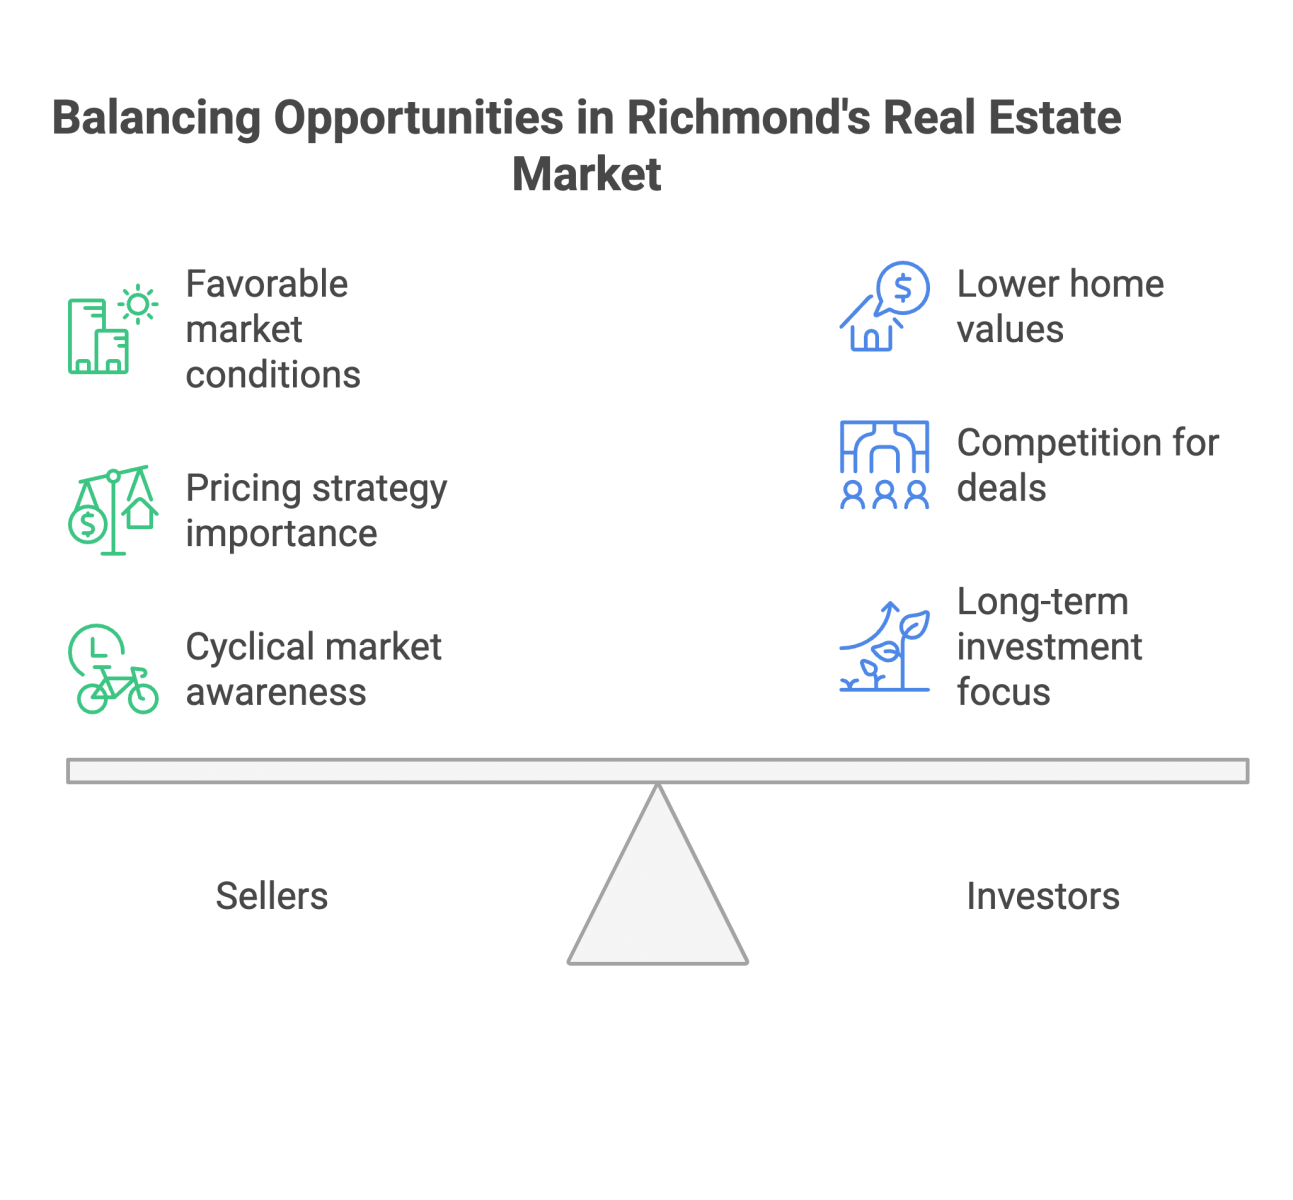
For Sellers: Richmond 94804 in July 2025 was about as seller-friendly as it gets – low inventory, rising prices, and buyers paying over asking on average. If you’ve been on the fence about selling your property, conditions are in your favor. You’re likely to encounter motivated buyers, and with the median sale around $595K, you might be pleasantly surprised at your home’s current market value. However, pricing strategy remains important; buyers are savvy and will sense if a home is overpriced. Correctly priced homes are the ones getting multiple offers and selling fast. I’d be happy to provide a free home valuation and discuss how to prepare your home to get top dollar in this market (just reach out!). Remember, while the market is hot now, real estate is cyclical – taking advantage of a seller’s market while it lasts could be a smart move.
For Investors: The Richmond market offers a mix of opportunity and challenge. On one hand, home values are a tad lower than a year ago, which can be viewed as a chance to buy at a slight discount relative to peak prices. Rental demand in a tight housing market tends to remain solid – if prospective buyers can’t find a home to purchase, many will keep renting, which supports occupancy for landlords. Flip investors might find that well-located properties can still be renovated and sold for a profit given buyers’ willingness to pay a premium for turnkey homes (especially with so many older homes in Richmond that could use updates). On the other hand, competition for deals is stiff – you won’t be the only one eyeing that underpriced fixer-upper. Due diligence is key: factor in higher financing costs (if borrowing at today’s interest rates) and be conservative with your ARV (After Repair Value) estimates since the market, while rising month-to-month, isn’t skyrocketing like in 2021. Focus on properties where you can add value (through improvements or better management) and have a strategy for either a quick turnaround or holding through any short-term fluctuations. In sum, the fundamentals in Richmond (low supply, steady demand) make it an attractive market for long-term investment – just be sure to buy smart.
Conclusion
In Richmond, CA 94804, the July 2025 real estate scene was defined by low supply and high demand. Sellers are in the driver’s seat with homes selling fast and often above asking. Buyers and investors are adapting to competitive conditions, and while prices are a bit lower than last year’s highs, the recent upward trend suggests confidence returning to the market.
Whether you’re looking to sell your Richmond home or invest in the area, staying informed is half the battle. Every month can bring subtle changes. As a local agent intimately familiar with the Richmond market, I’m here to help you make sense of the data and apply it to your real-world decisions. Feel free to reach out to Harv Balu at Realty Experts for any questions about your specific situation or for a personalized consultation.
Remember: Real estate markets can shift, and while July’s numbers paint a positive picture for sellers, it’s wise to watch how the next few months unfold. I’ll continue to monitor trends for you. In the meantime, enjoy the rest of the summer – and don’t hesitate to call or email if you want to chat about real estate in Richmond! I’m always here to help my neighbors make the most of the market.
Stay Informed & Explore More
Want to dig deeper into Alameda County’s current inventory? Check out this interactive chart with up-to-date real estate trends: View Alameda County Interactive Inventory
Prefer a downloadable version of the July 2025 Fremont Market Report? Grab it here for free: Download Full Report
Find your Dream Home - Search By Cities
Have questions about how these tax changes might affect your plans? Feel free to reach out – as always, I’m here to help my fellow Bay Area neighbors navigate the evolving real estate landscape!
Source: Realtors Property Resource® bridgeMLS, Bay East AOR, or Contra Costa AOR and may not match the public record
Disclaimer: The information provided in this blog is for general informational purposes only and is based on data available as of June 2025. Market conditions can change quickly and may vary by neighborhood and property type. Readers should not construe any information in this post as legal, financial, or real estate advice. For guidance specific to your situation, please consult with a licensed real estate professional. While every effort has been made to ensure accuracy, no guarantees are made regarding completeness or reliability.