



Alameda County Real Estate Interactive Inventory
October 17, 2026 · Alameda County Market Dashboard
TODAY'S LIVE INVENTORY
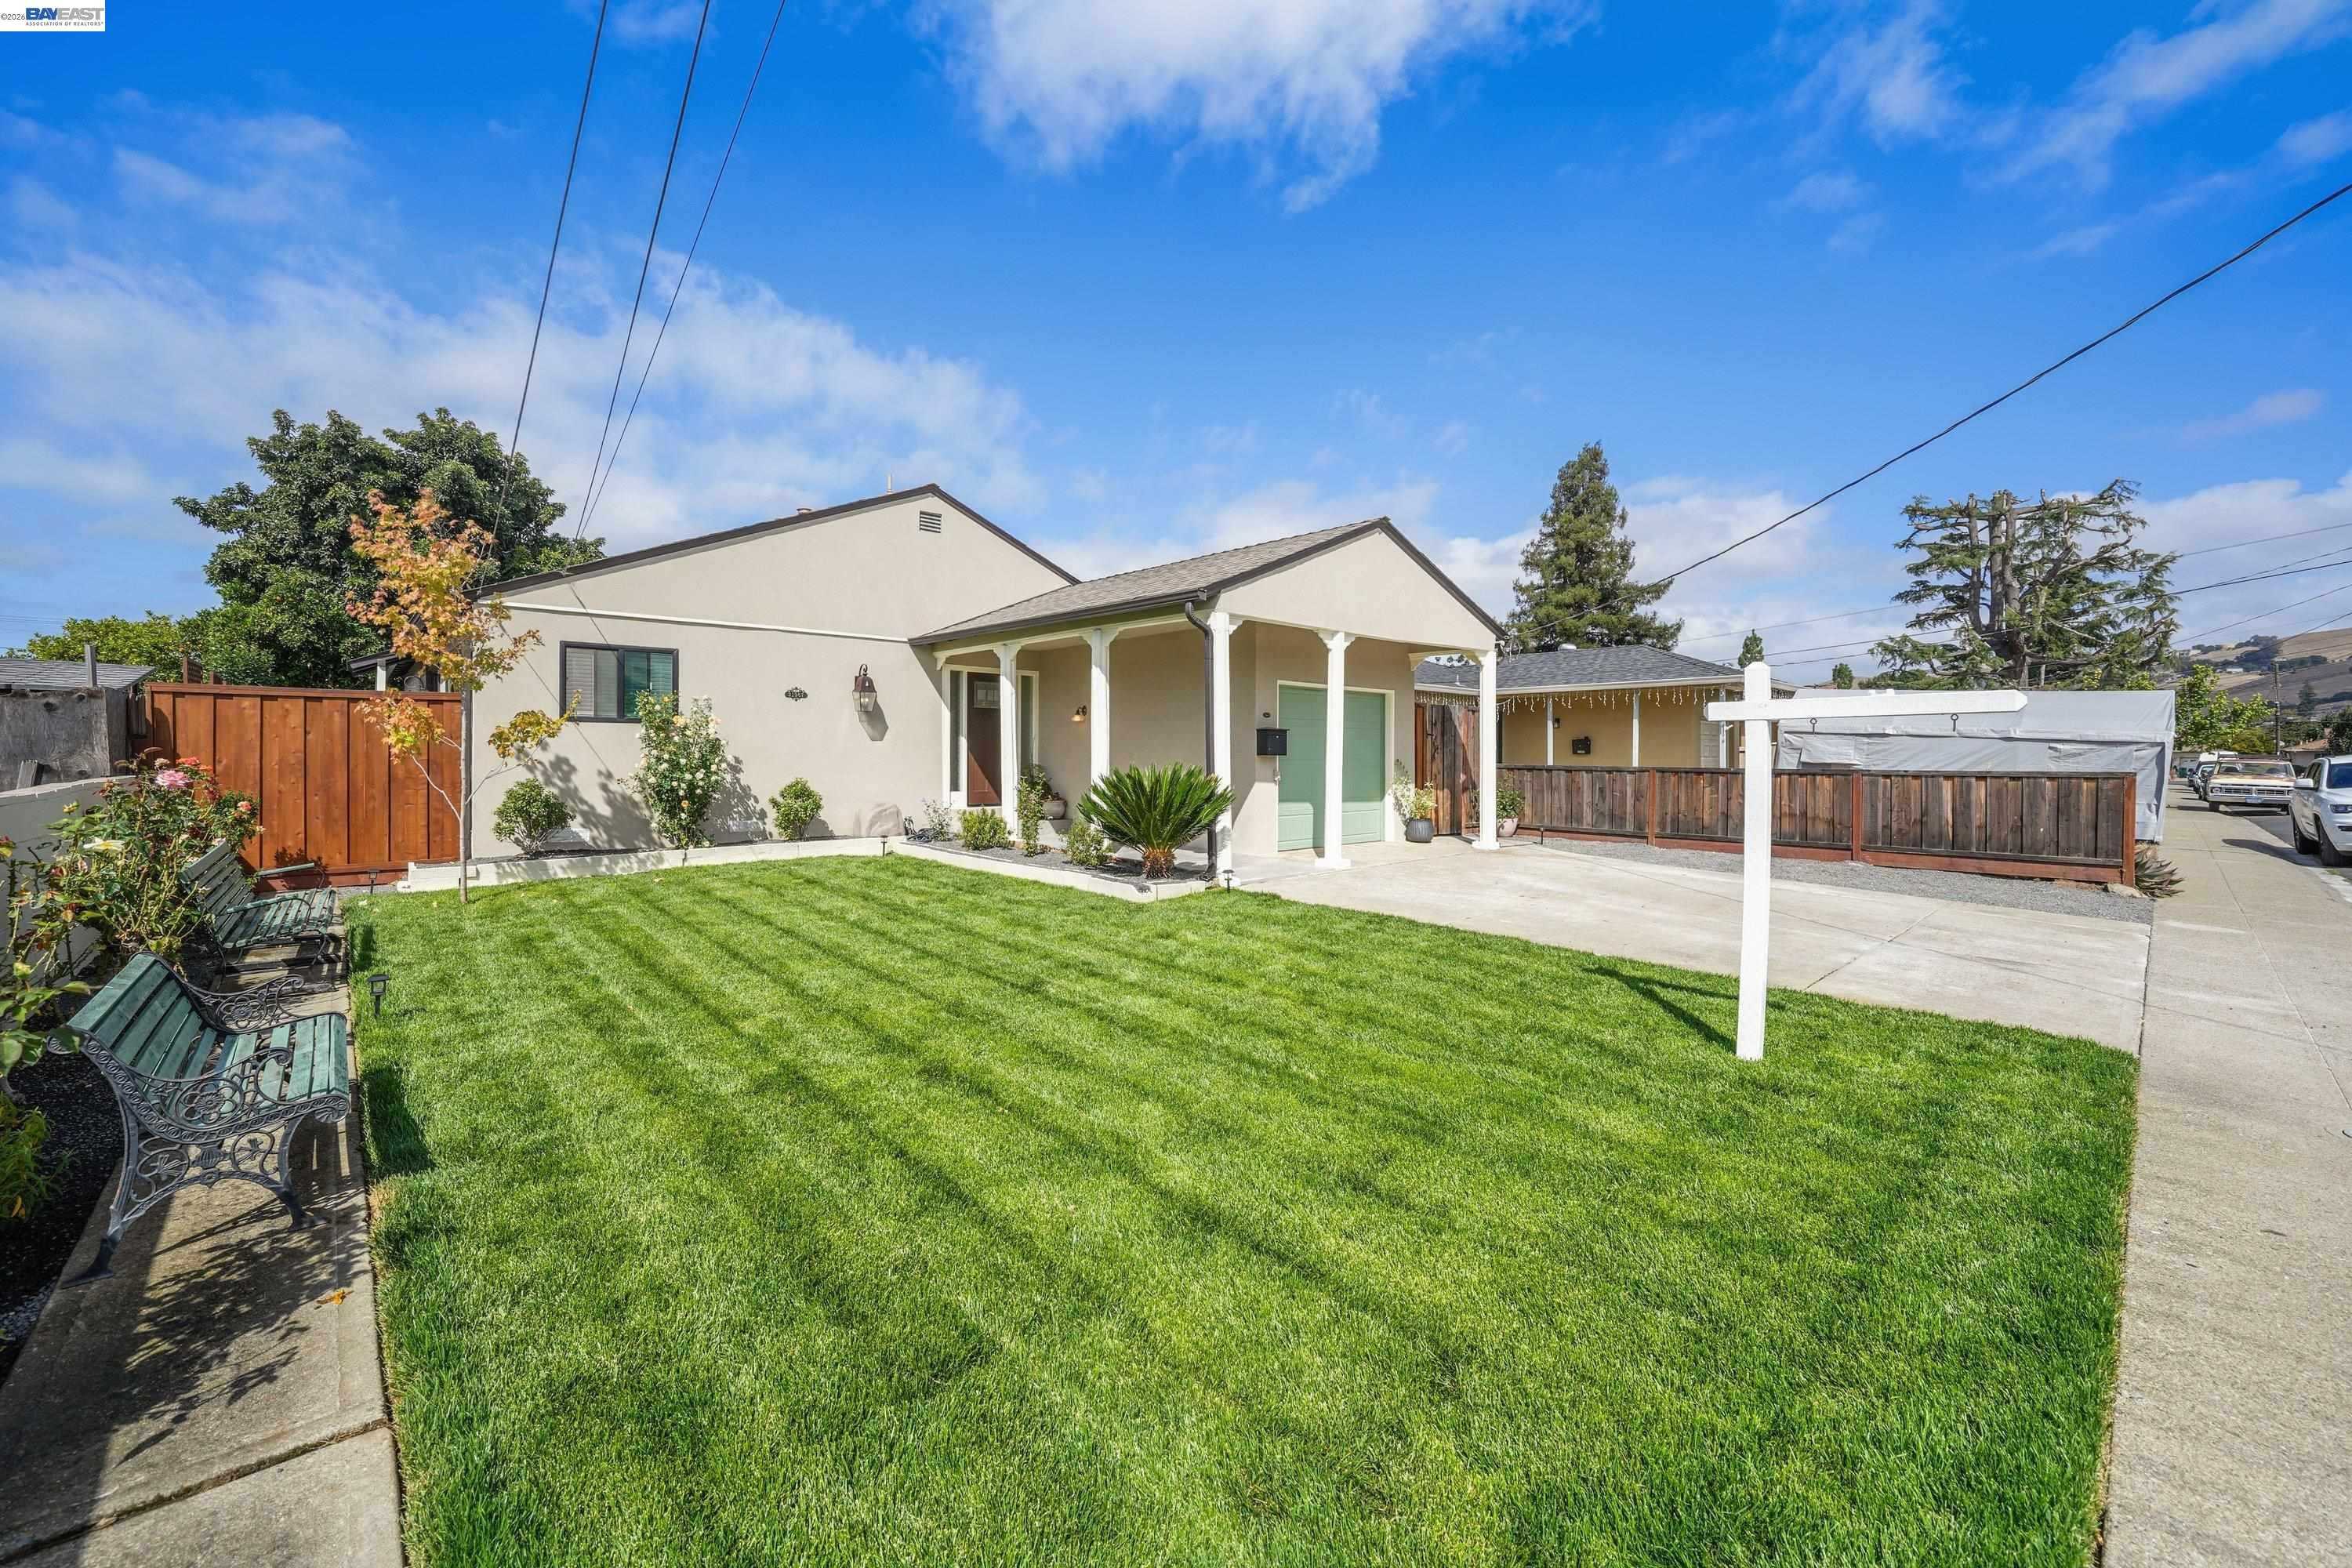
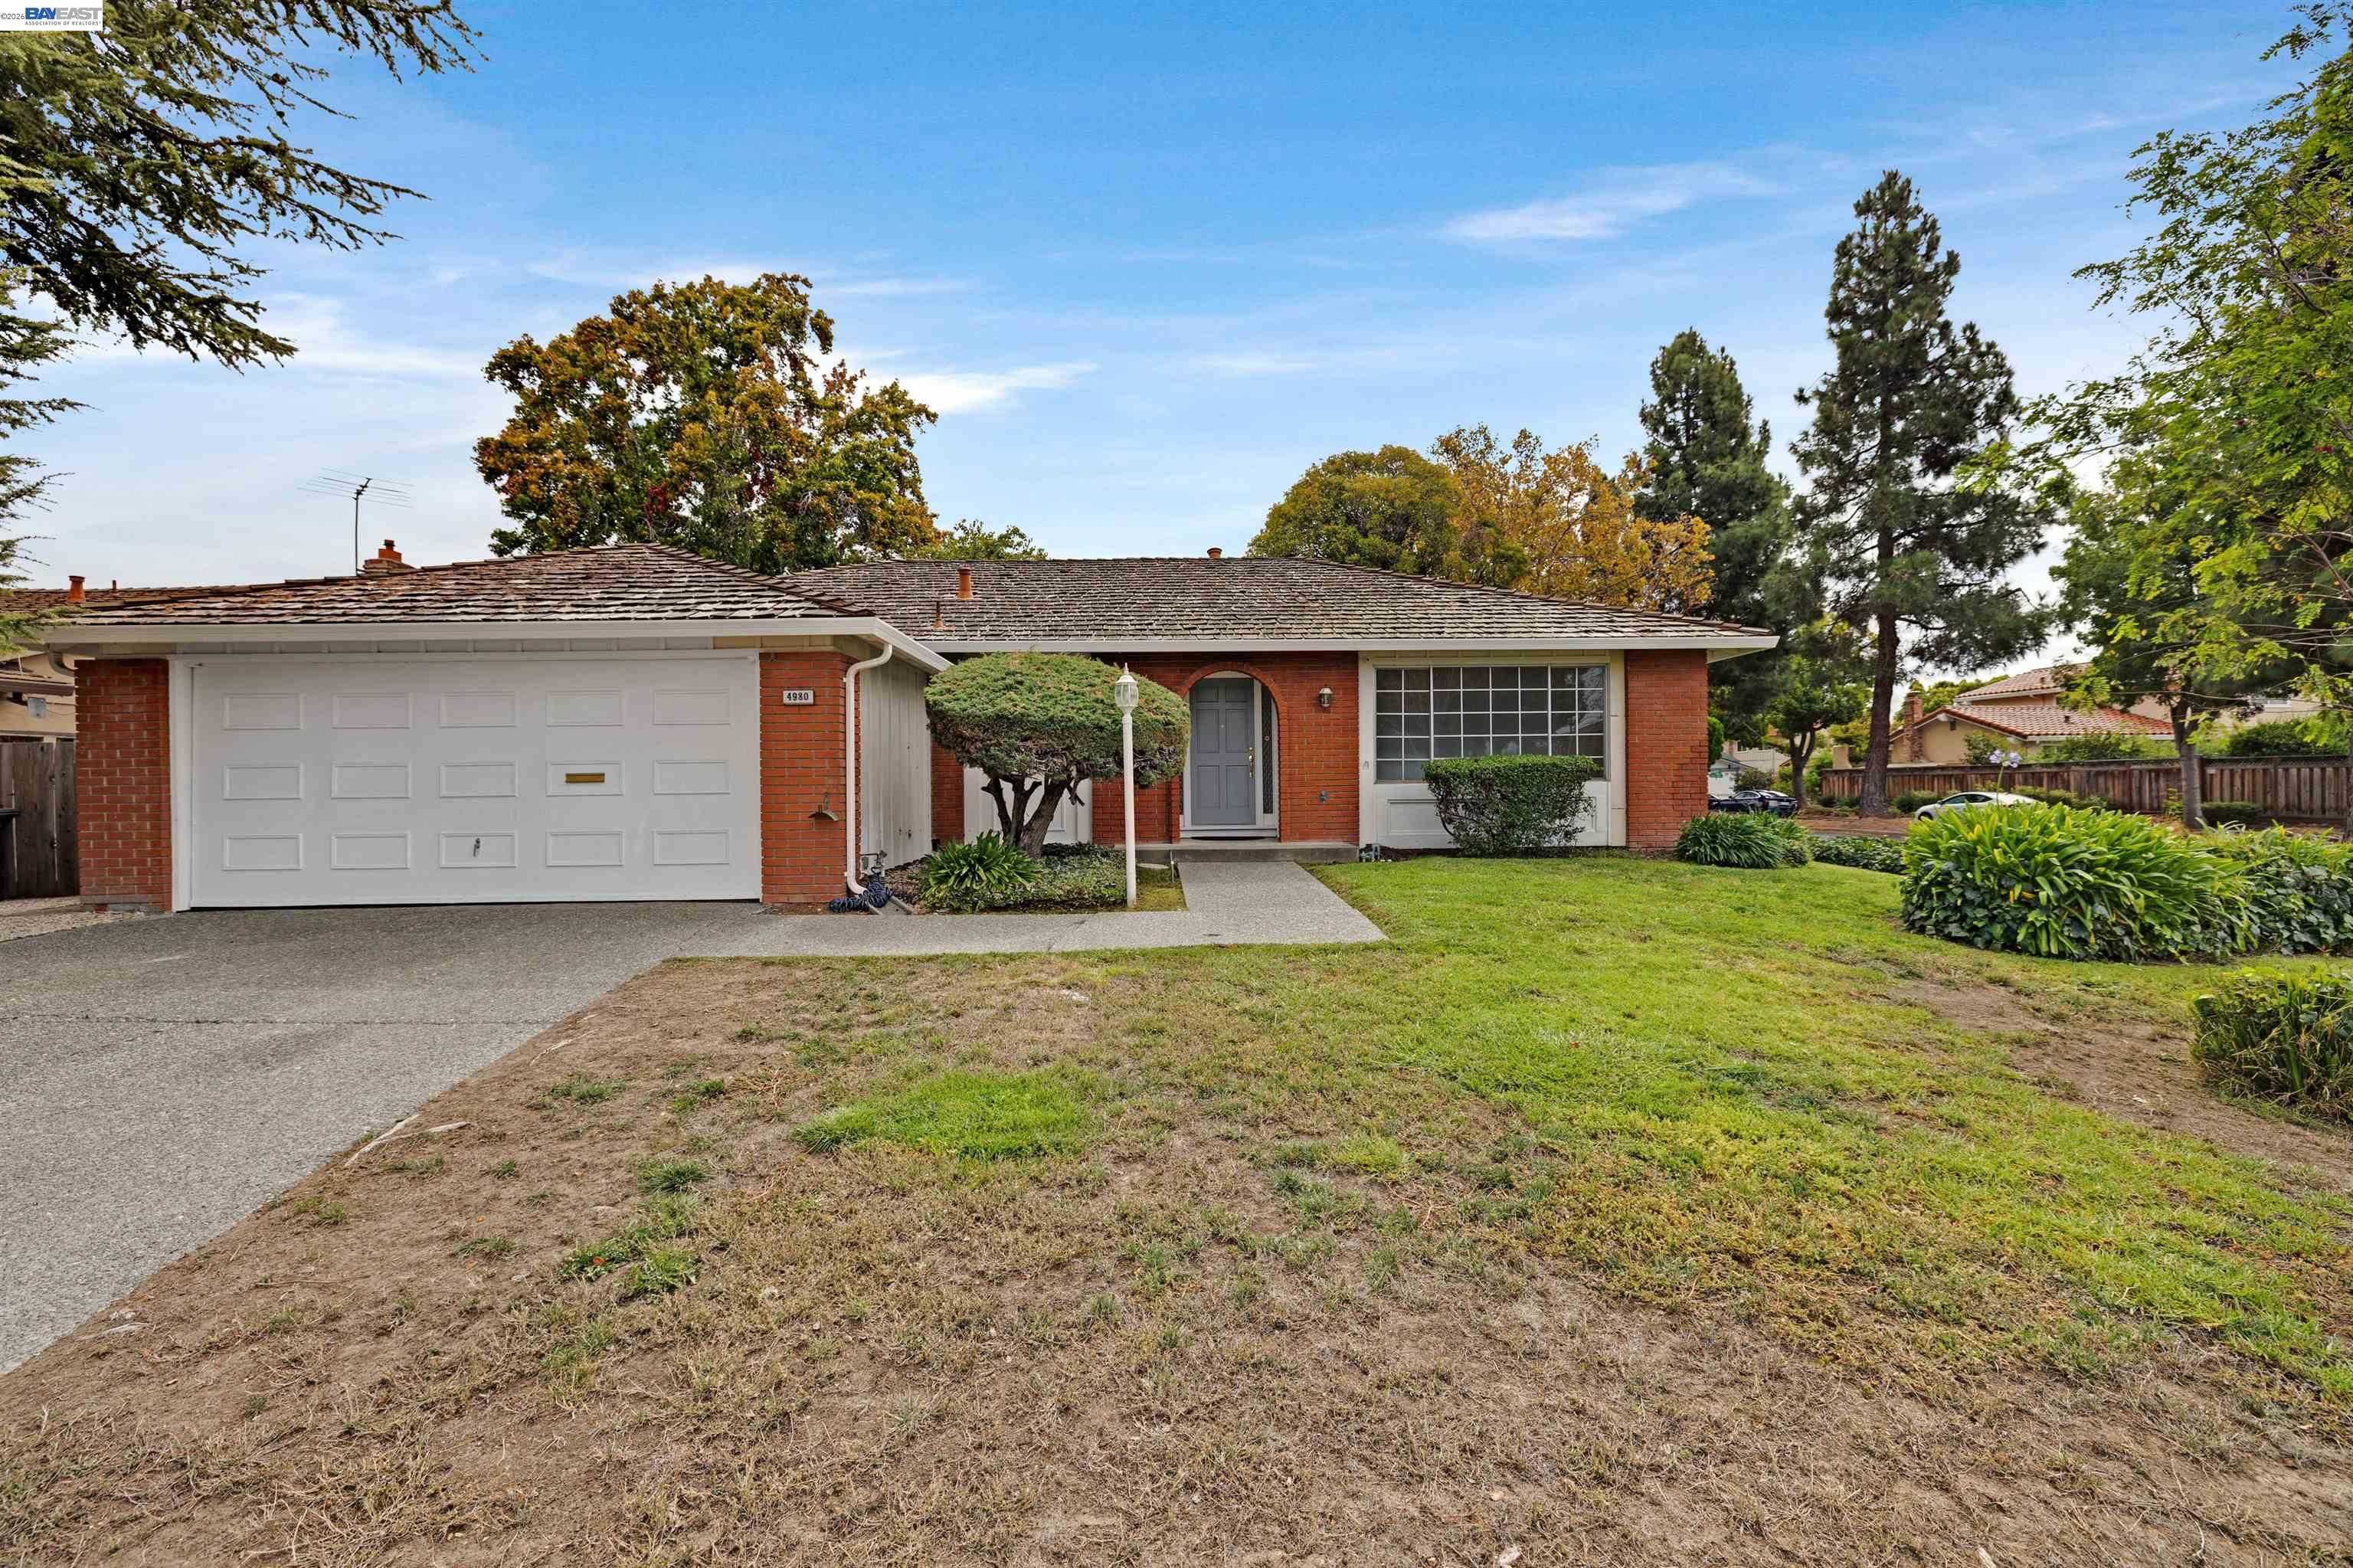
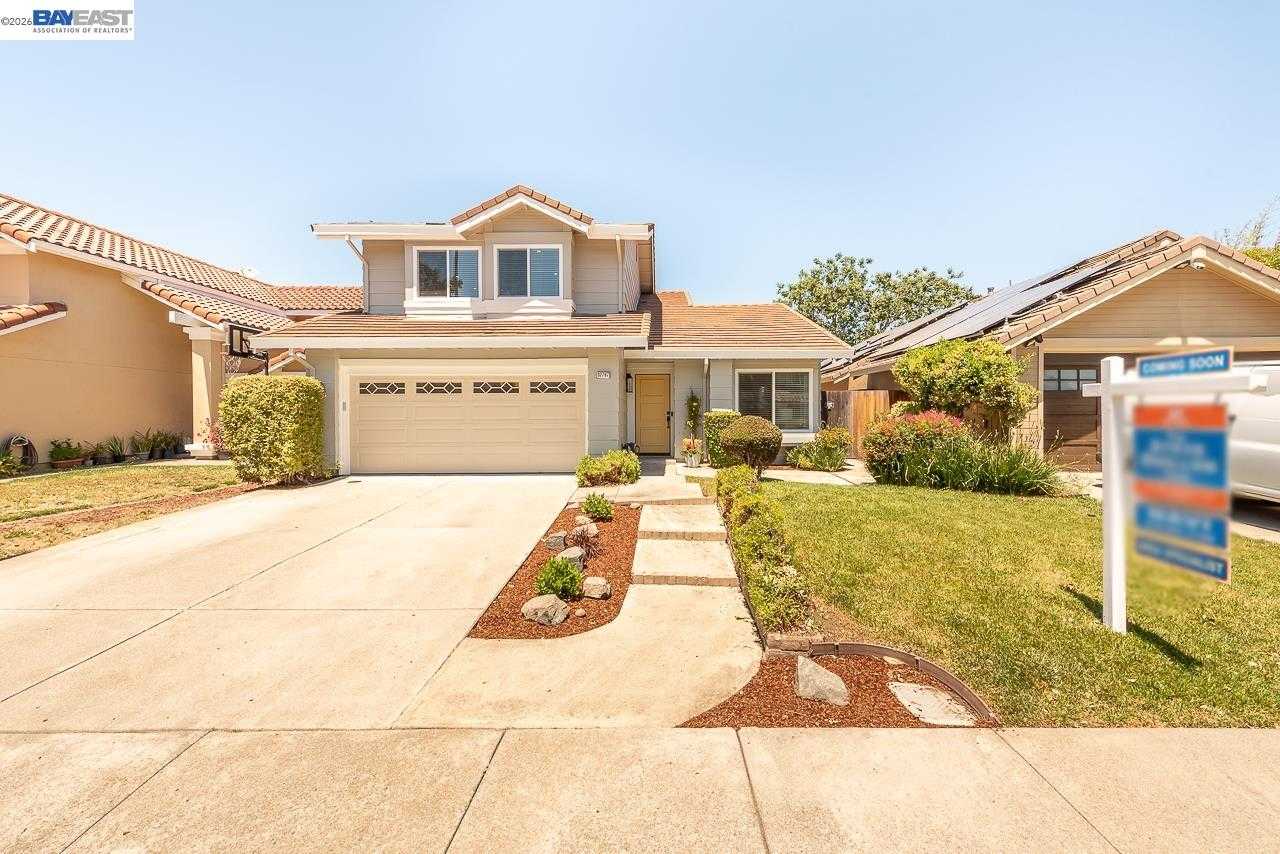
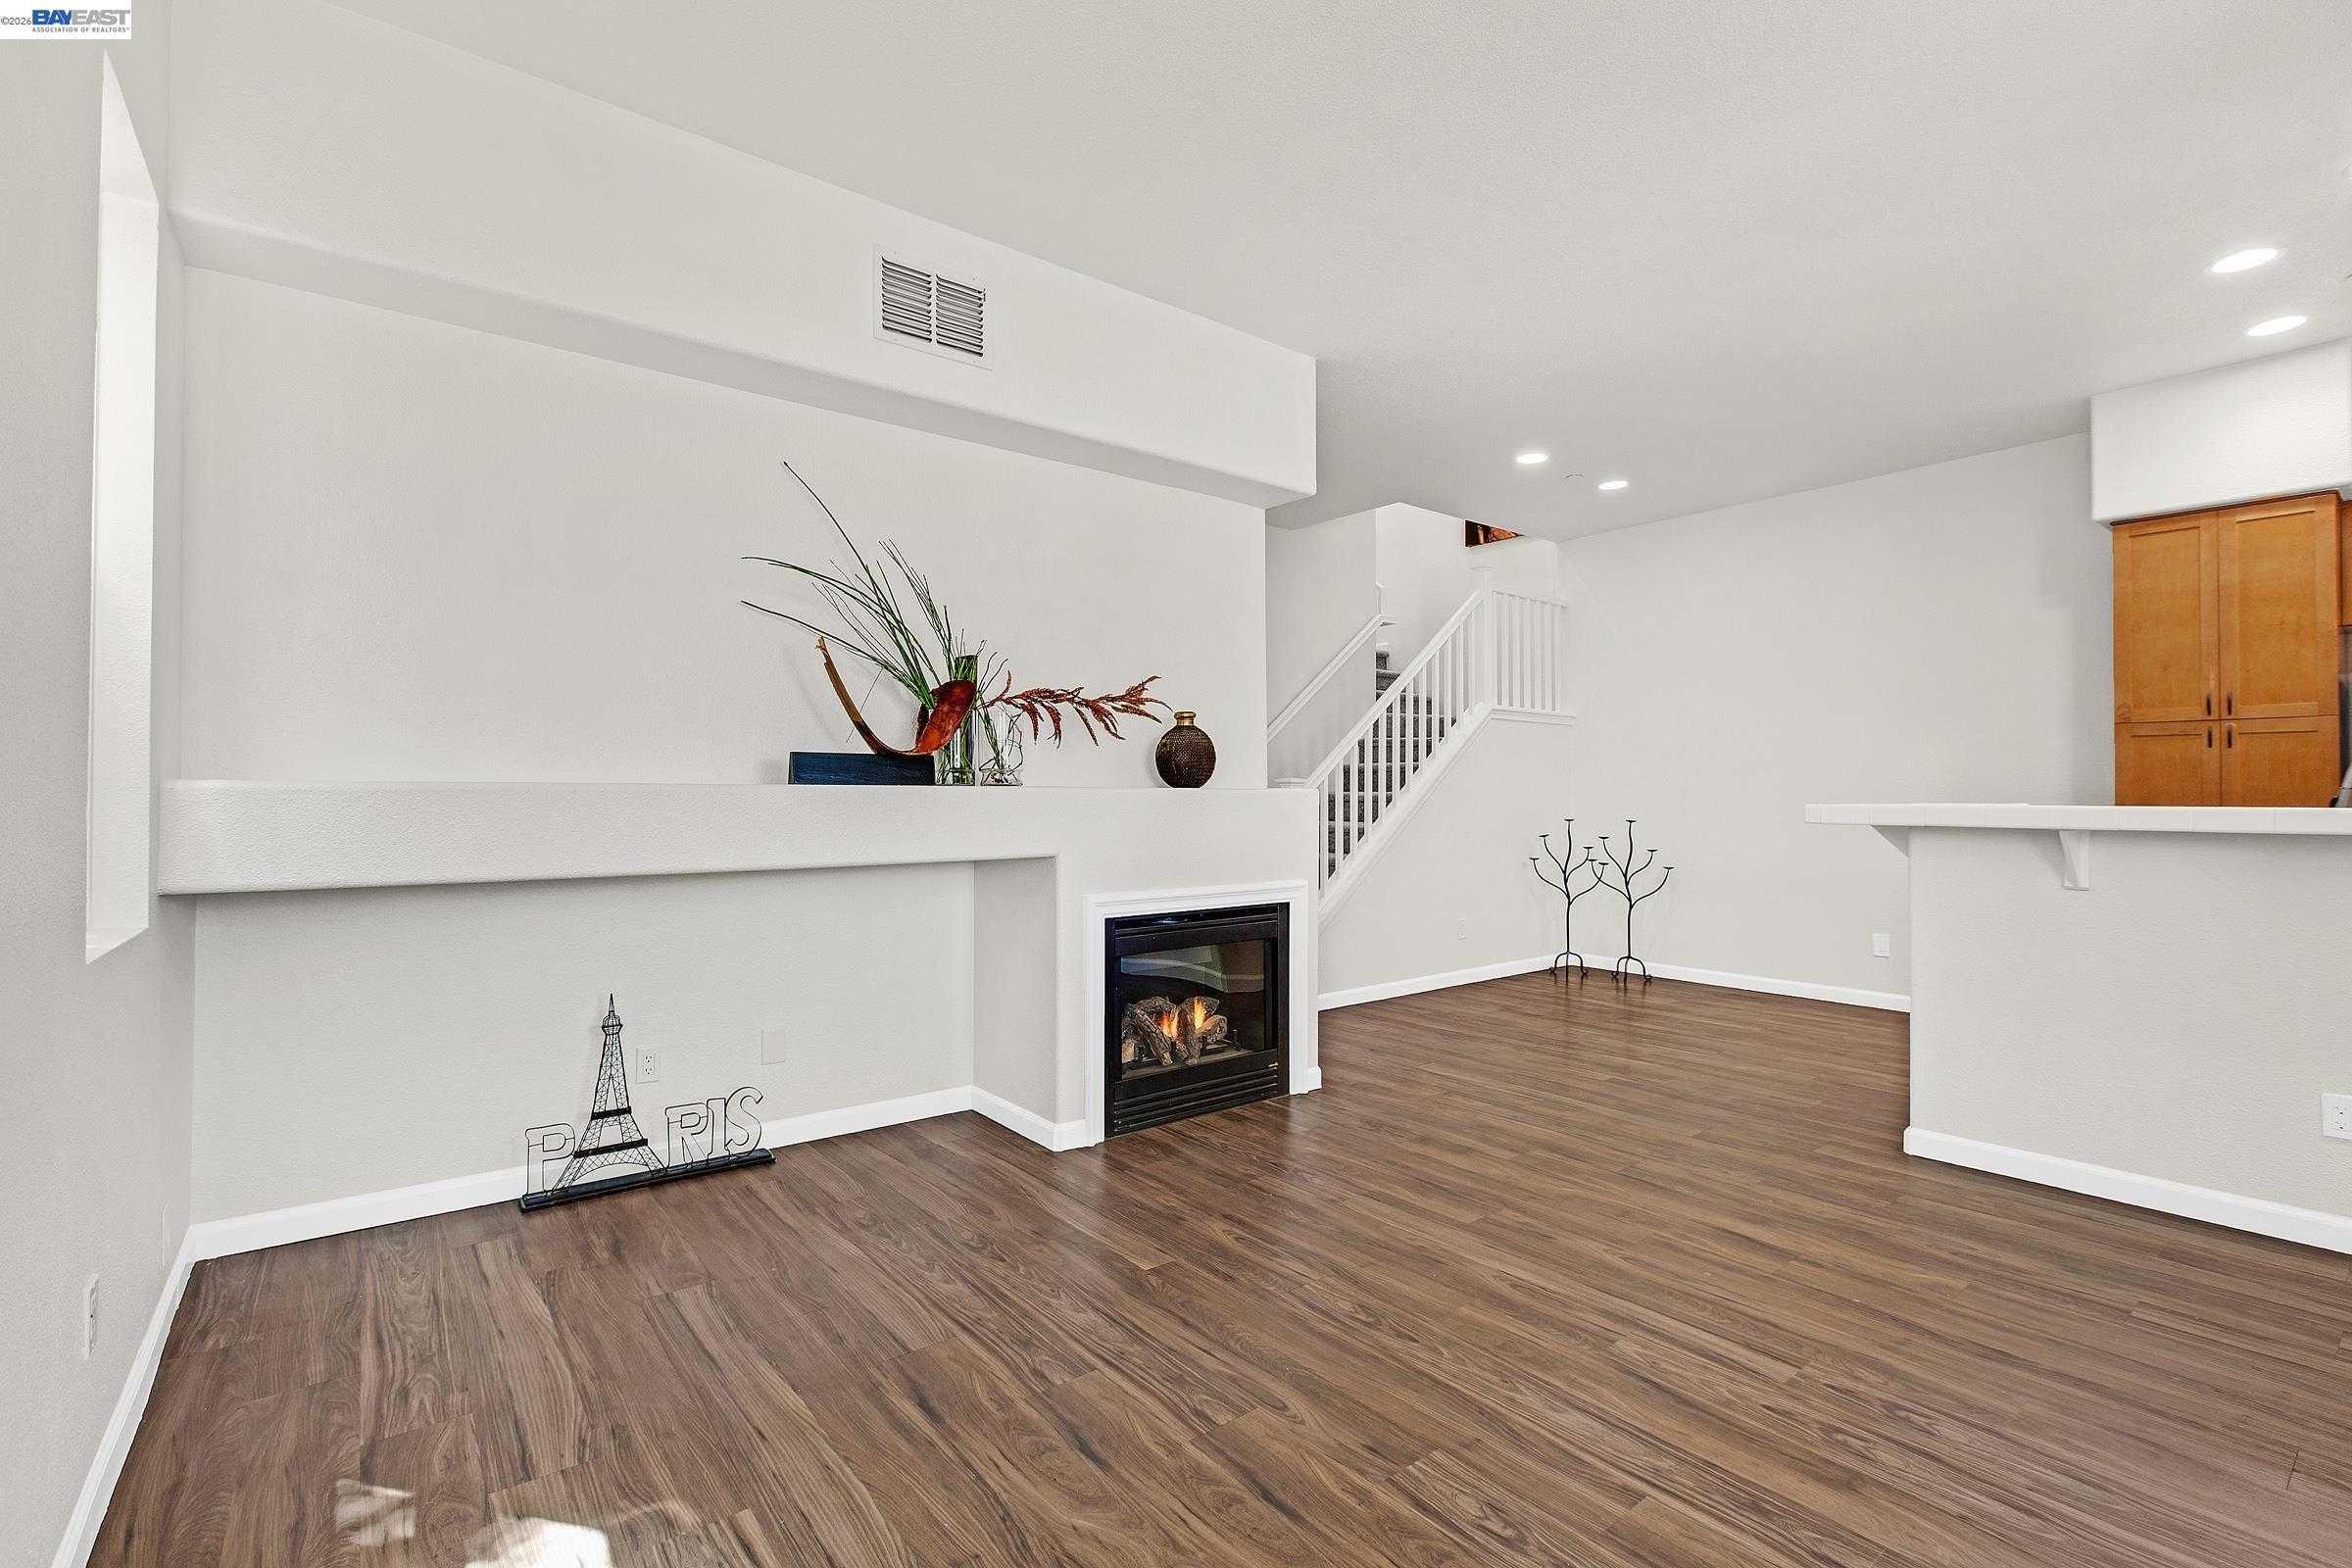
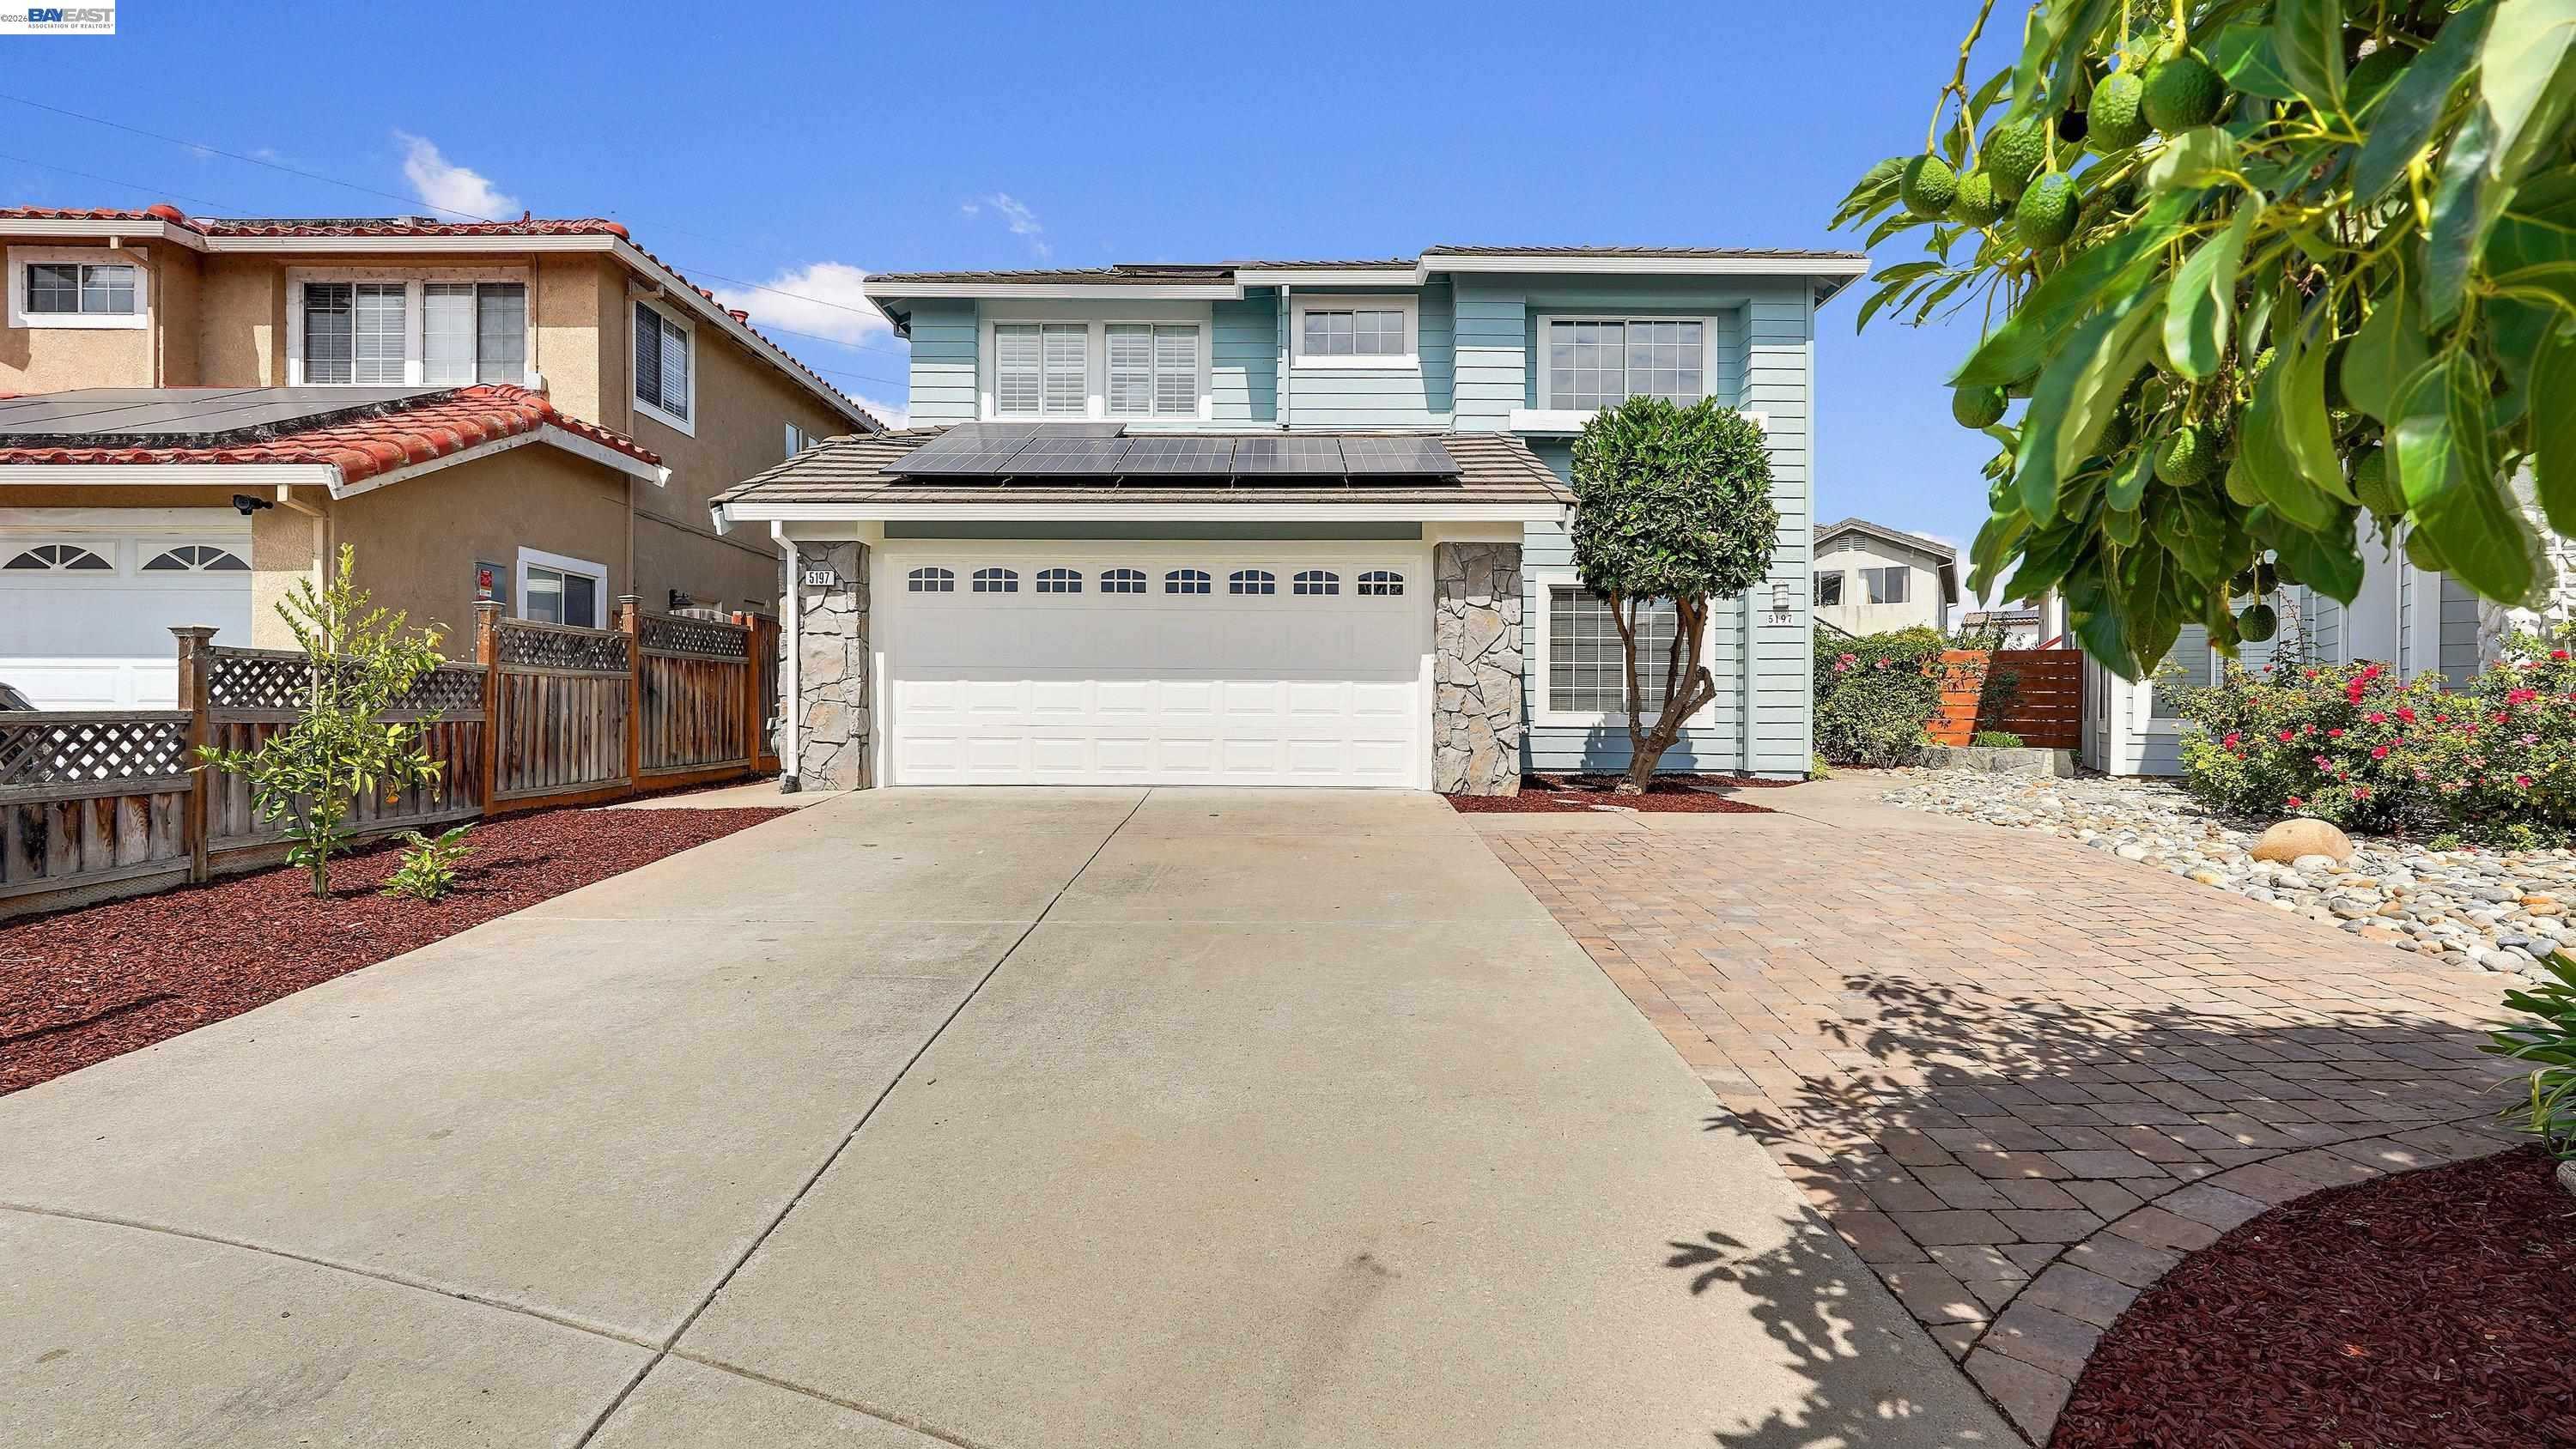
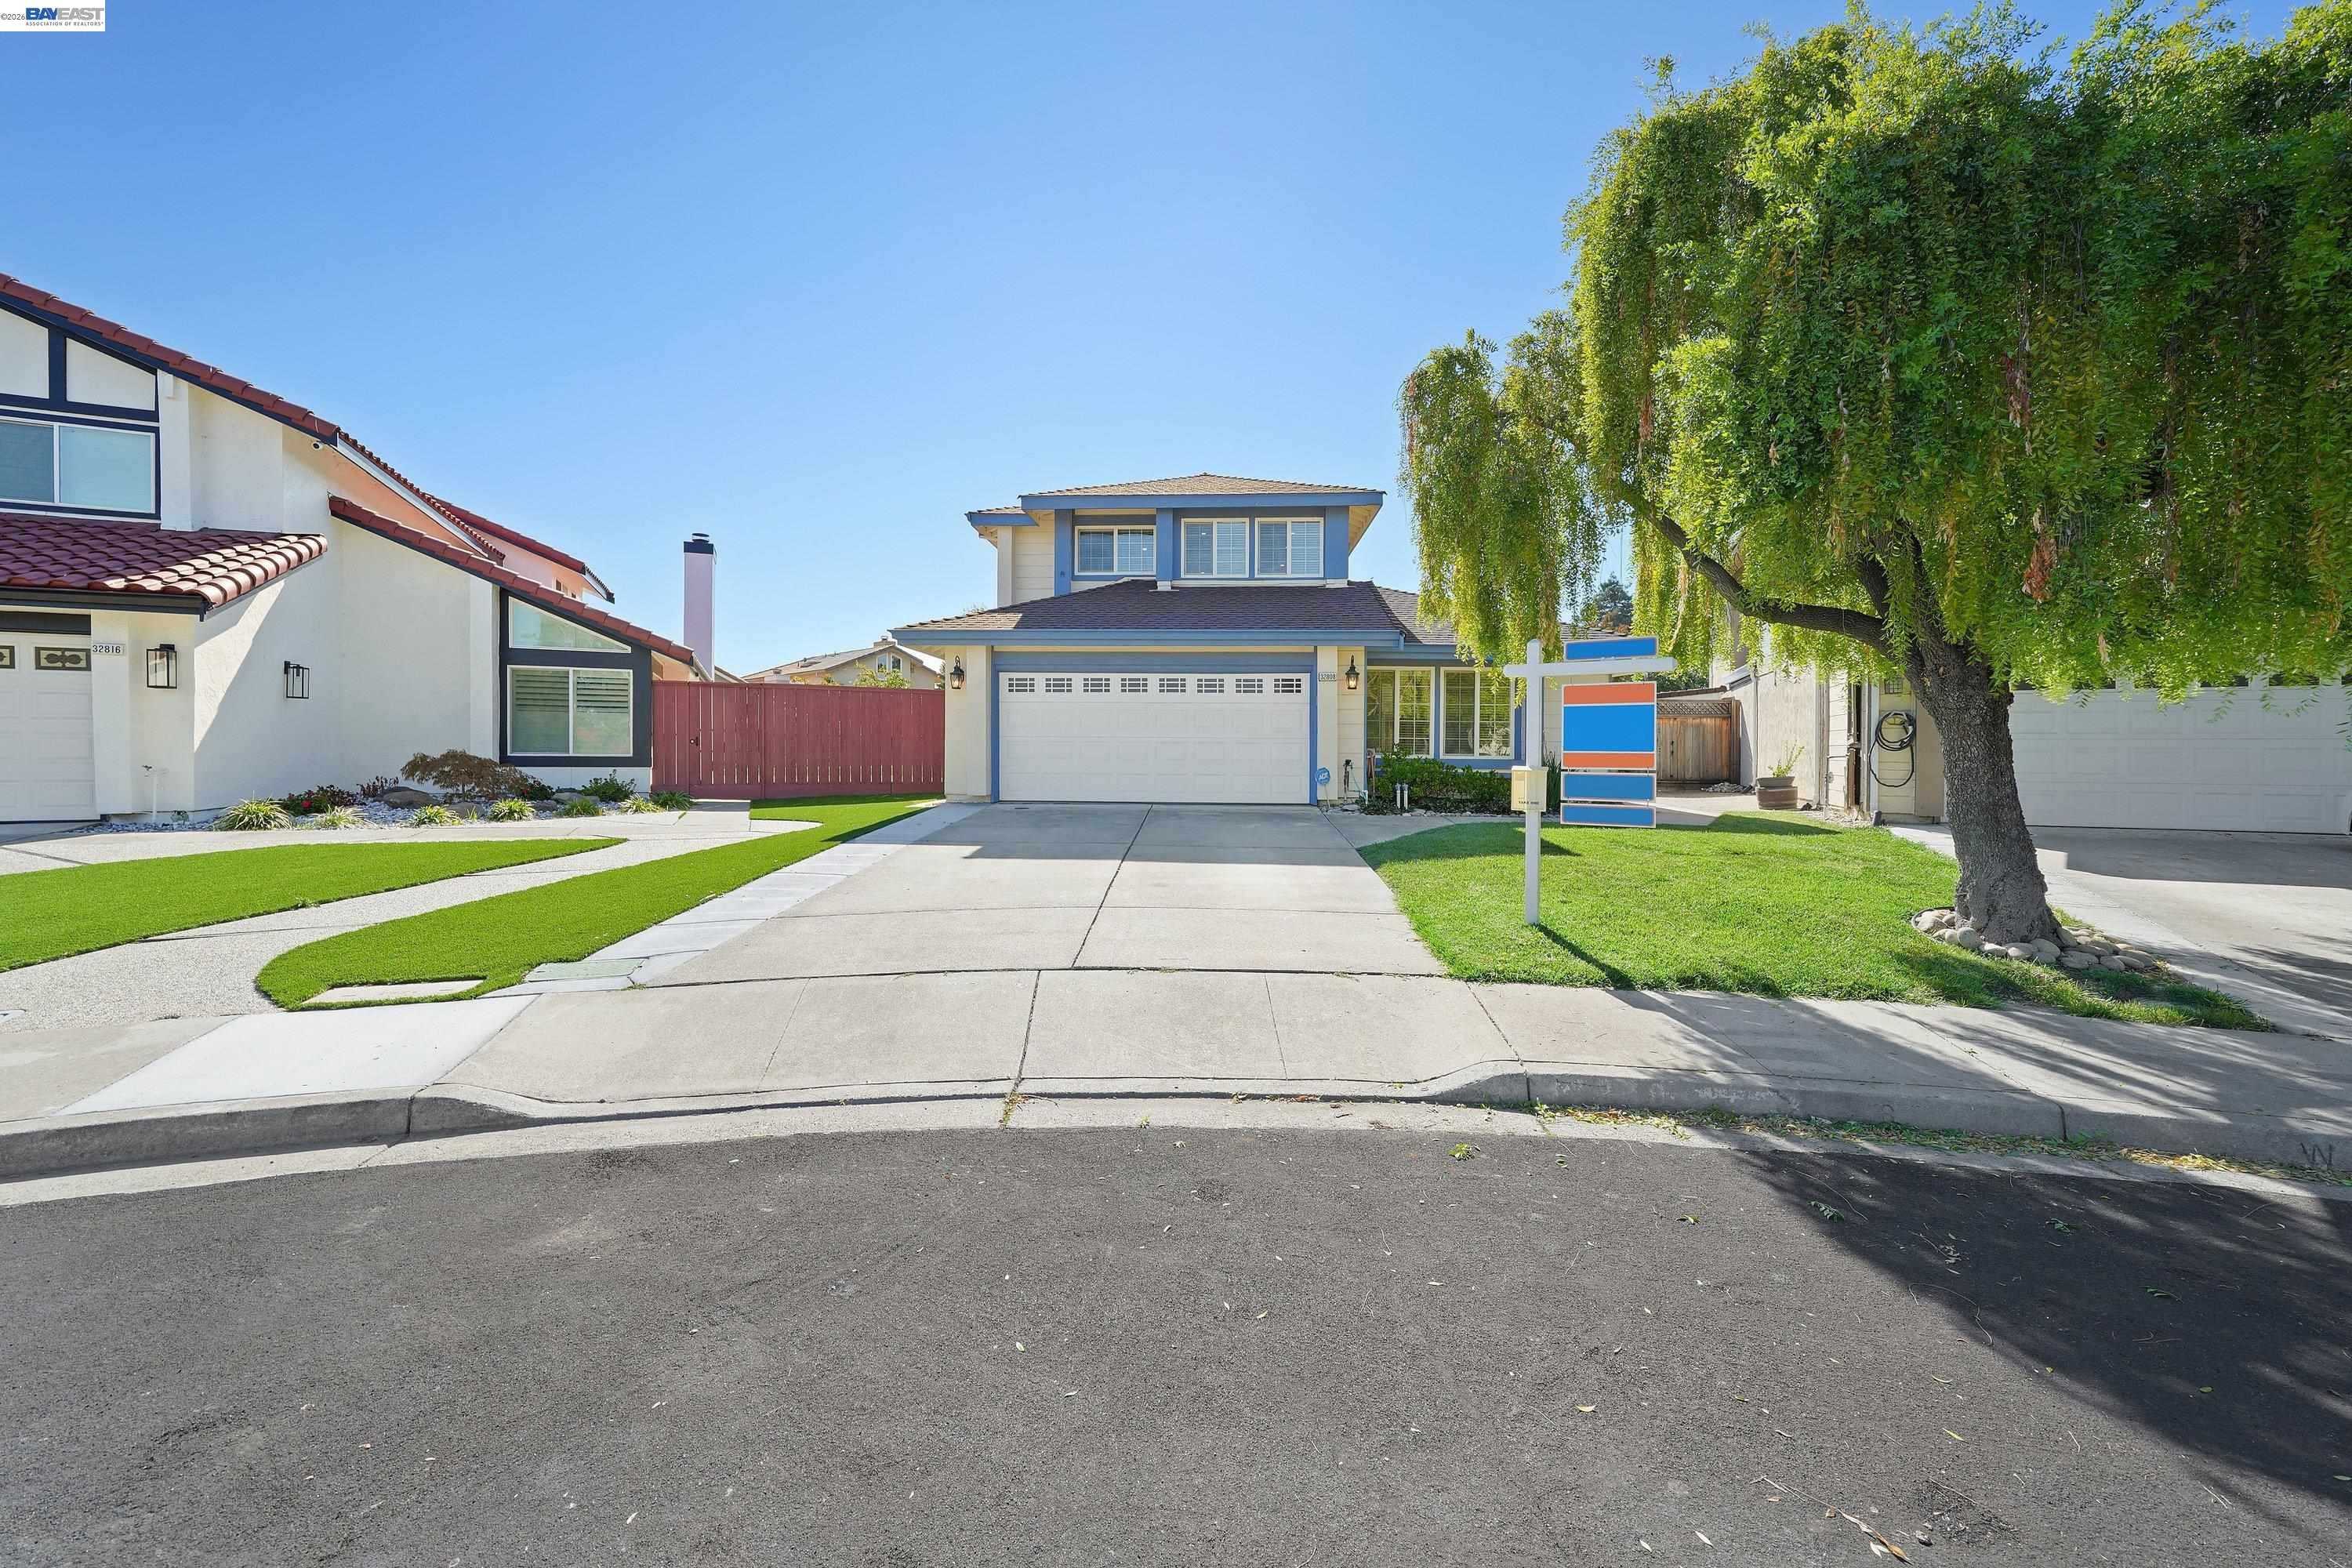
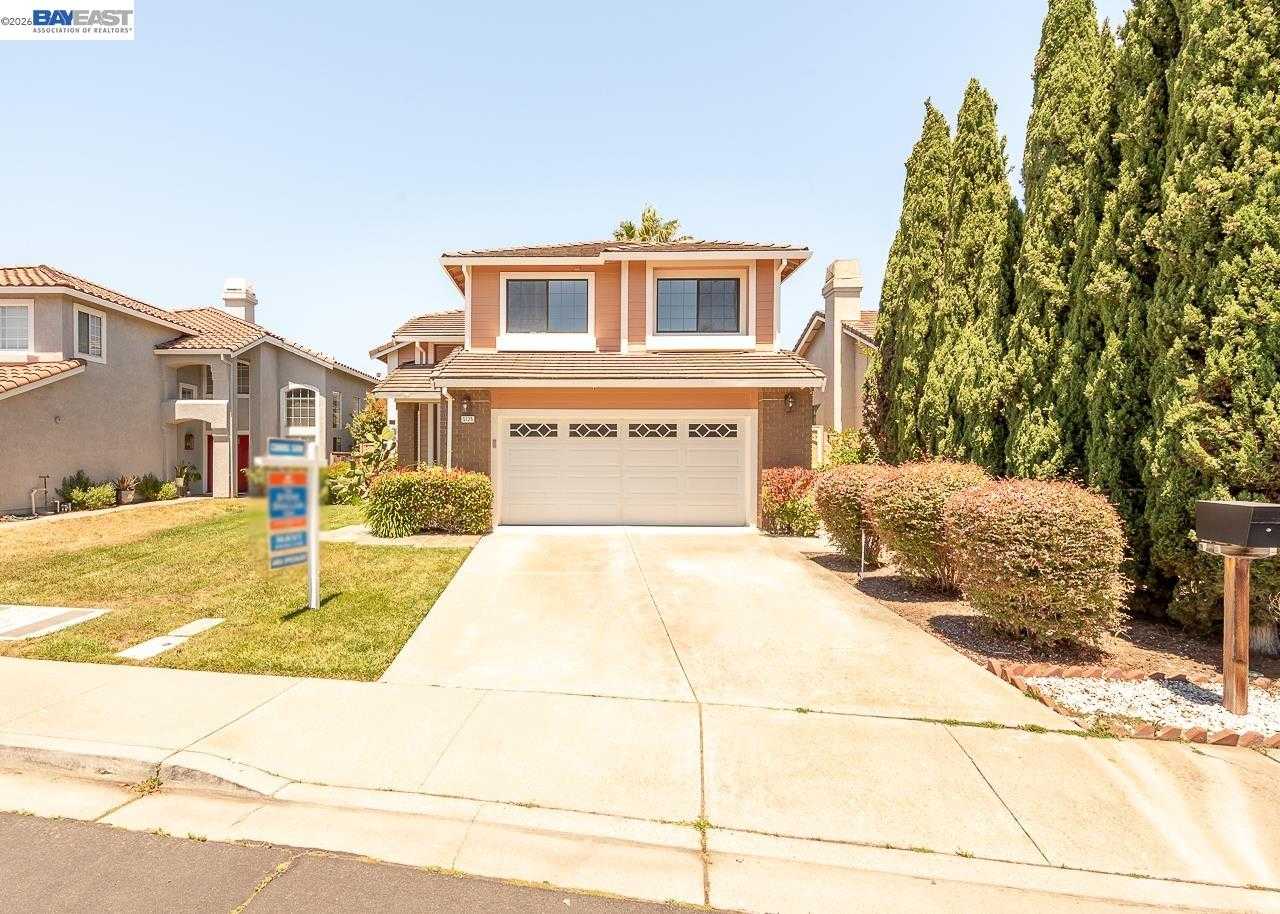
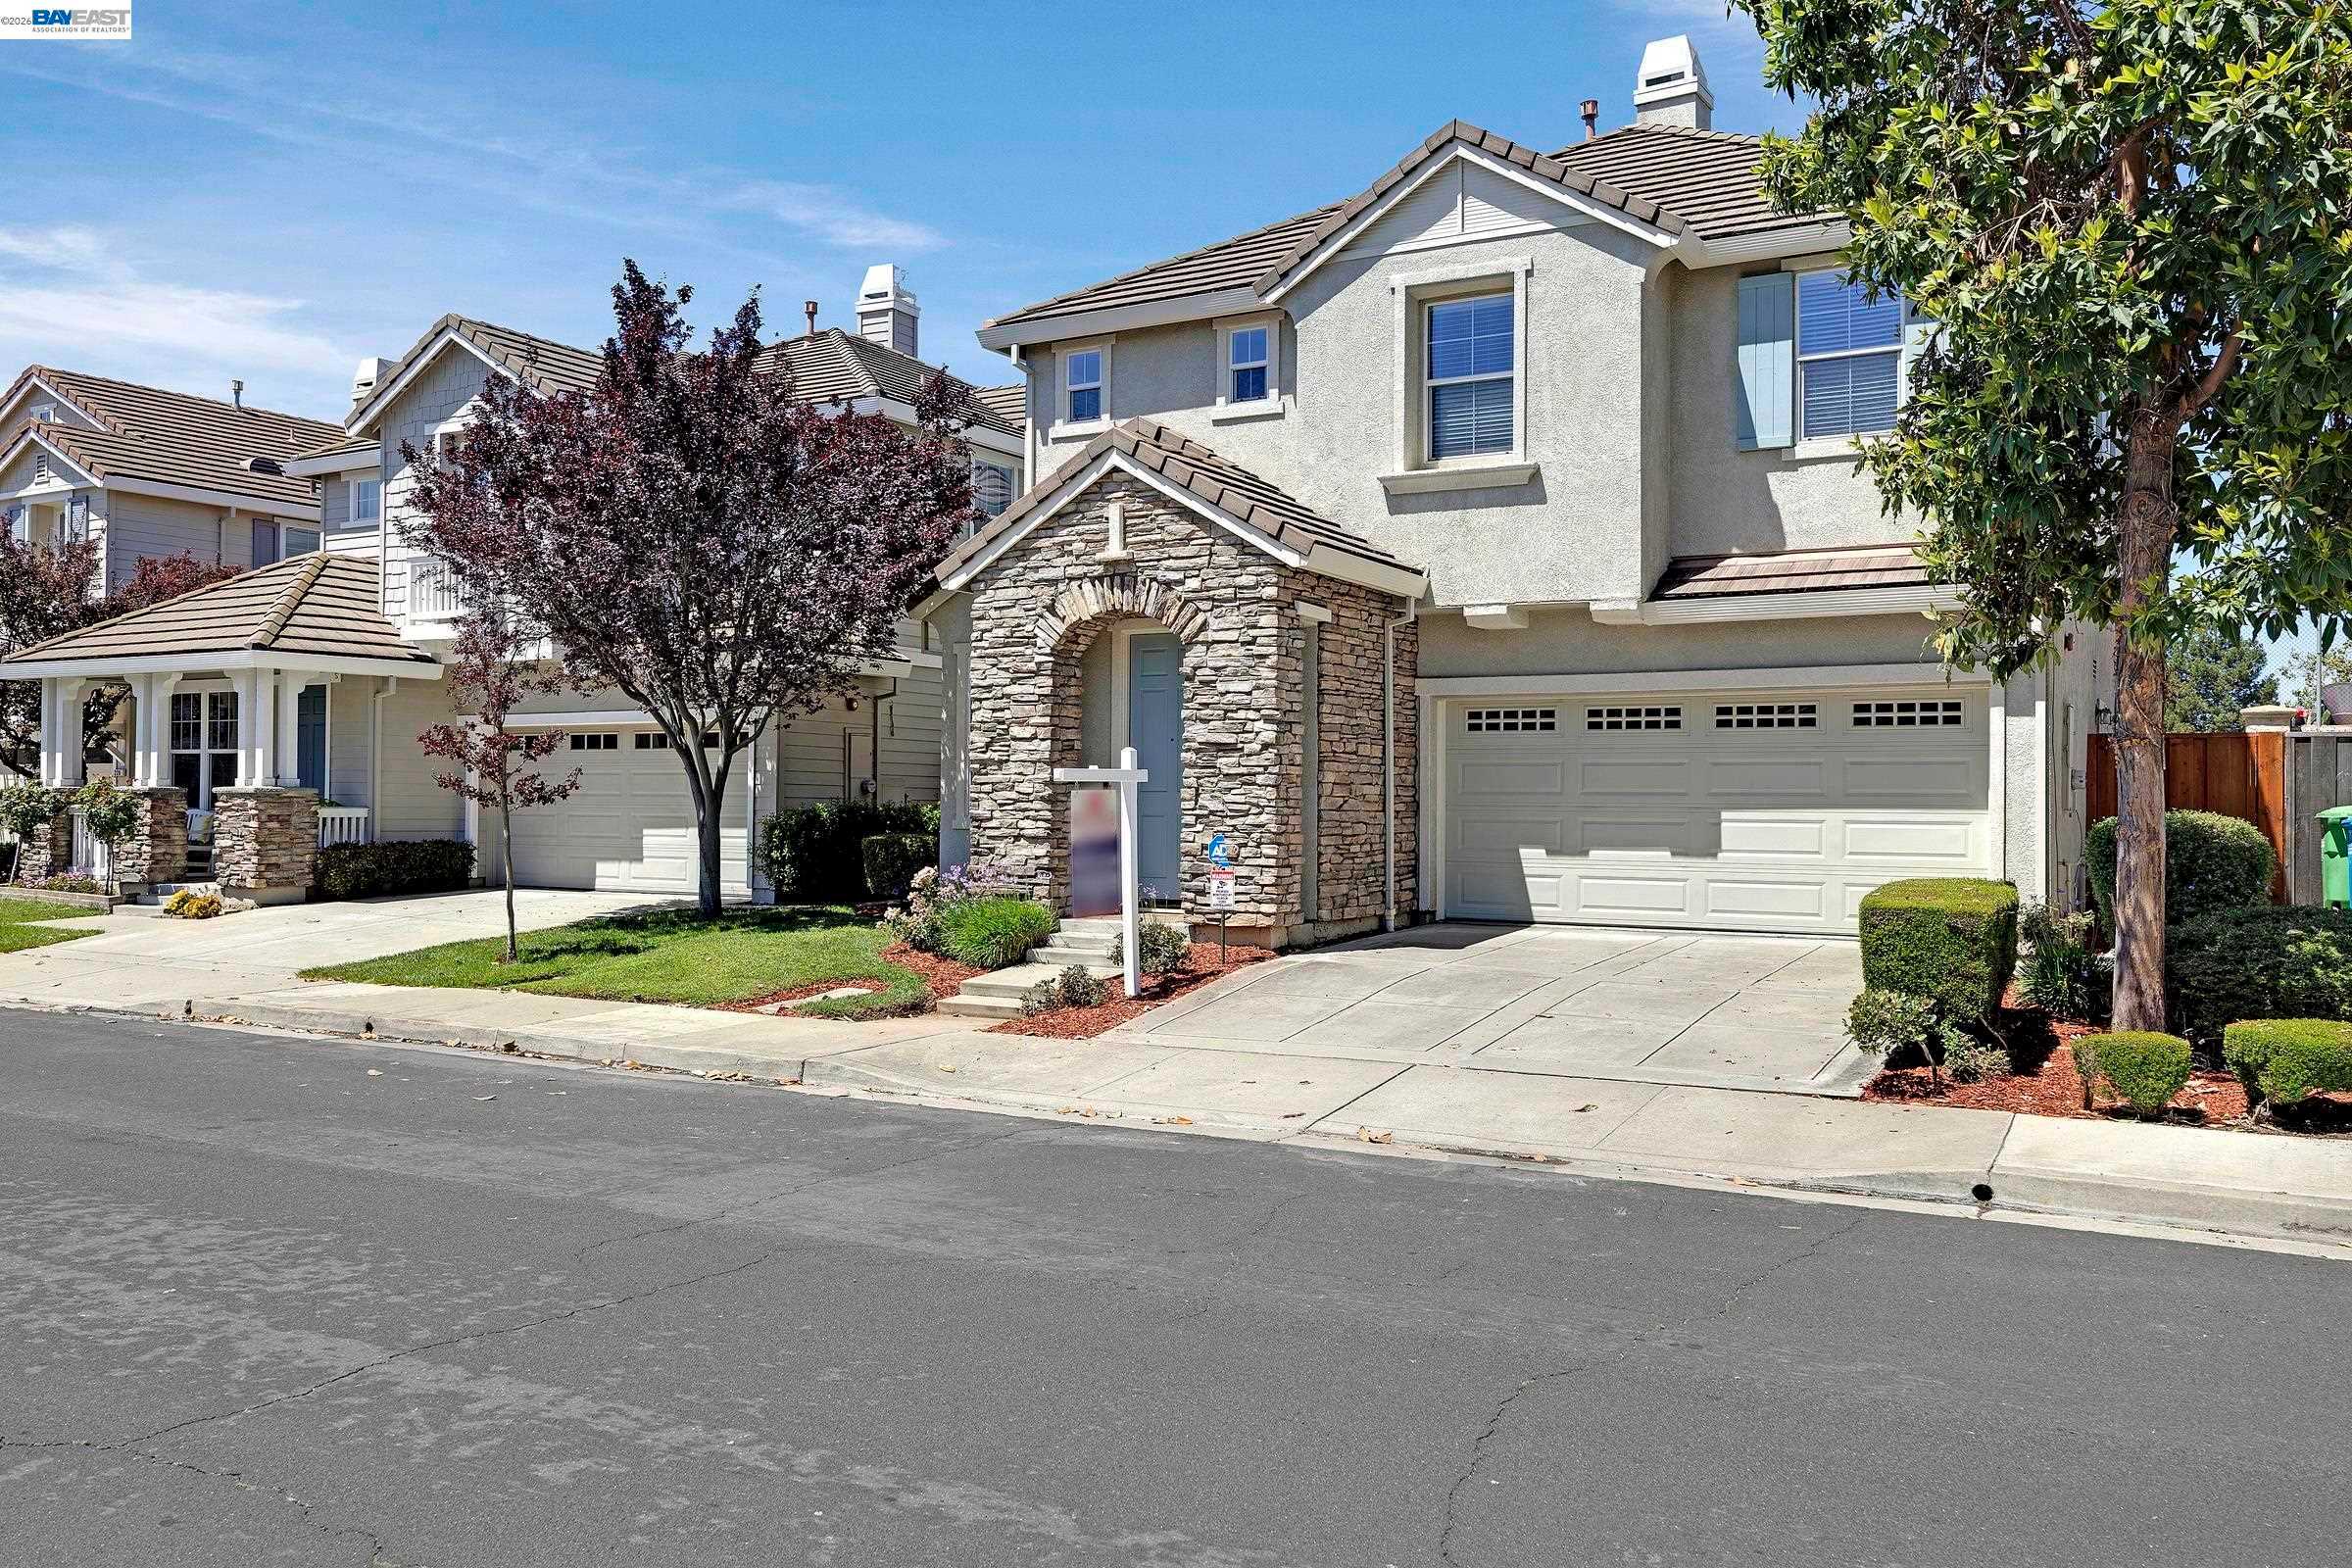
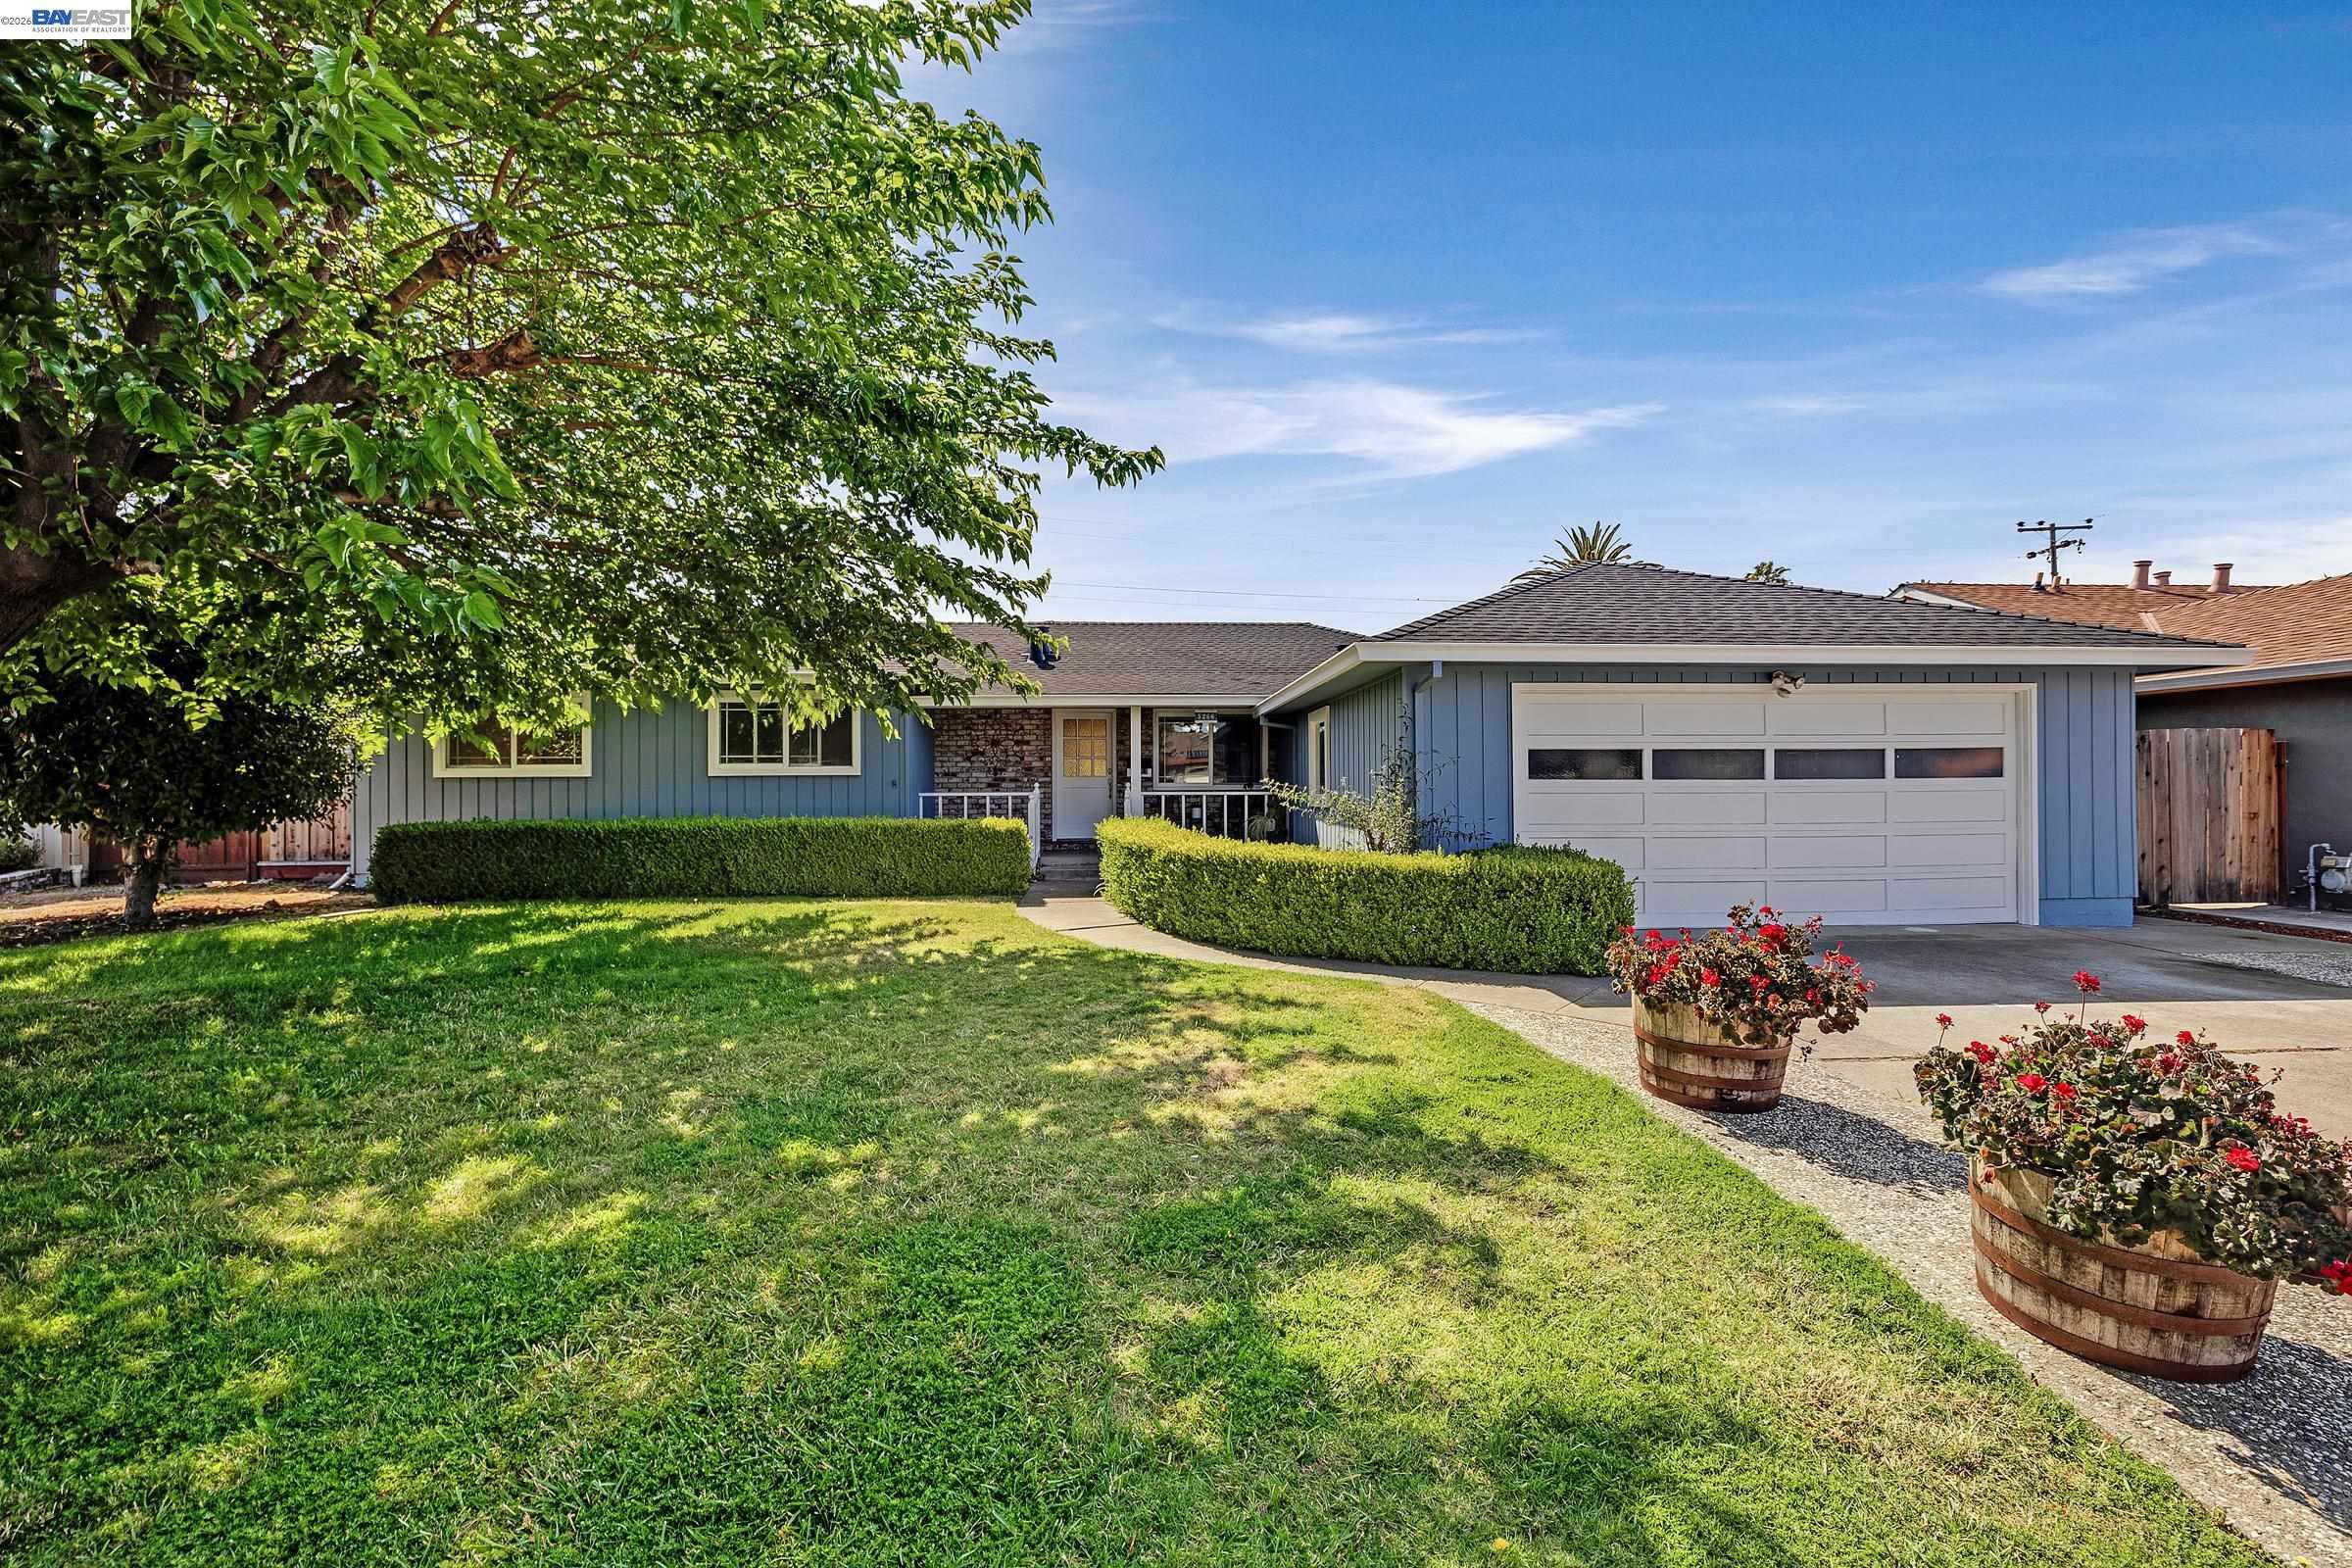
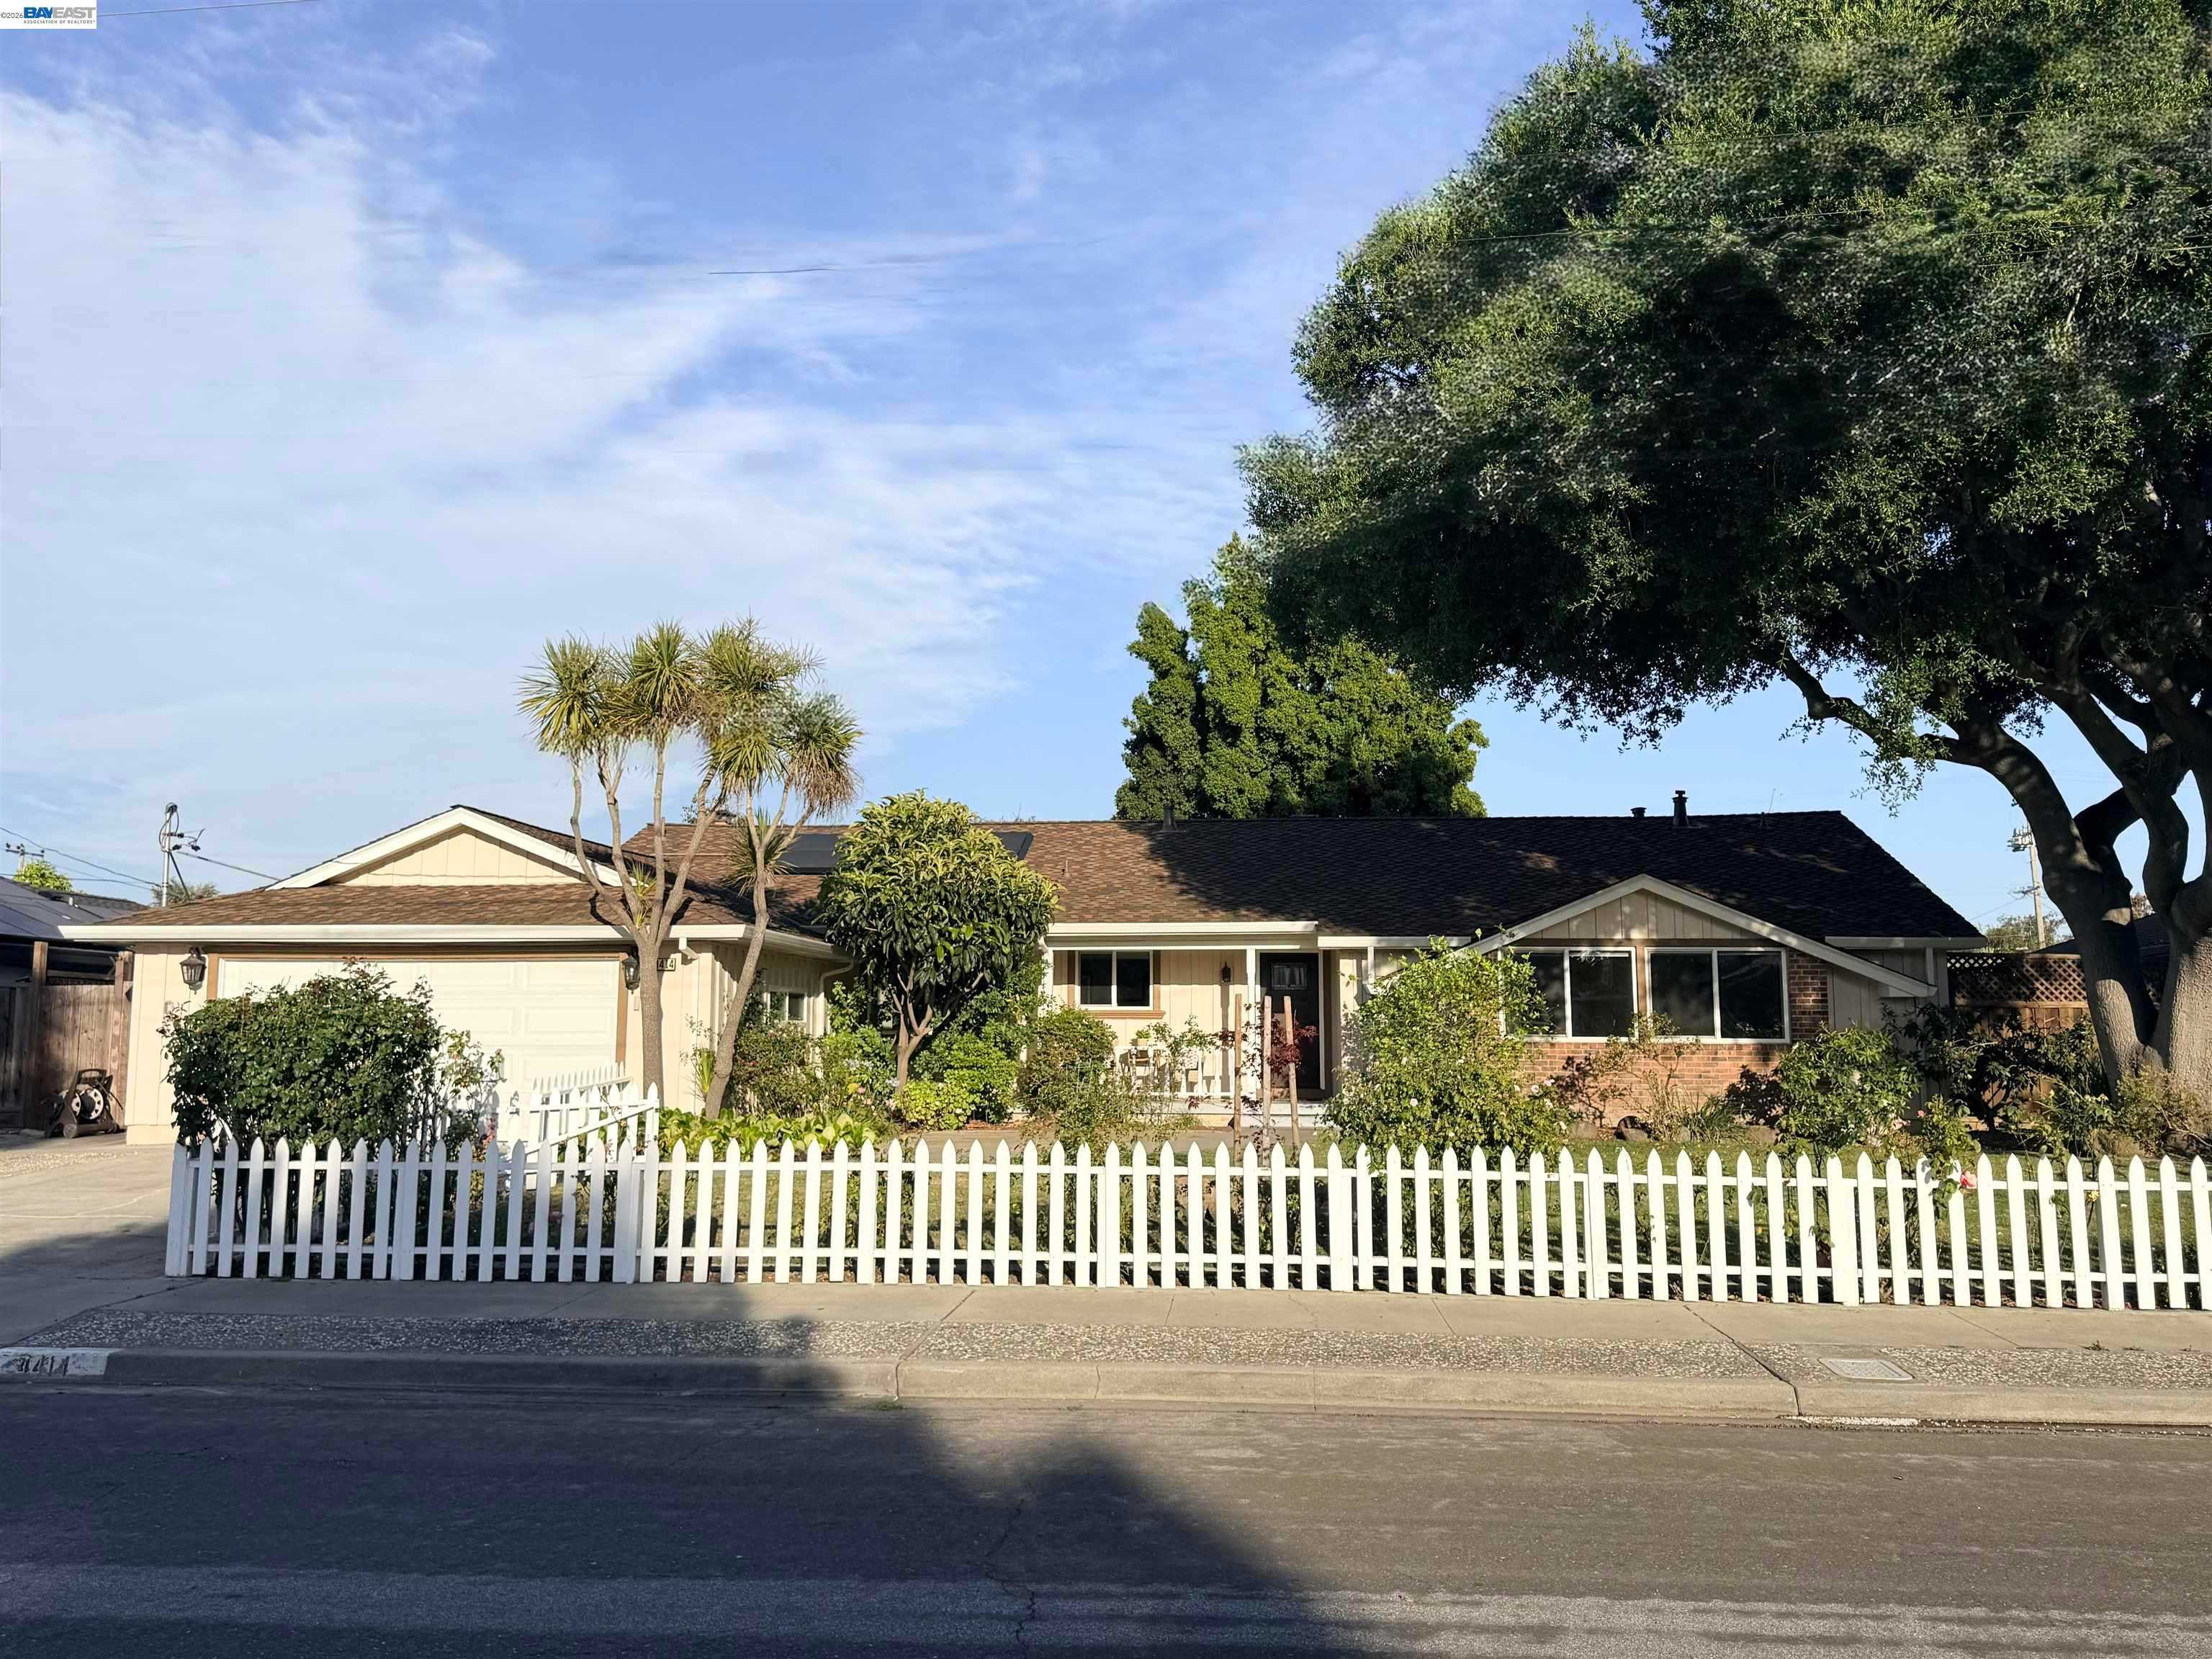
Behind these county totals: hundreds of homes still for sale in Fremont, Hayward, Union City, Newark and Milpitas, counted, priced and sorted every morning from the same MLS export, with a map search for the homes themselves.
30-Year Fixed: 7.37% +0.04 | 15-Year Fixed: 7.04% +0.06
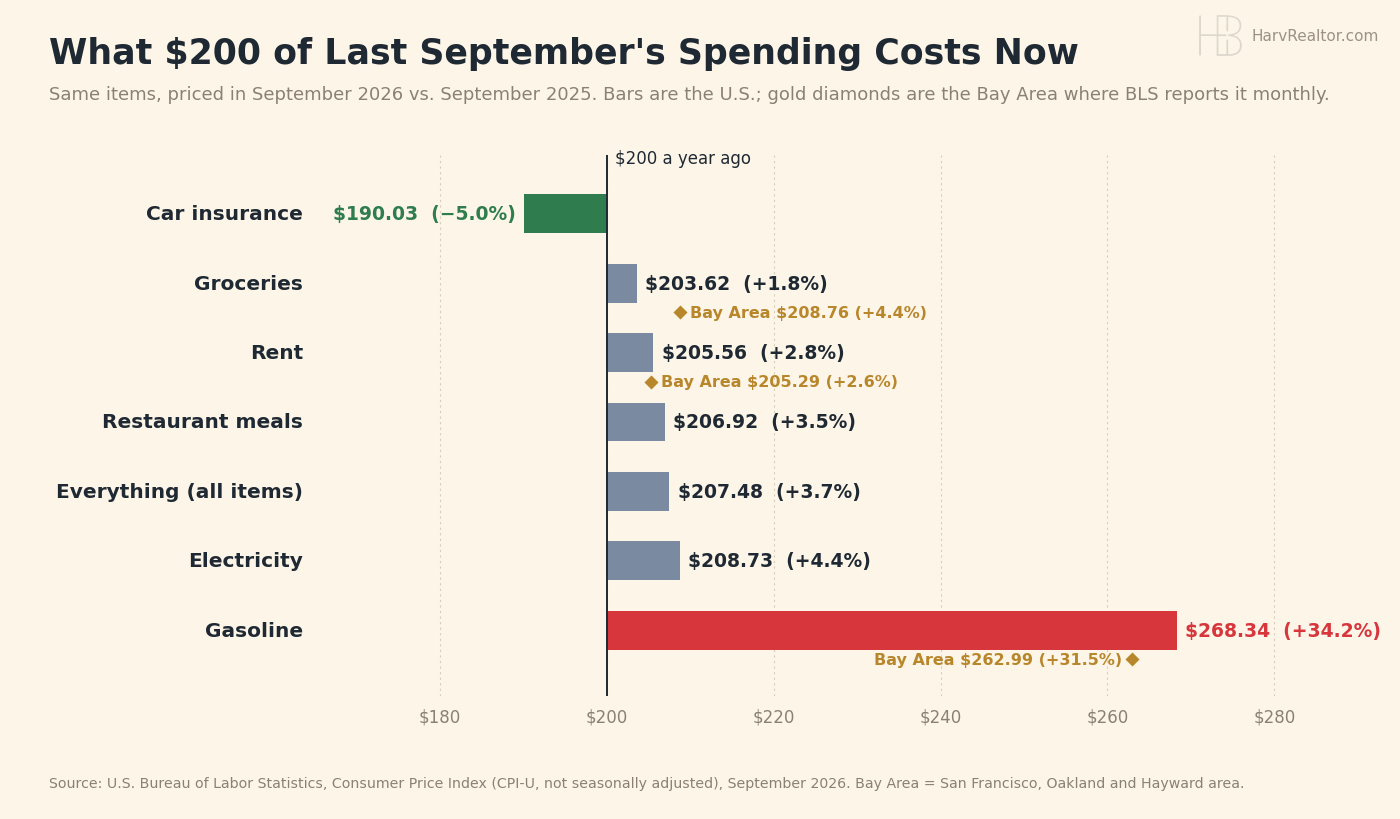
Gas is the outlier. September prices rose 3.7% from a year ago nationally, but one item did much of the damage: gasoline cost 34% more than a year ago, and 31.5% more here in the Bay Area. Leave out food and energy and prices rose 2.6%.
Housing is the good news here. Bay Area rents rose 2.6% from a year ago, a touch below the nation's 2.8%, and shelter costs overall rose 2.6% here versus 3.2% nationally. Groceries run hotter locally, up 4.4% versus 1.8% nationally, while car insurance costs 5% less than a year ago.
Rates held steady. Mortgage News Daily's 30-year ended the week at 7.37% and the 15-year at 7.04%. On our five city median list price of $1,088,000 with 20% down, principal and interest run about $6,009 a month.
What it means for you. A paycheck rising about 3% a year is keeping up with everything but the gas tank, and Bay Area rents are rising slower than that. If you are buying, you have room to negotiate, with 169 homes across the five cities listed 60 days or longer.
Today's count. Board wide: 2,666 listings across the 15 city table, counting active and in contract together, with 136 coming soon and 210 brand new. The five city ledger carries 679 live listings across Fremont, Hayward, Milpitas, Newark and Union City, 609 on the market and 70 coming soon, down from 687.
Fremont holds 233 live listings: 186 active, 27 coming soon, 17 brand new and 3 back on market, with a median on market list price of $1,298,500 at $804 a square foot and a typical listing out 37 days. Hayward carries 188, Milpitas 100, Newark 94 and Union City 64. Across all five cities the median is $1,088,000 at $681 a square foot, 283 homes are priced under a million, and 169 have been sitting 60 days or longer.
S&P 500: 7,659.44 -1.09% | Dow: 52,002.41 -0.34% | Nasdaq: 26,140.03 -2.14%
A mixed week. Markets are closed for the weekend; these are Friday's closes. The Dow finished the week up 0.67%, while the S&P 500 lost 1.95% and the Nasdaq 4.48% as investors sold chip and AI shares, led Friday by AMD, Micron and CoreWeave.
Shoppers look healthier than tech. September sales at online retailers rose 8.2% from a year ago and at restaurants 7.0%, a good sign heading into the holiday quarter. Netflix kicks off a busy earnings week on Tuesday.
10-Year Treasury: 5.09% -0.01 | Gold: $4,181.10 +0.26% | Silver: $57.31 +0.26% | Brent Crude: $109.86 +3.72%
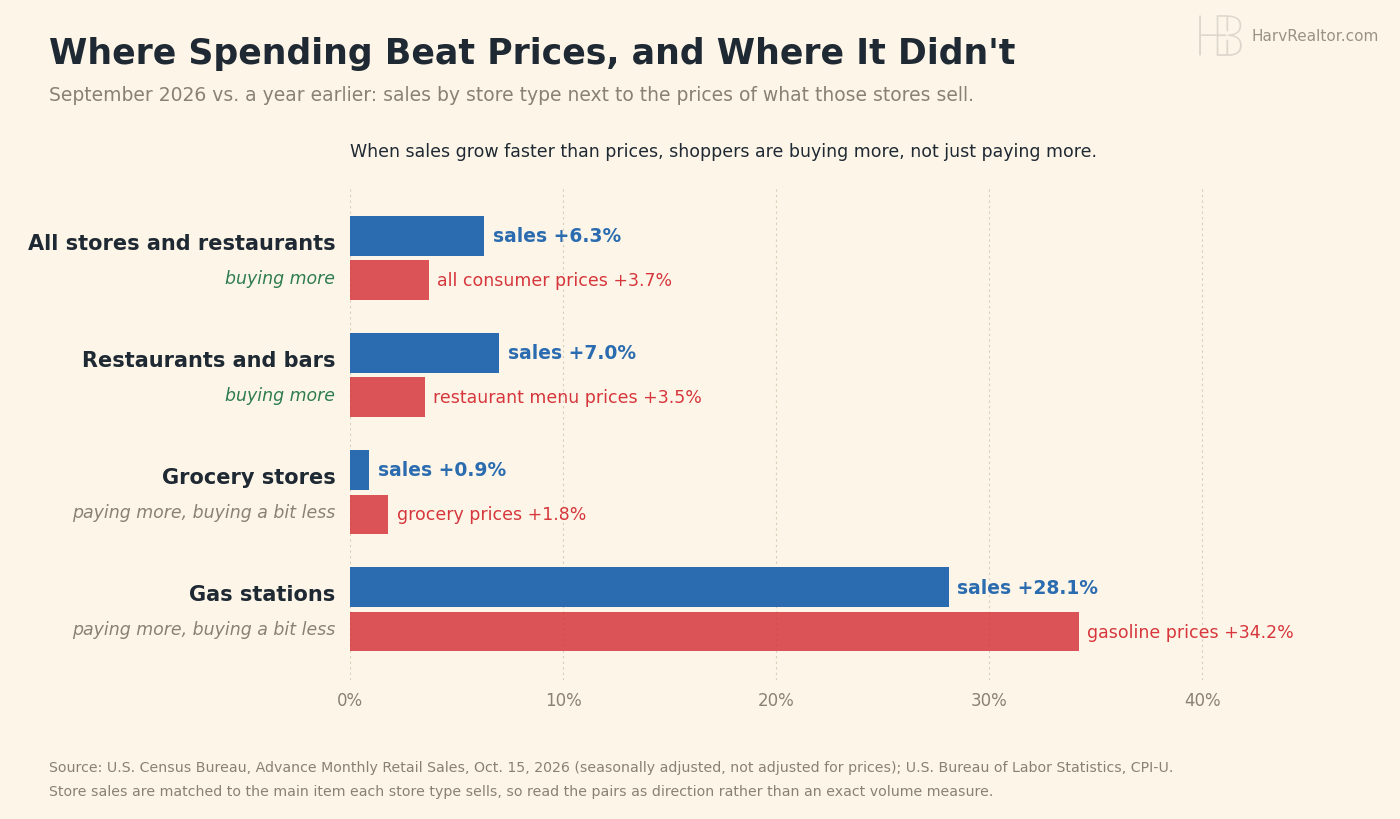
Shoppers kept spending. Retail and restaurant sales rose 0.8% in September and 6.3% from a year earlier, the Census Bureau said Thursday. Restaurants took in 7.0% more while menu prices rose 3.5%, so people are eating out more, not just paying more.
Gas did a lot of the lifting. Gas station sales rose 28.1% from a year ago while pump prices rose 34.2%, so drivers paid more for slightly less fuel. Leave gas stations out and sales still rose 4.5%.
Not as scary as the graphics. Some charts online this week show a grocery cart up 10%; September grocery prices are up 1.8% nationally and 4.4% in the Bay Area, and car insurance is down 5%. Average hourly pay rose 3.0%, behind overall prices because of gasoline, but ahead of the 2.6% rise outside food and energy.
Oil rose again. Brent settled Friday at $109.86, up 3.72%, as tanker attacks around the Strait of Hormuz picked up. Gasoline is the line item to watch, and also the one that can ease fastest when oil cools.
Bitcoin: $81,449 +0.35% | Ethereum: $2,414.88 +0.23% | XRP: $1.30 -0.30%
A quiet Saturday. Bitcoin is up 0.35% over 24 hours near $81,400, Ether is up 0.23% and XRP is down 0.30%, live from CoinGecko at 11:21 AM PT. It trades through the weekend, so these are the only live prices on the page.
Sources
- U.S. Census Bureau (Advance Monthly Retail Sales, September 2026, released October 15)
- U.S. Bureau of Labor Statistics (Consumer Price Index, September 2026)
- BLS CPI database (San Francisco, Oakland and Hayward area series, September 2026)
- U.S. Bureau of Labor Statistics (Real Earnings, September 2026)
- Mortgage News Daily (30 year and 15 year index, October 16)
- U.S. Treasury (10-Year daily yield curve, October 16)
- CoinGecko (live crypto, 11:21 AM PT October 17)
- REALTY EXPERTS® Live Inventory (five city ledger, October 17)
Disclaimer: The market data, rates, and information provided are for informational purposes only and should not be considered financial advice. Always verify rates and data with your lender or financial advisor before making any decisions.
Based on information from the Bay East Association of REALTORS® (Bay East MLS) as of October 17, 2026. All data, including all measurements and calculations of area, is obtained from various sources and has not been, and will not be, verified by broker or MLS. All information should be independently reviewed and verified for accuracy. Properties may or may not be listed by the office/agent presenting the information.