


"At a Glance" Local Housing STATS and News 11/09/26
November 9, 2026 · Alameda County Market Dashboard
TODAY'S LIVE INVENTORY
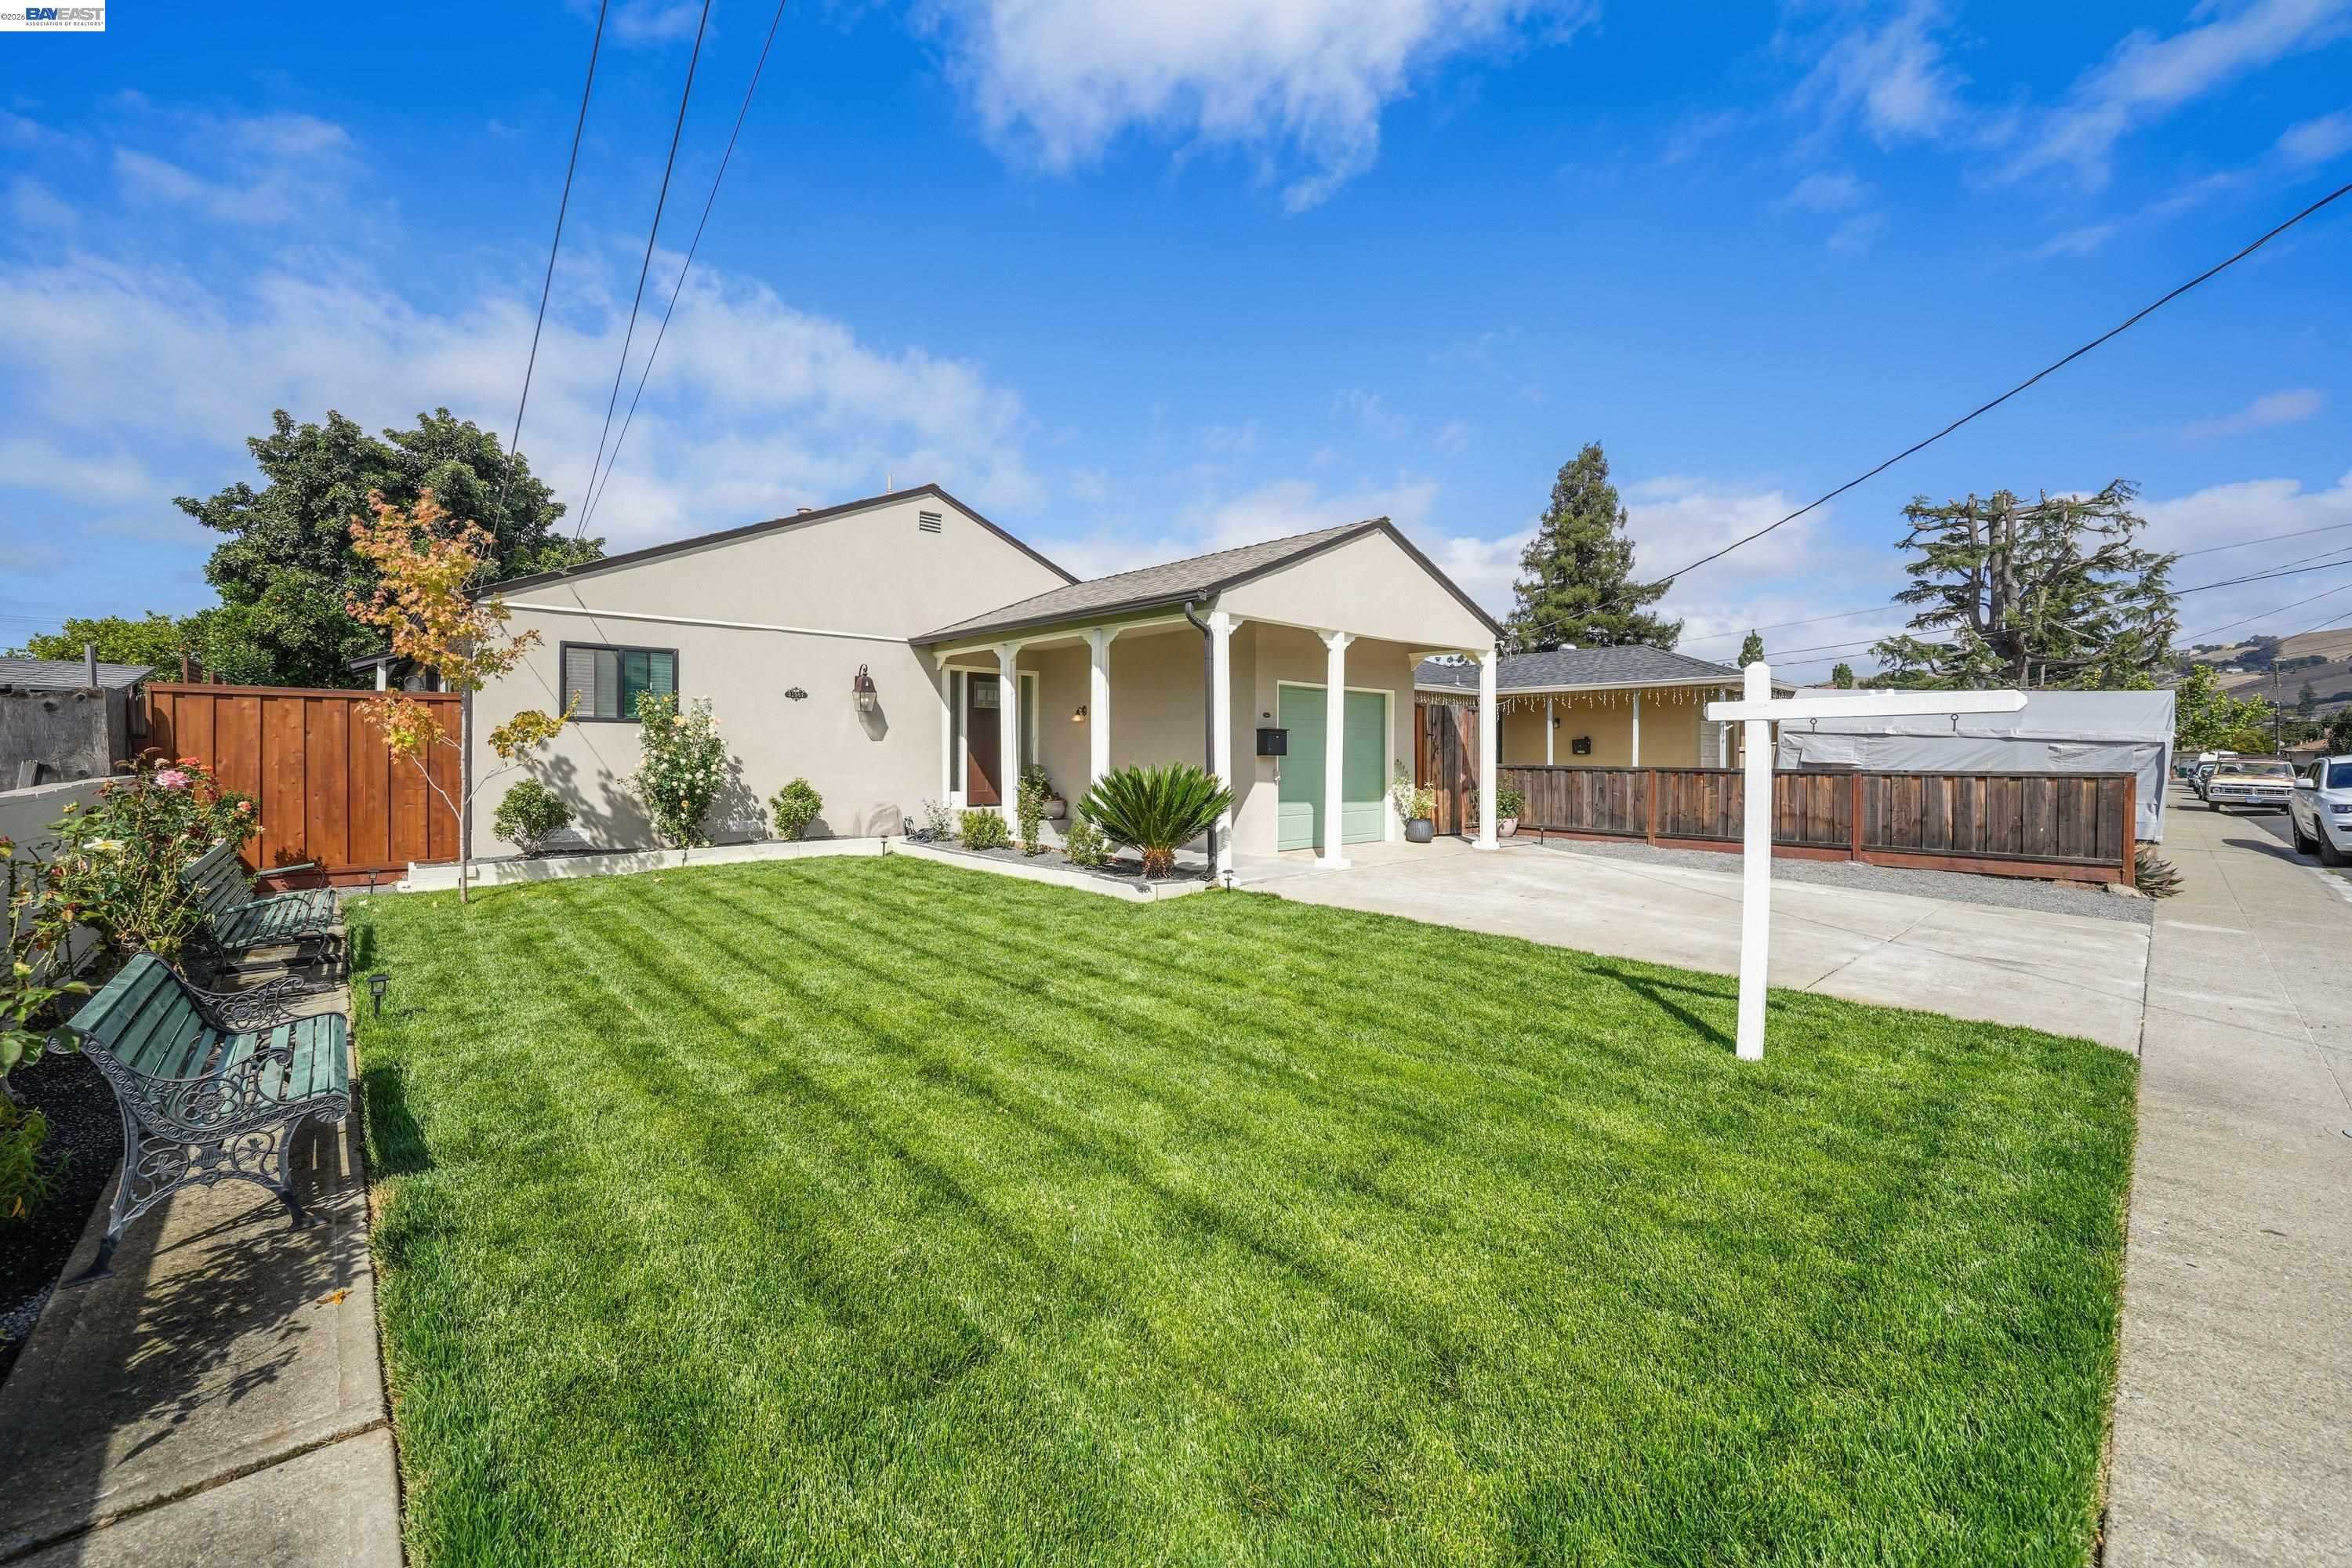
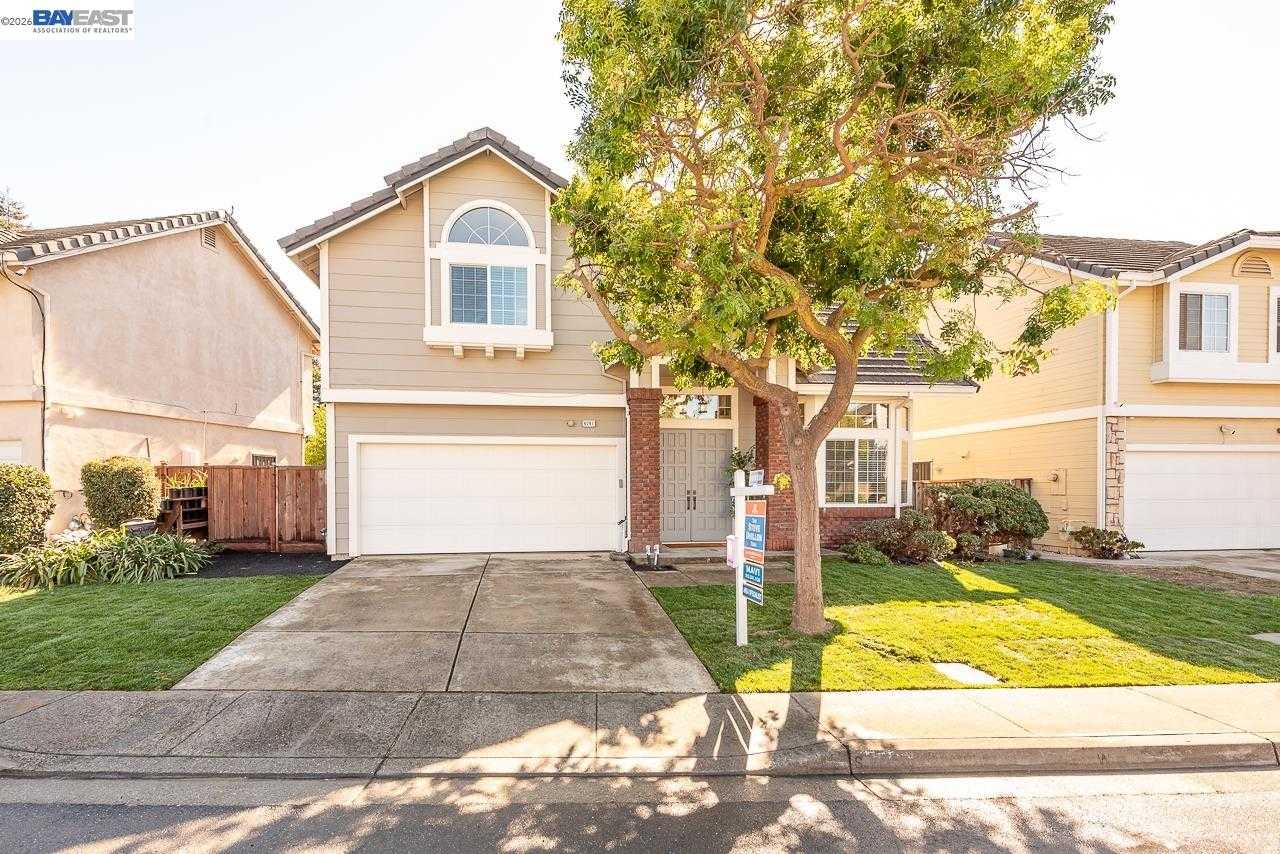
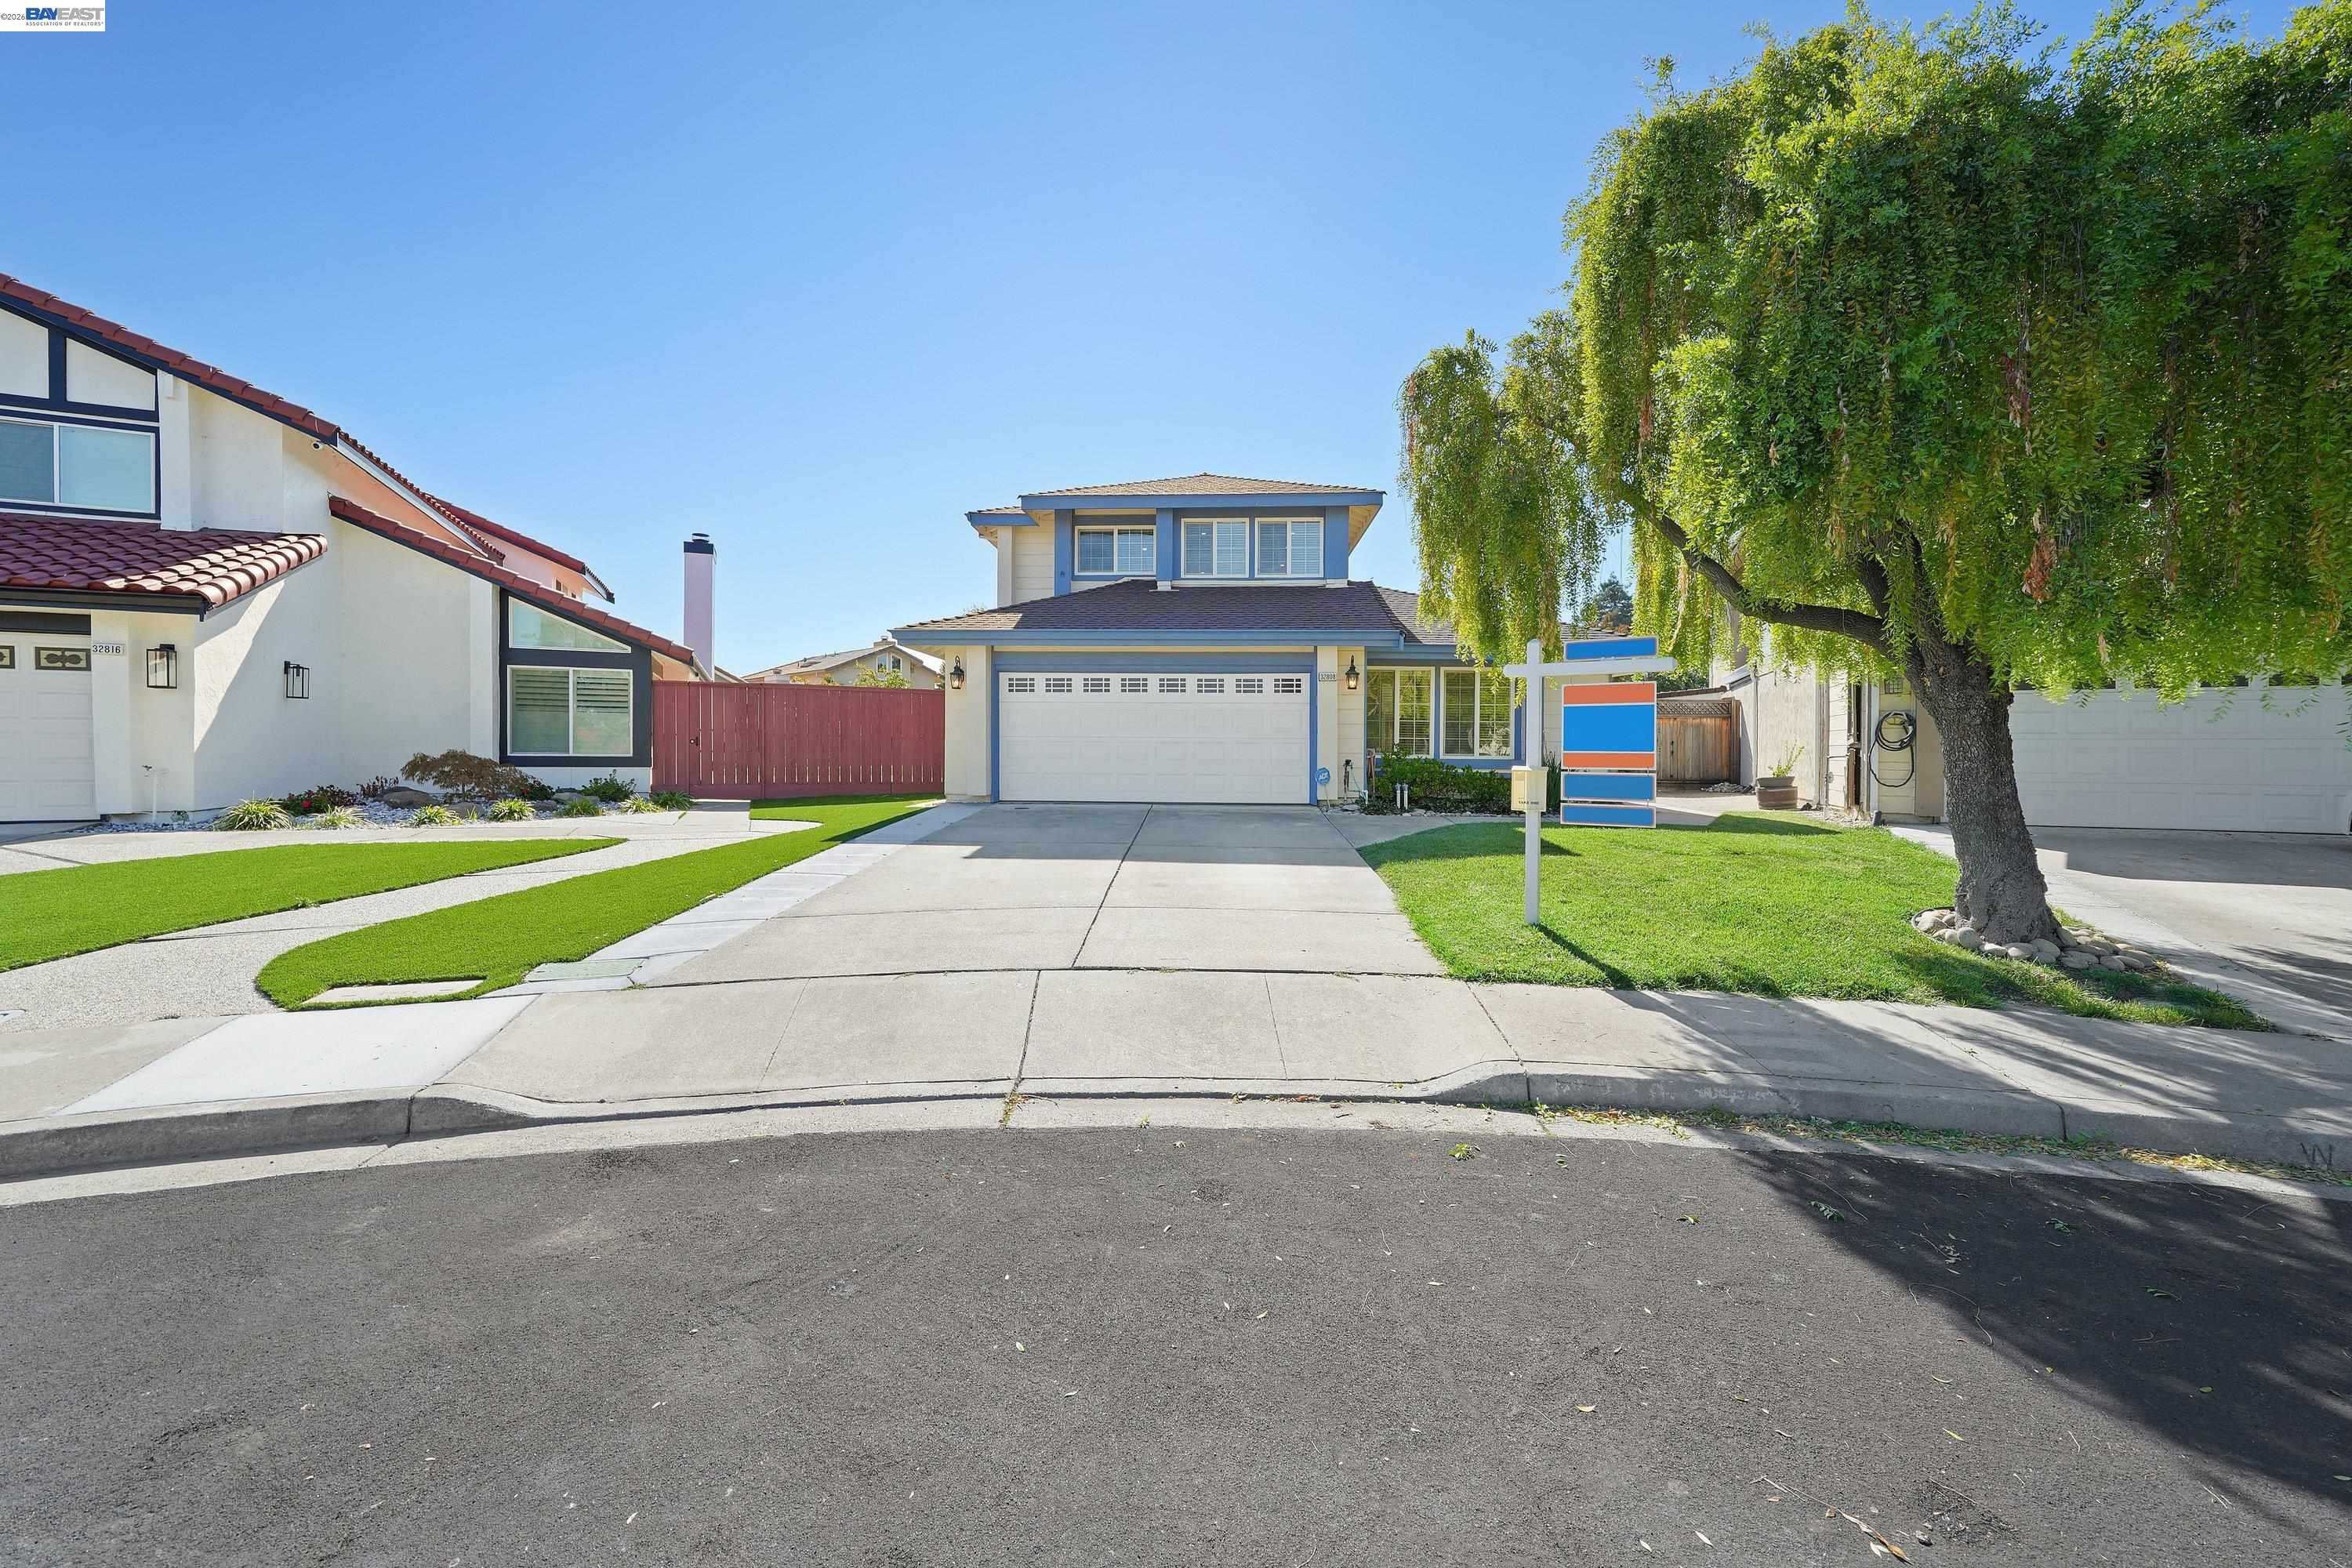
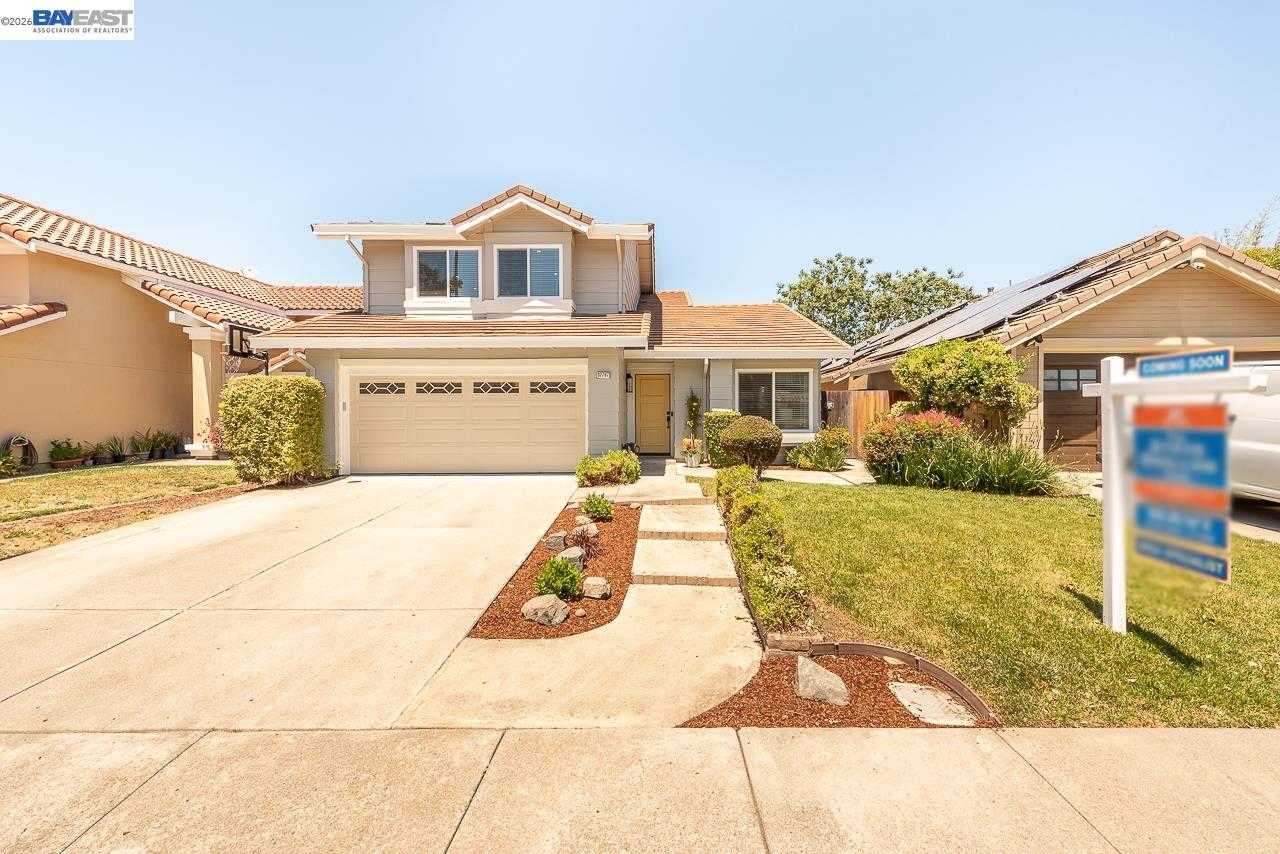
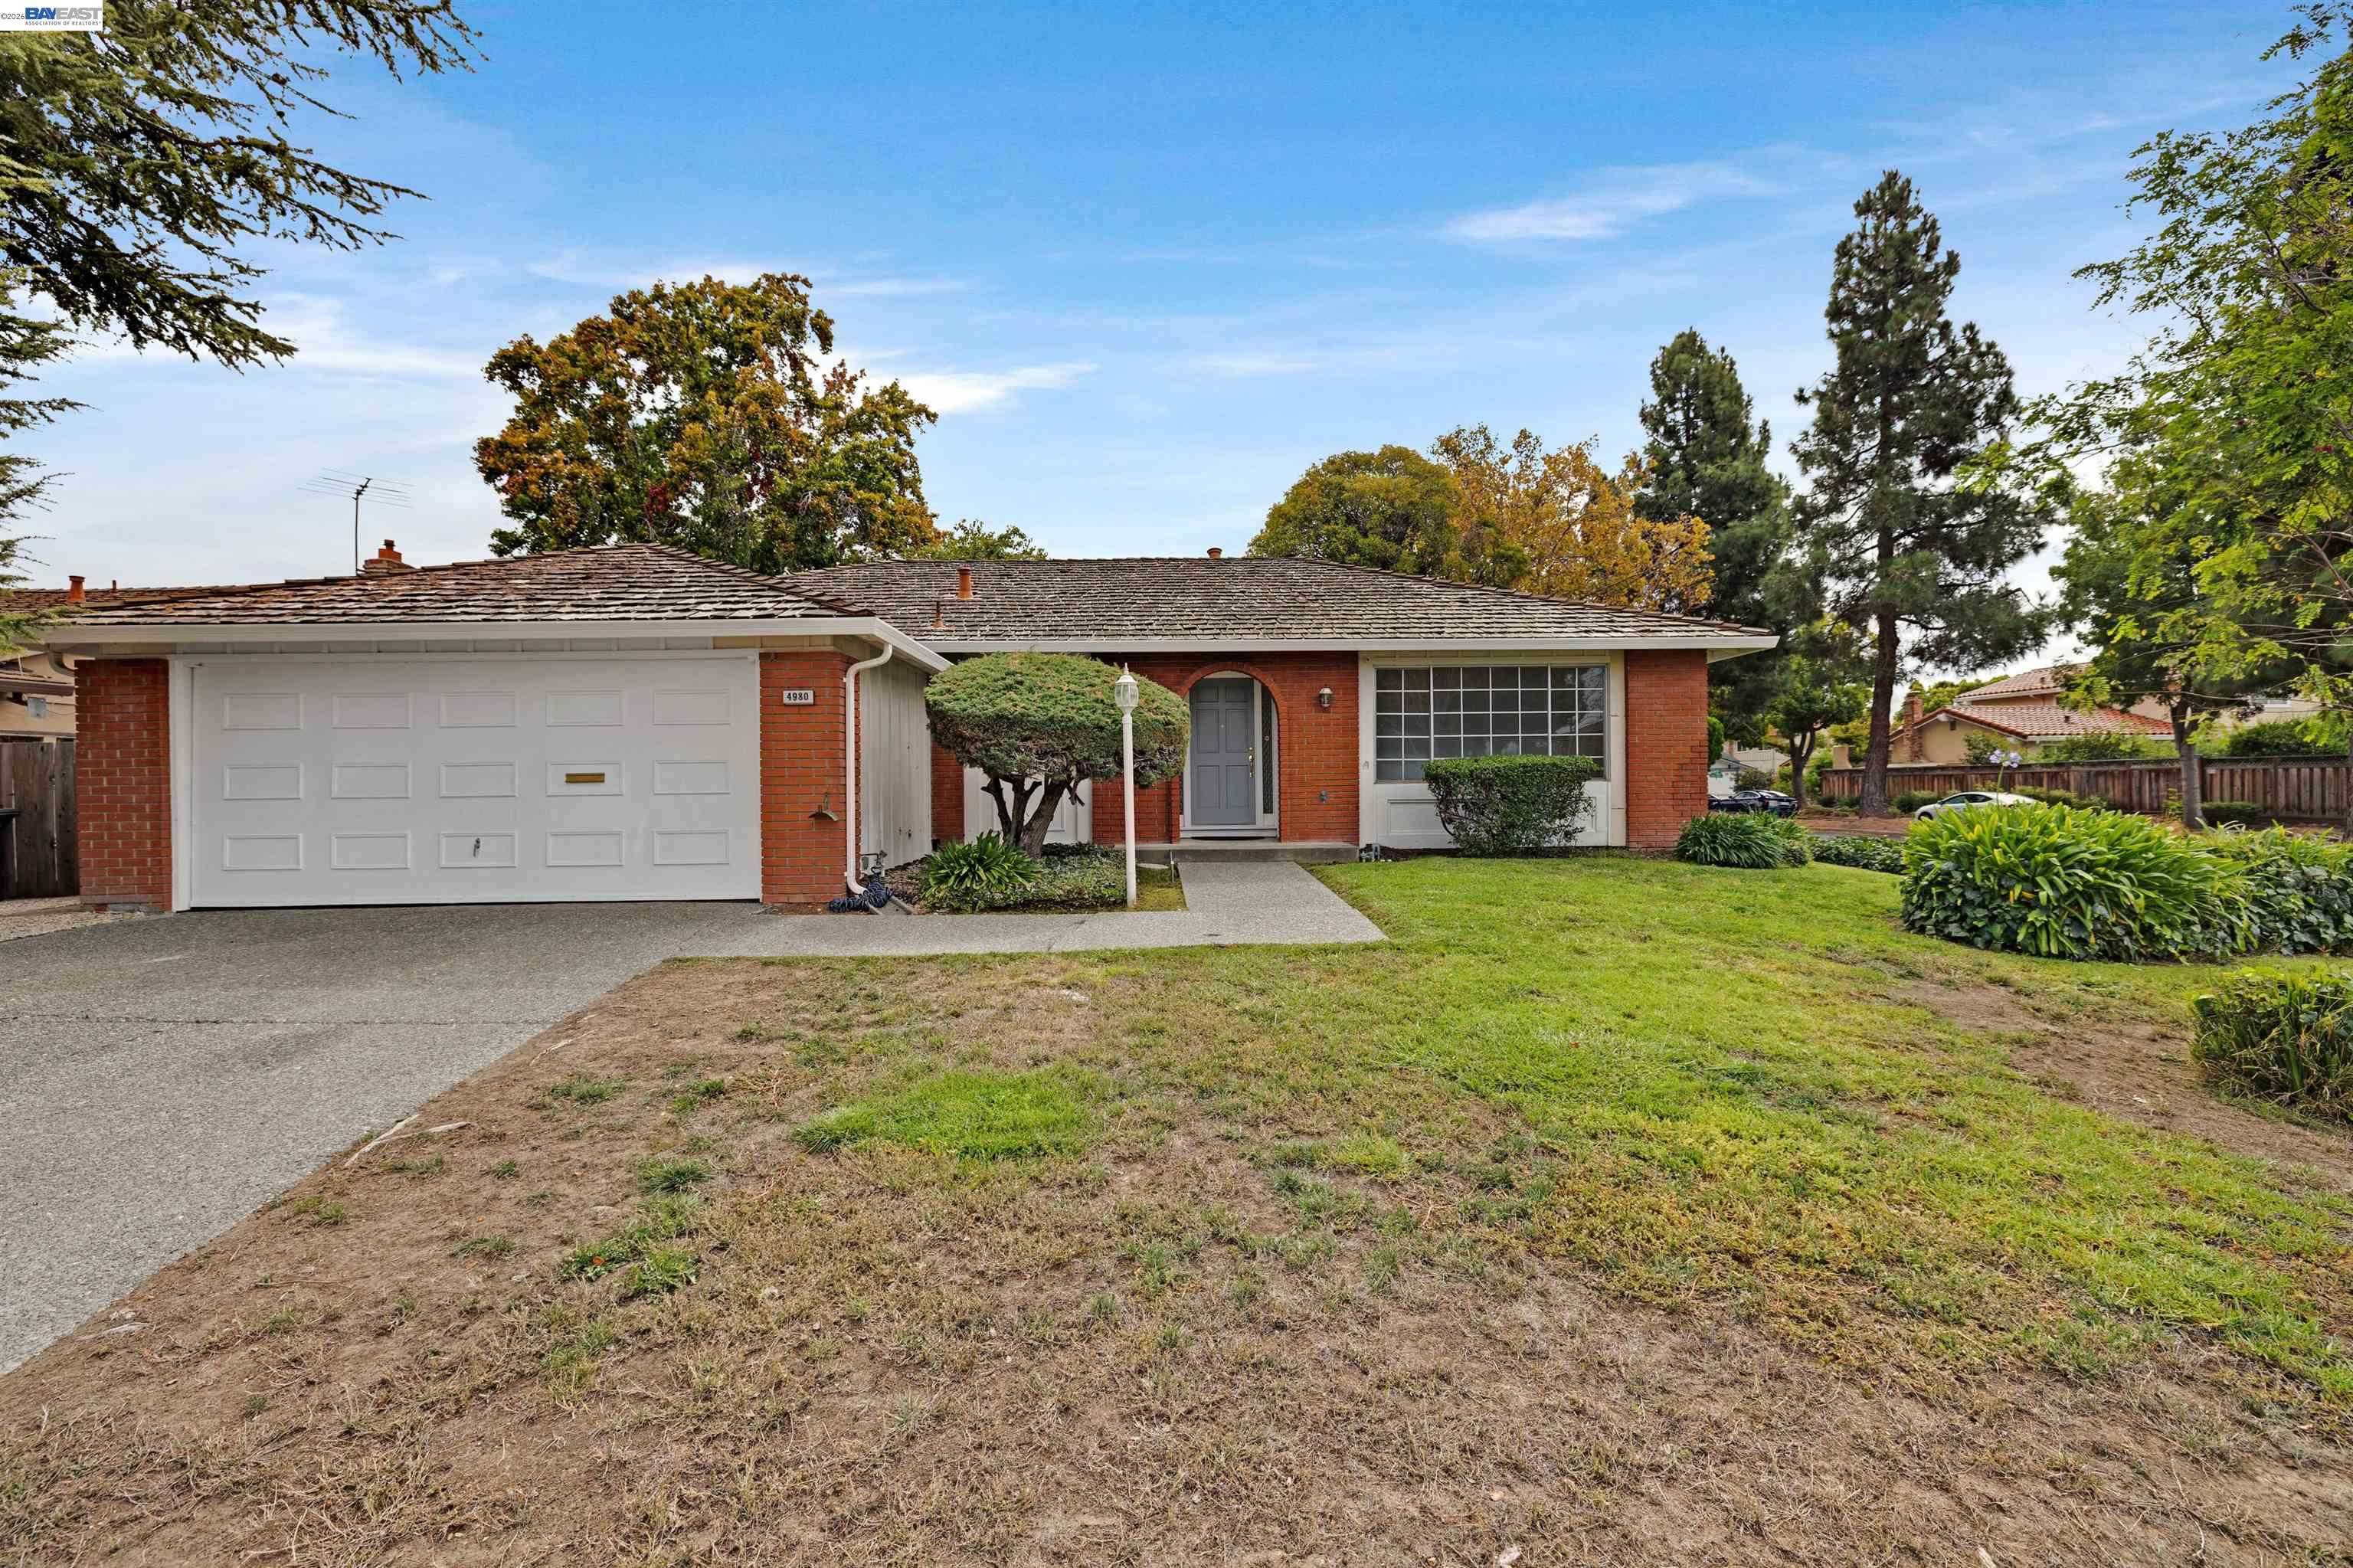
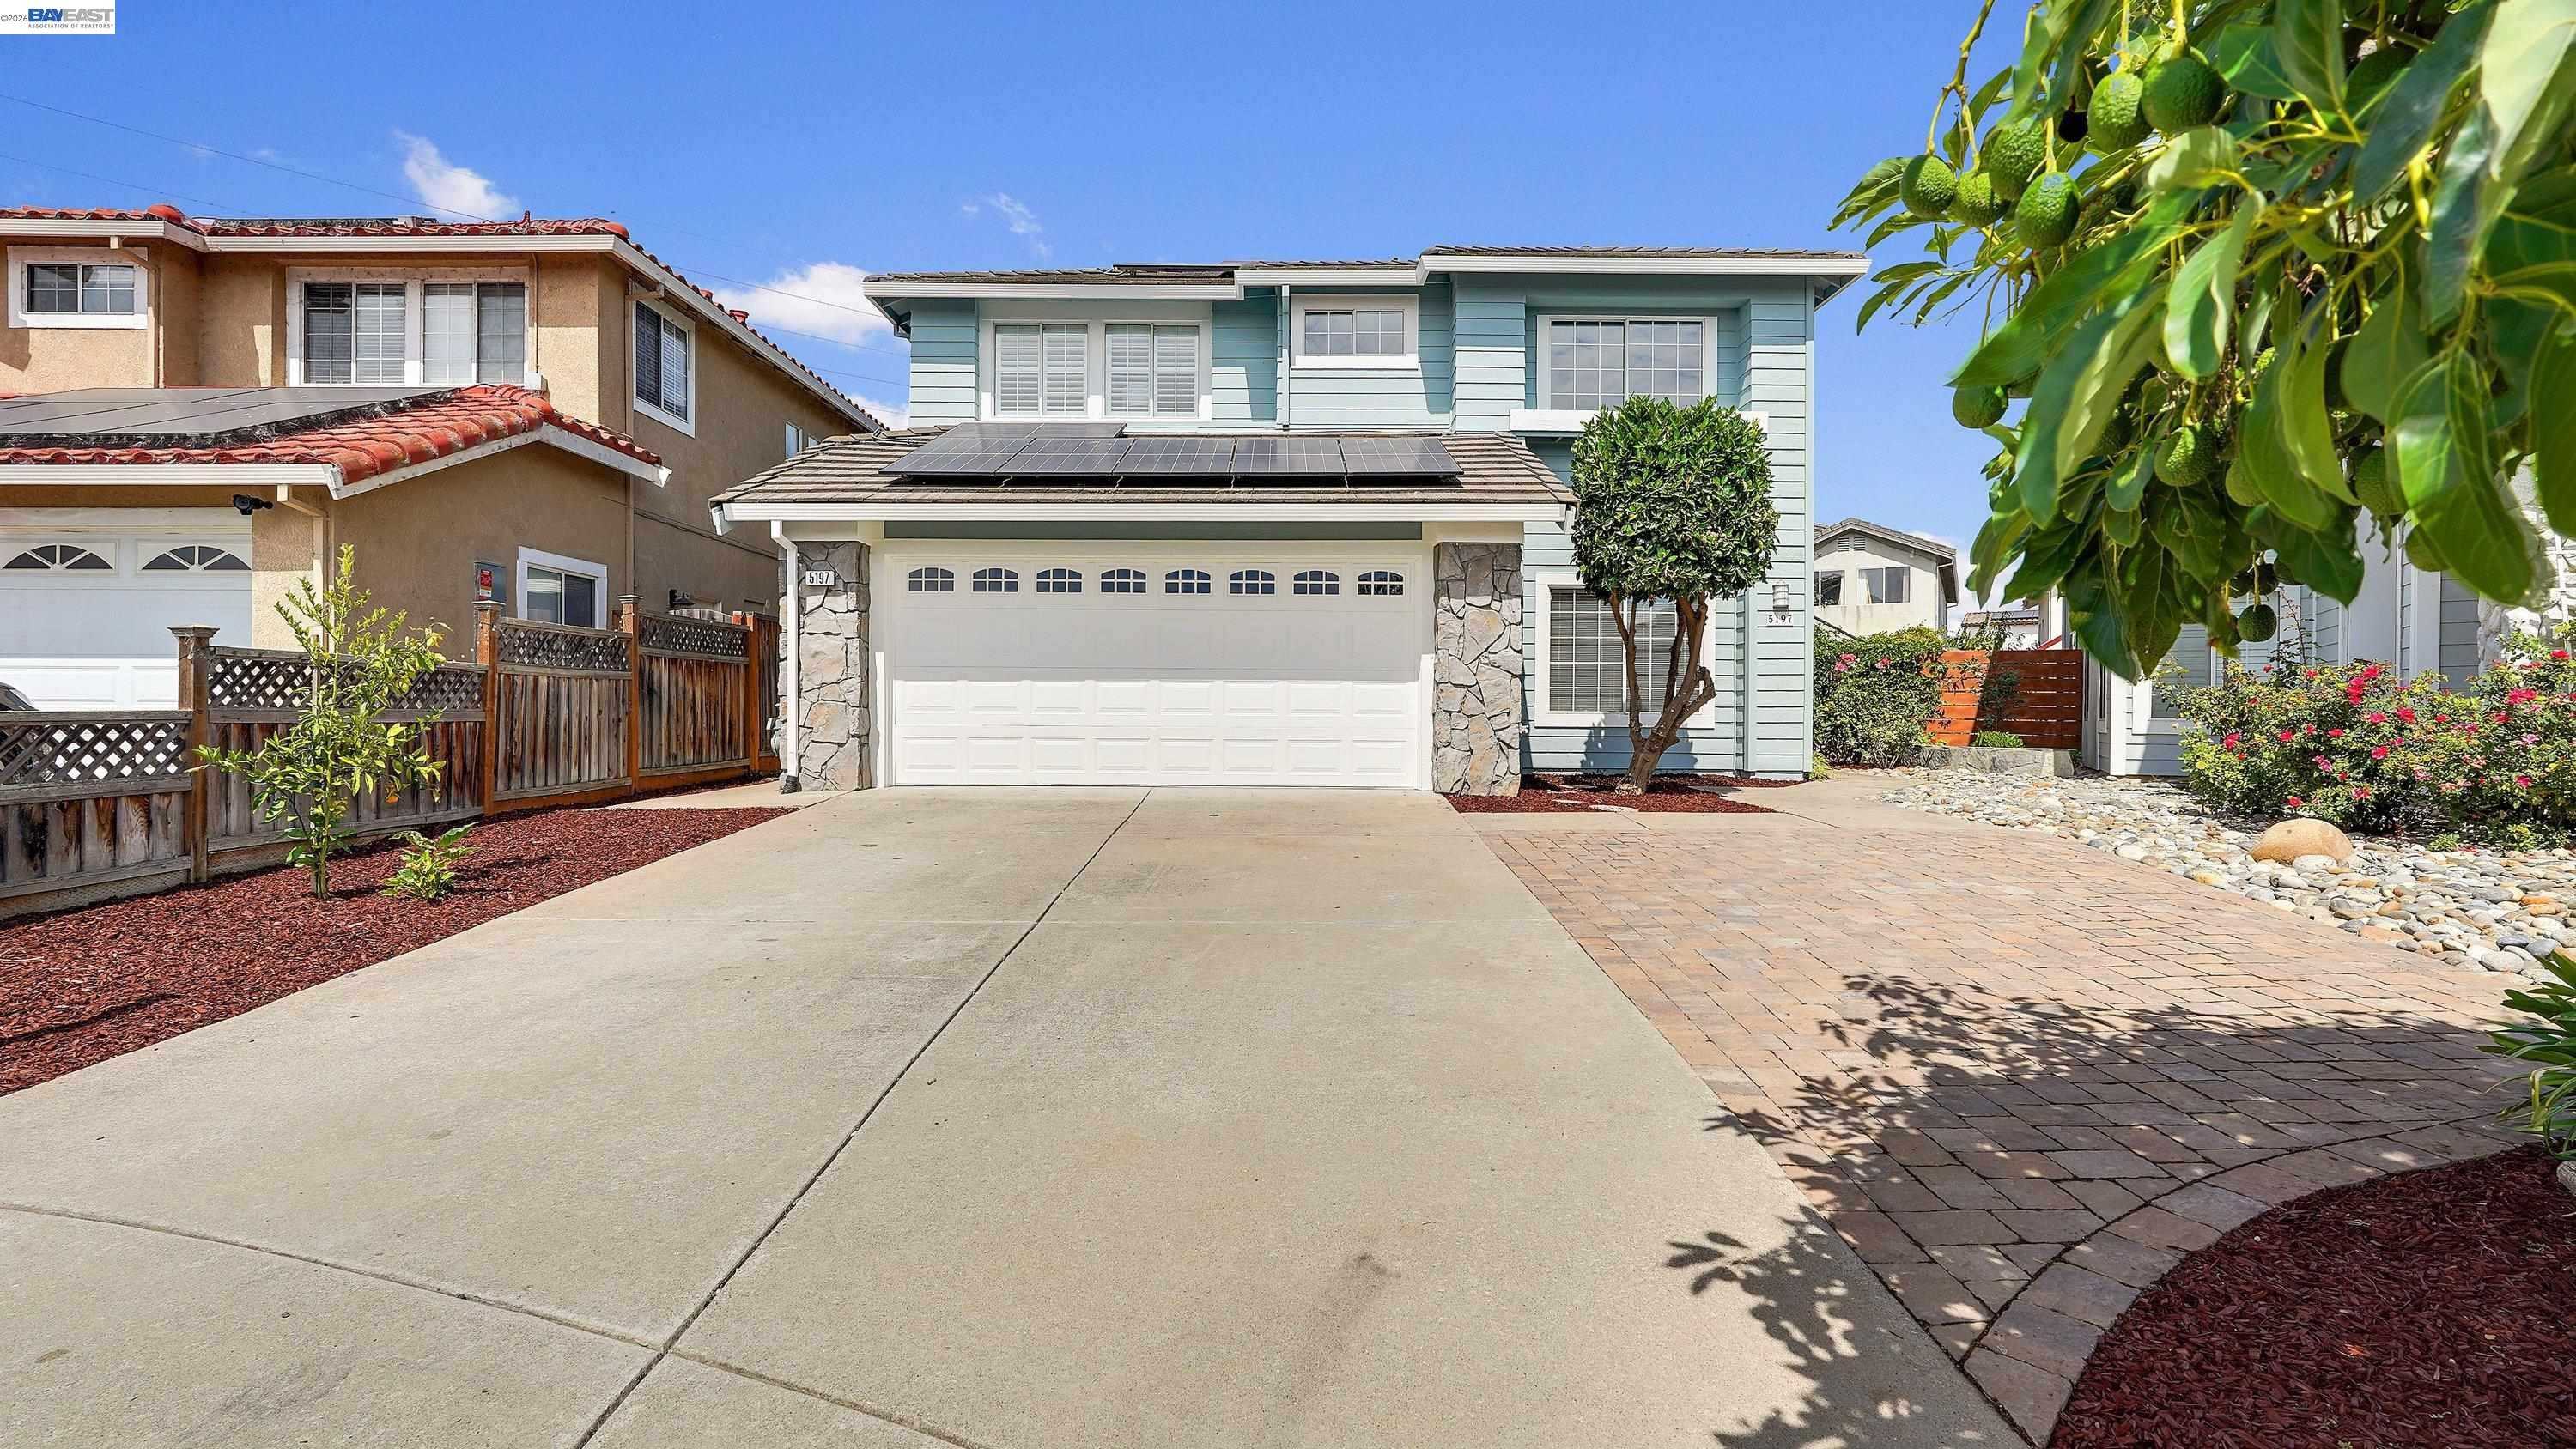
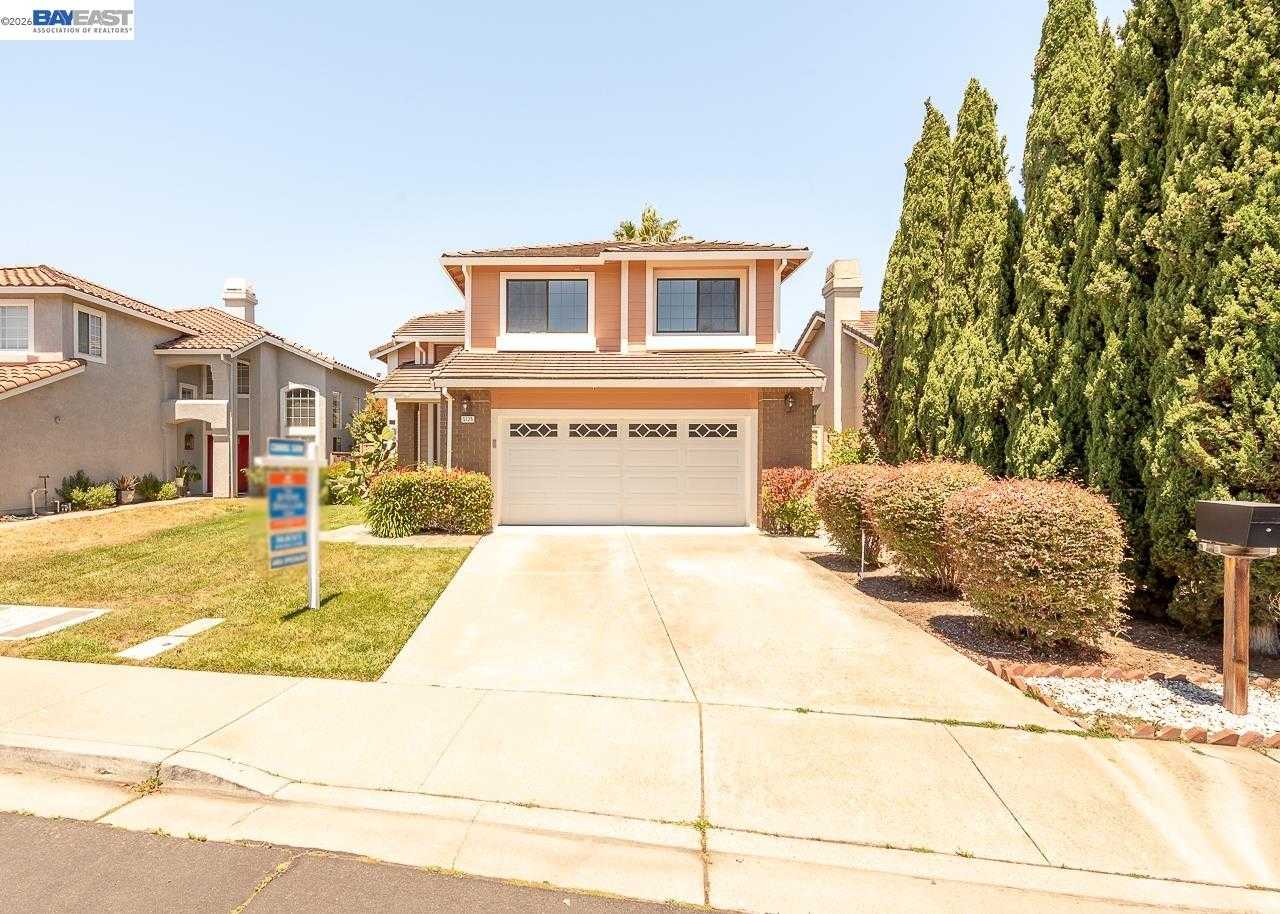
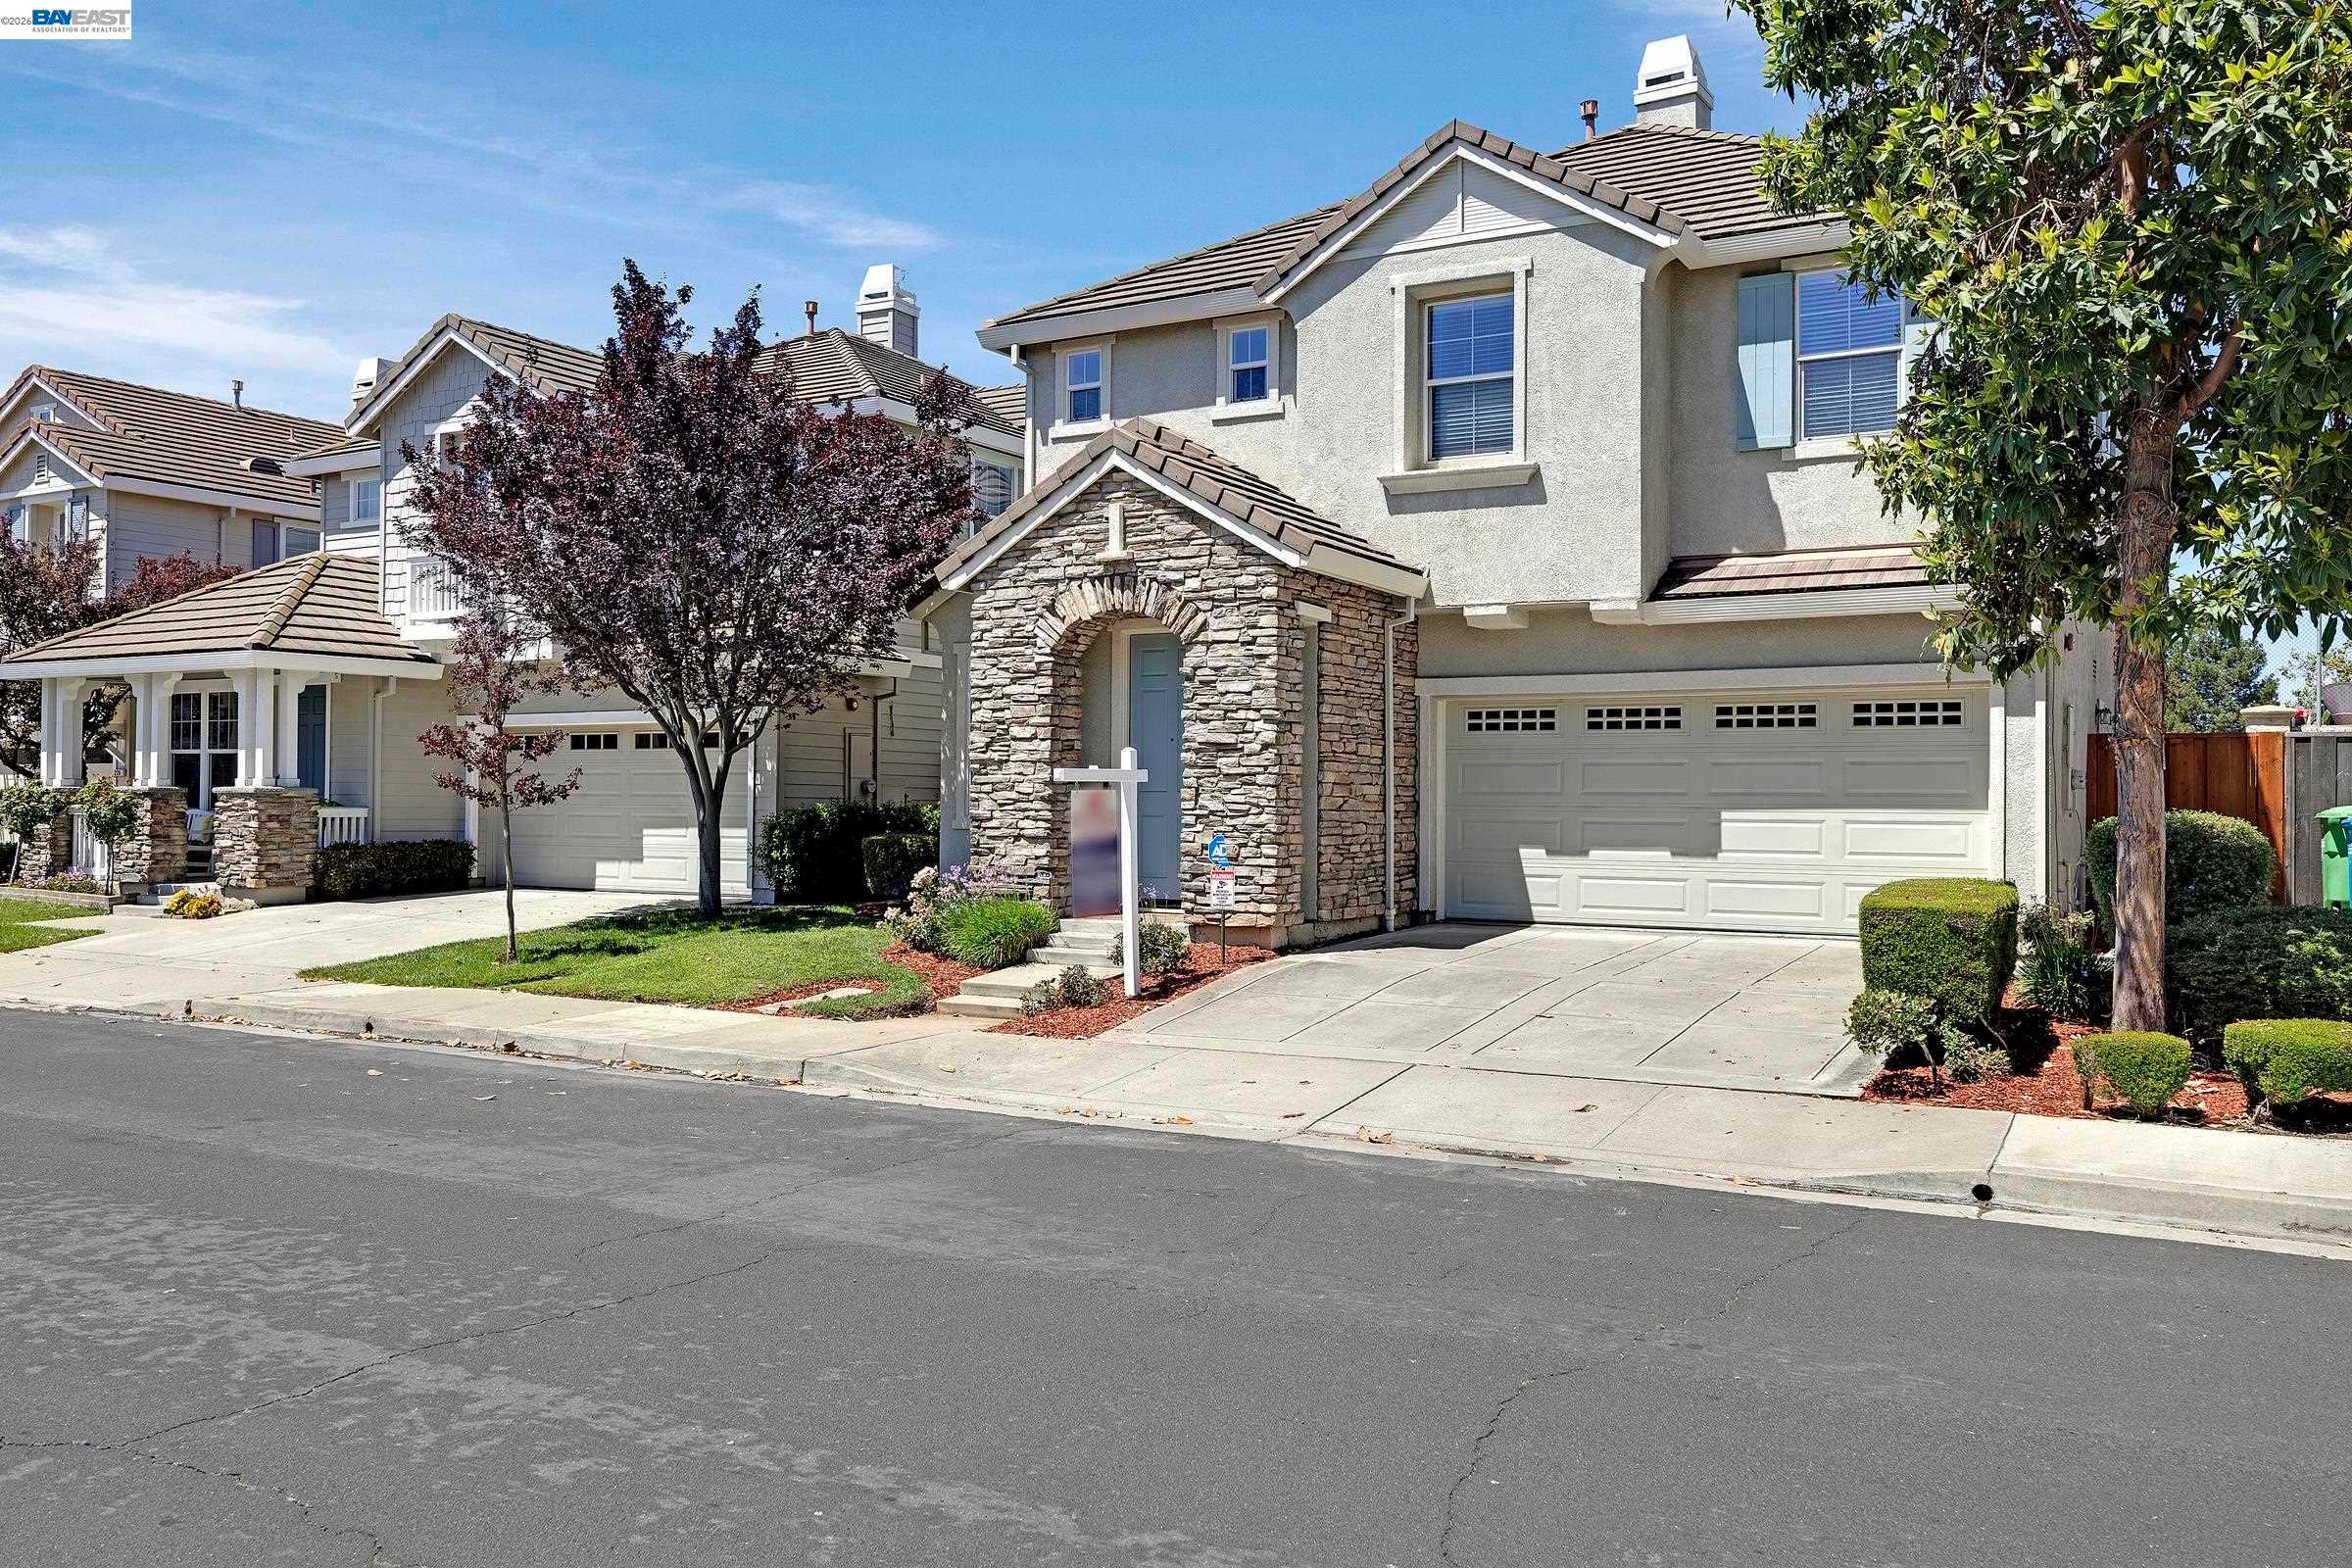
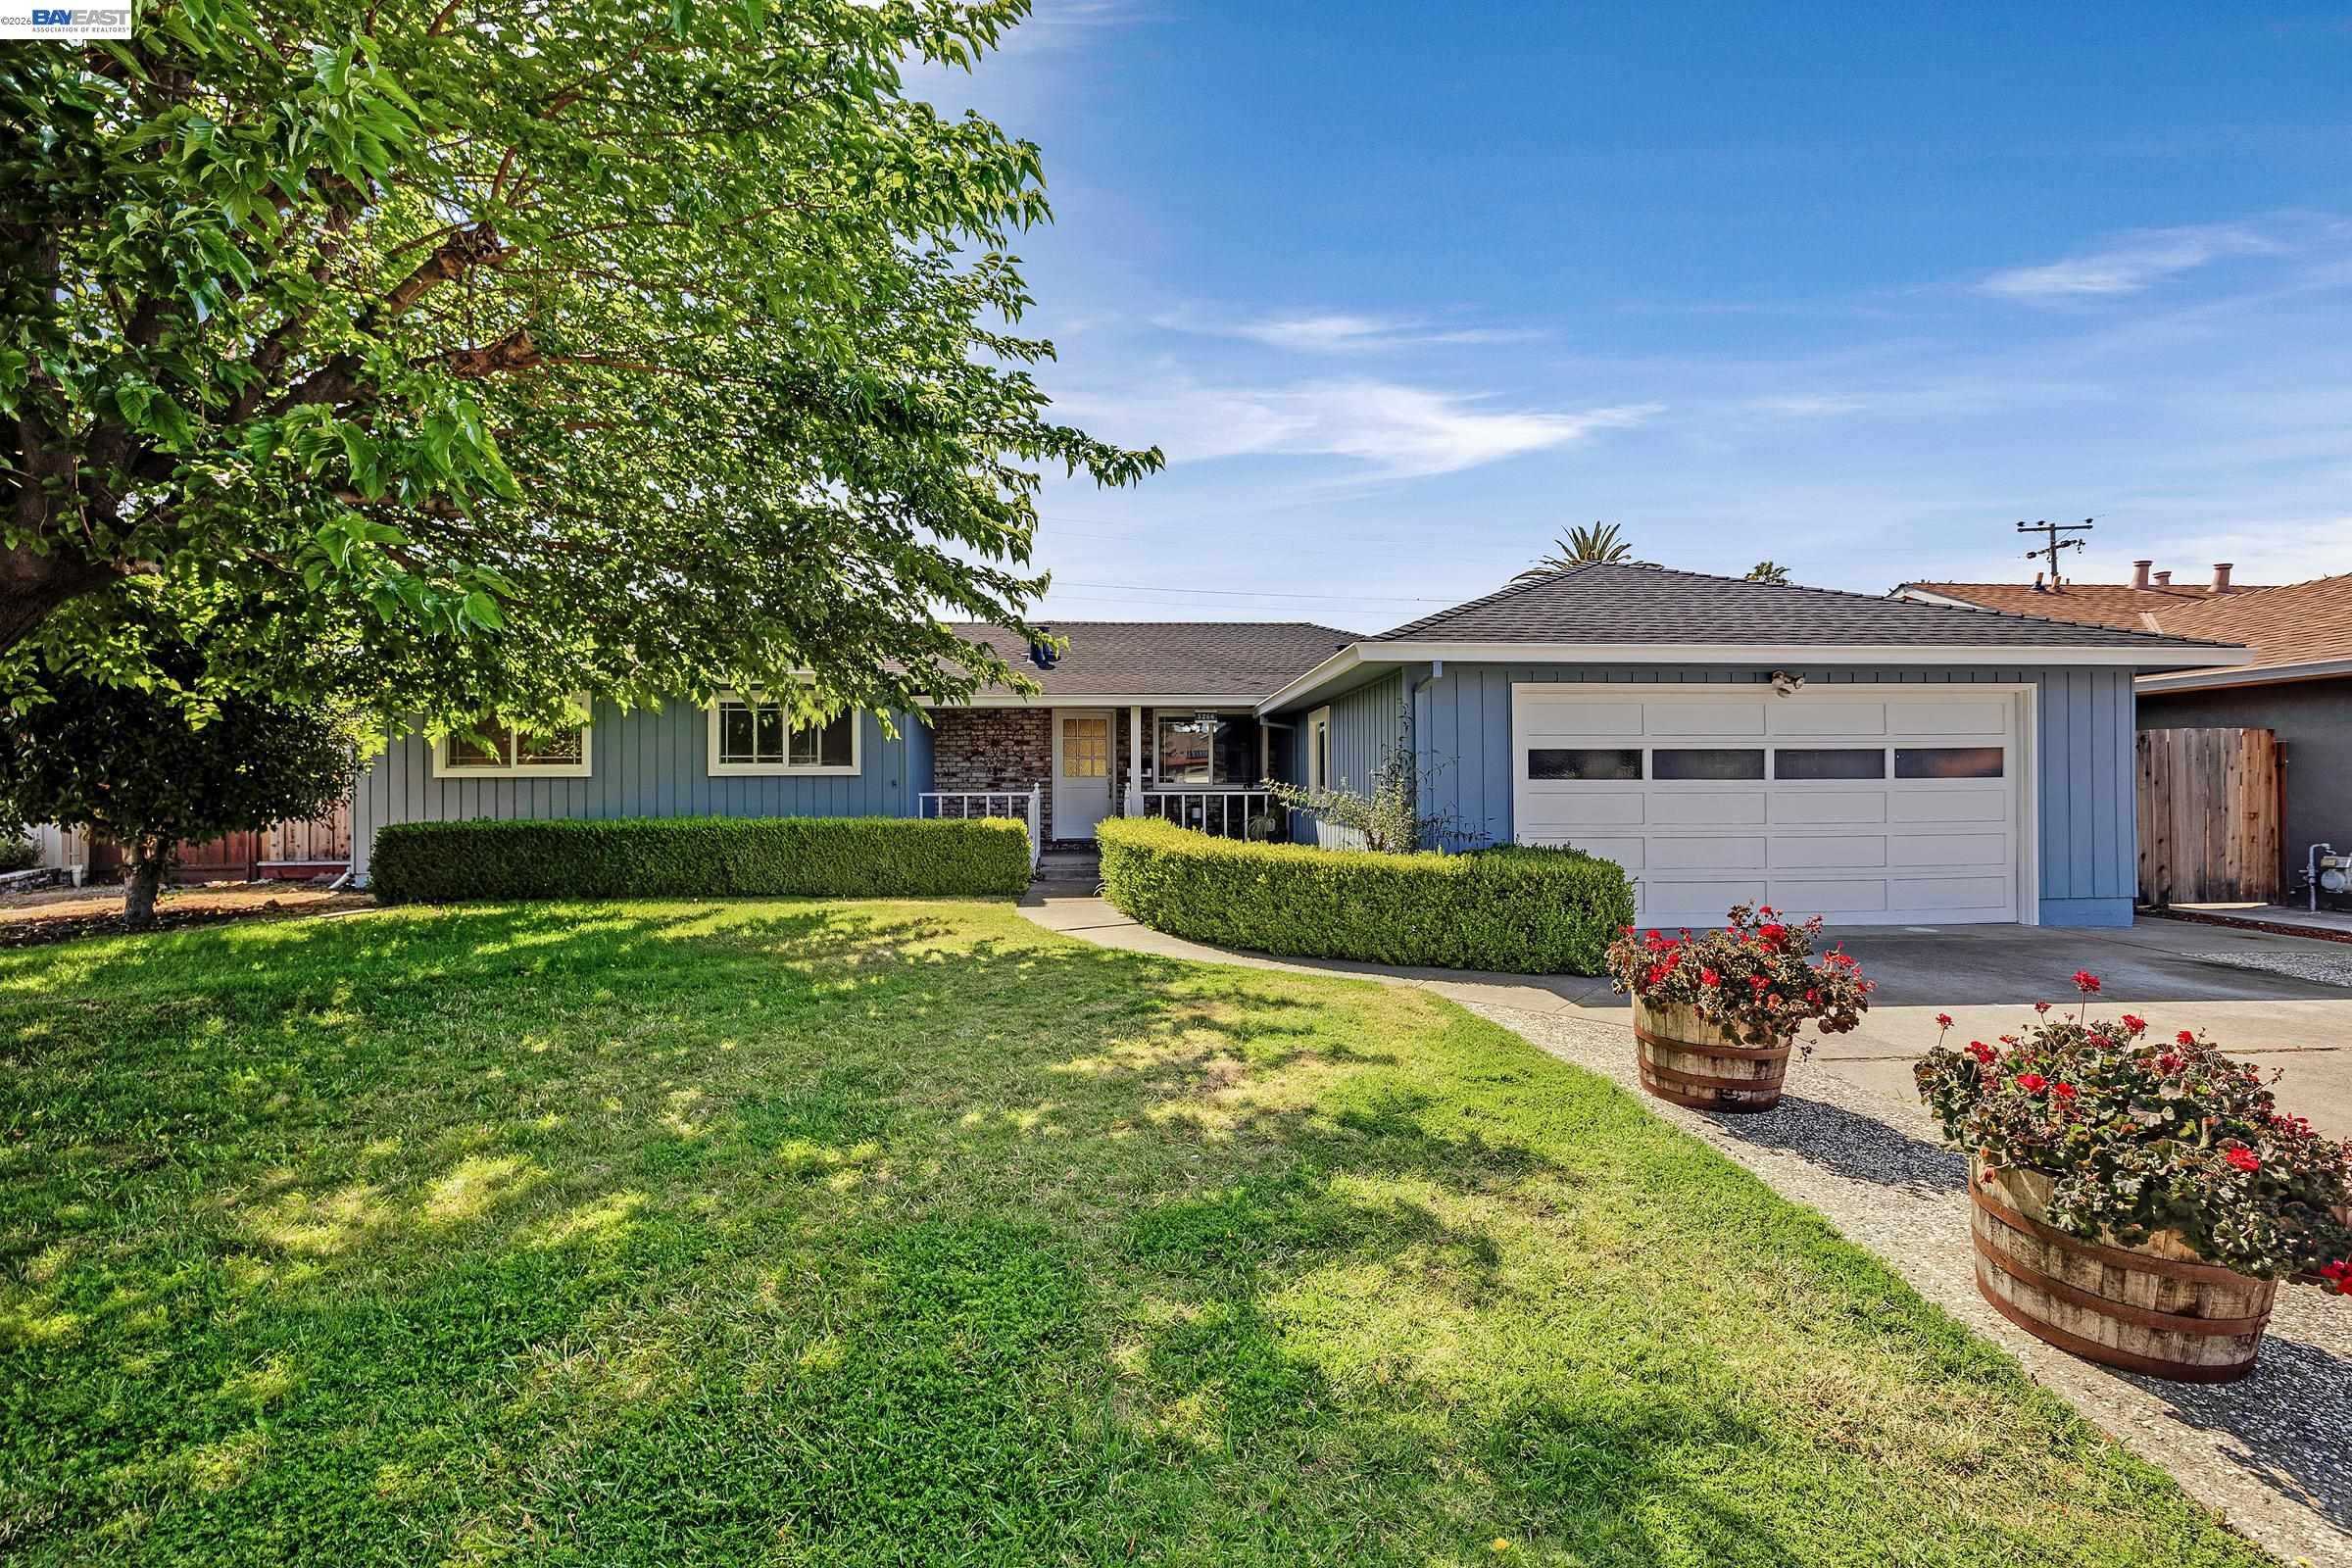
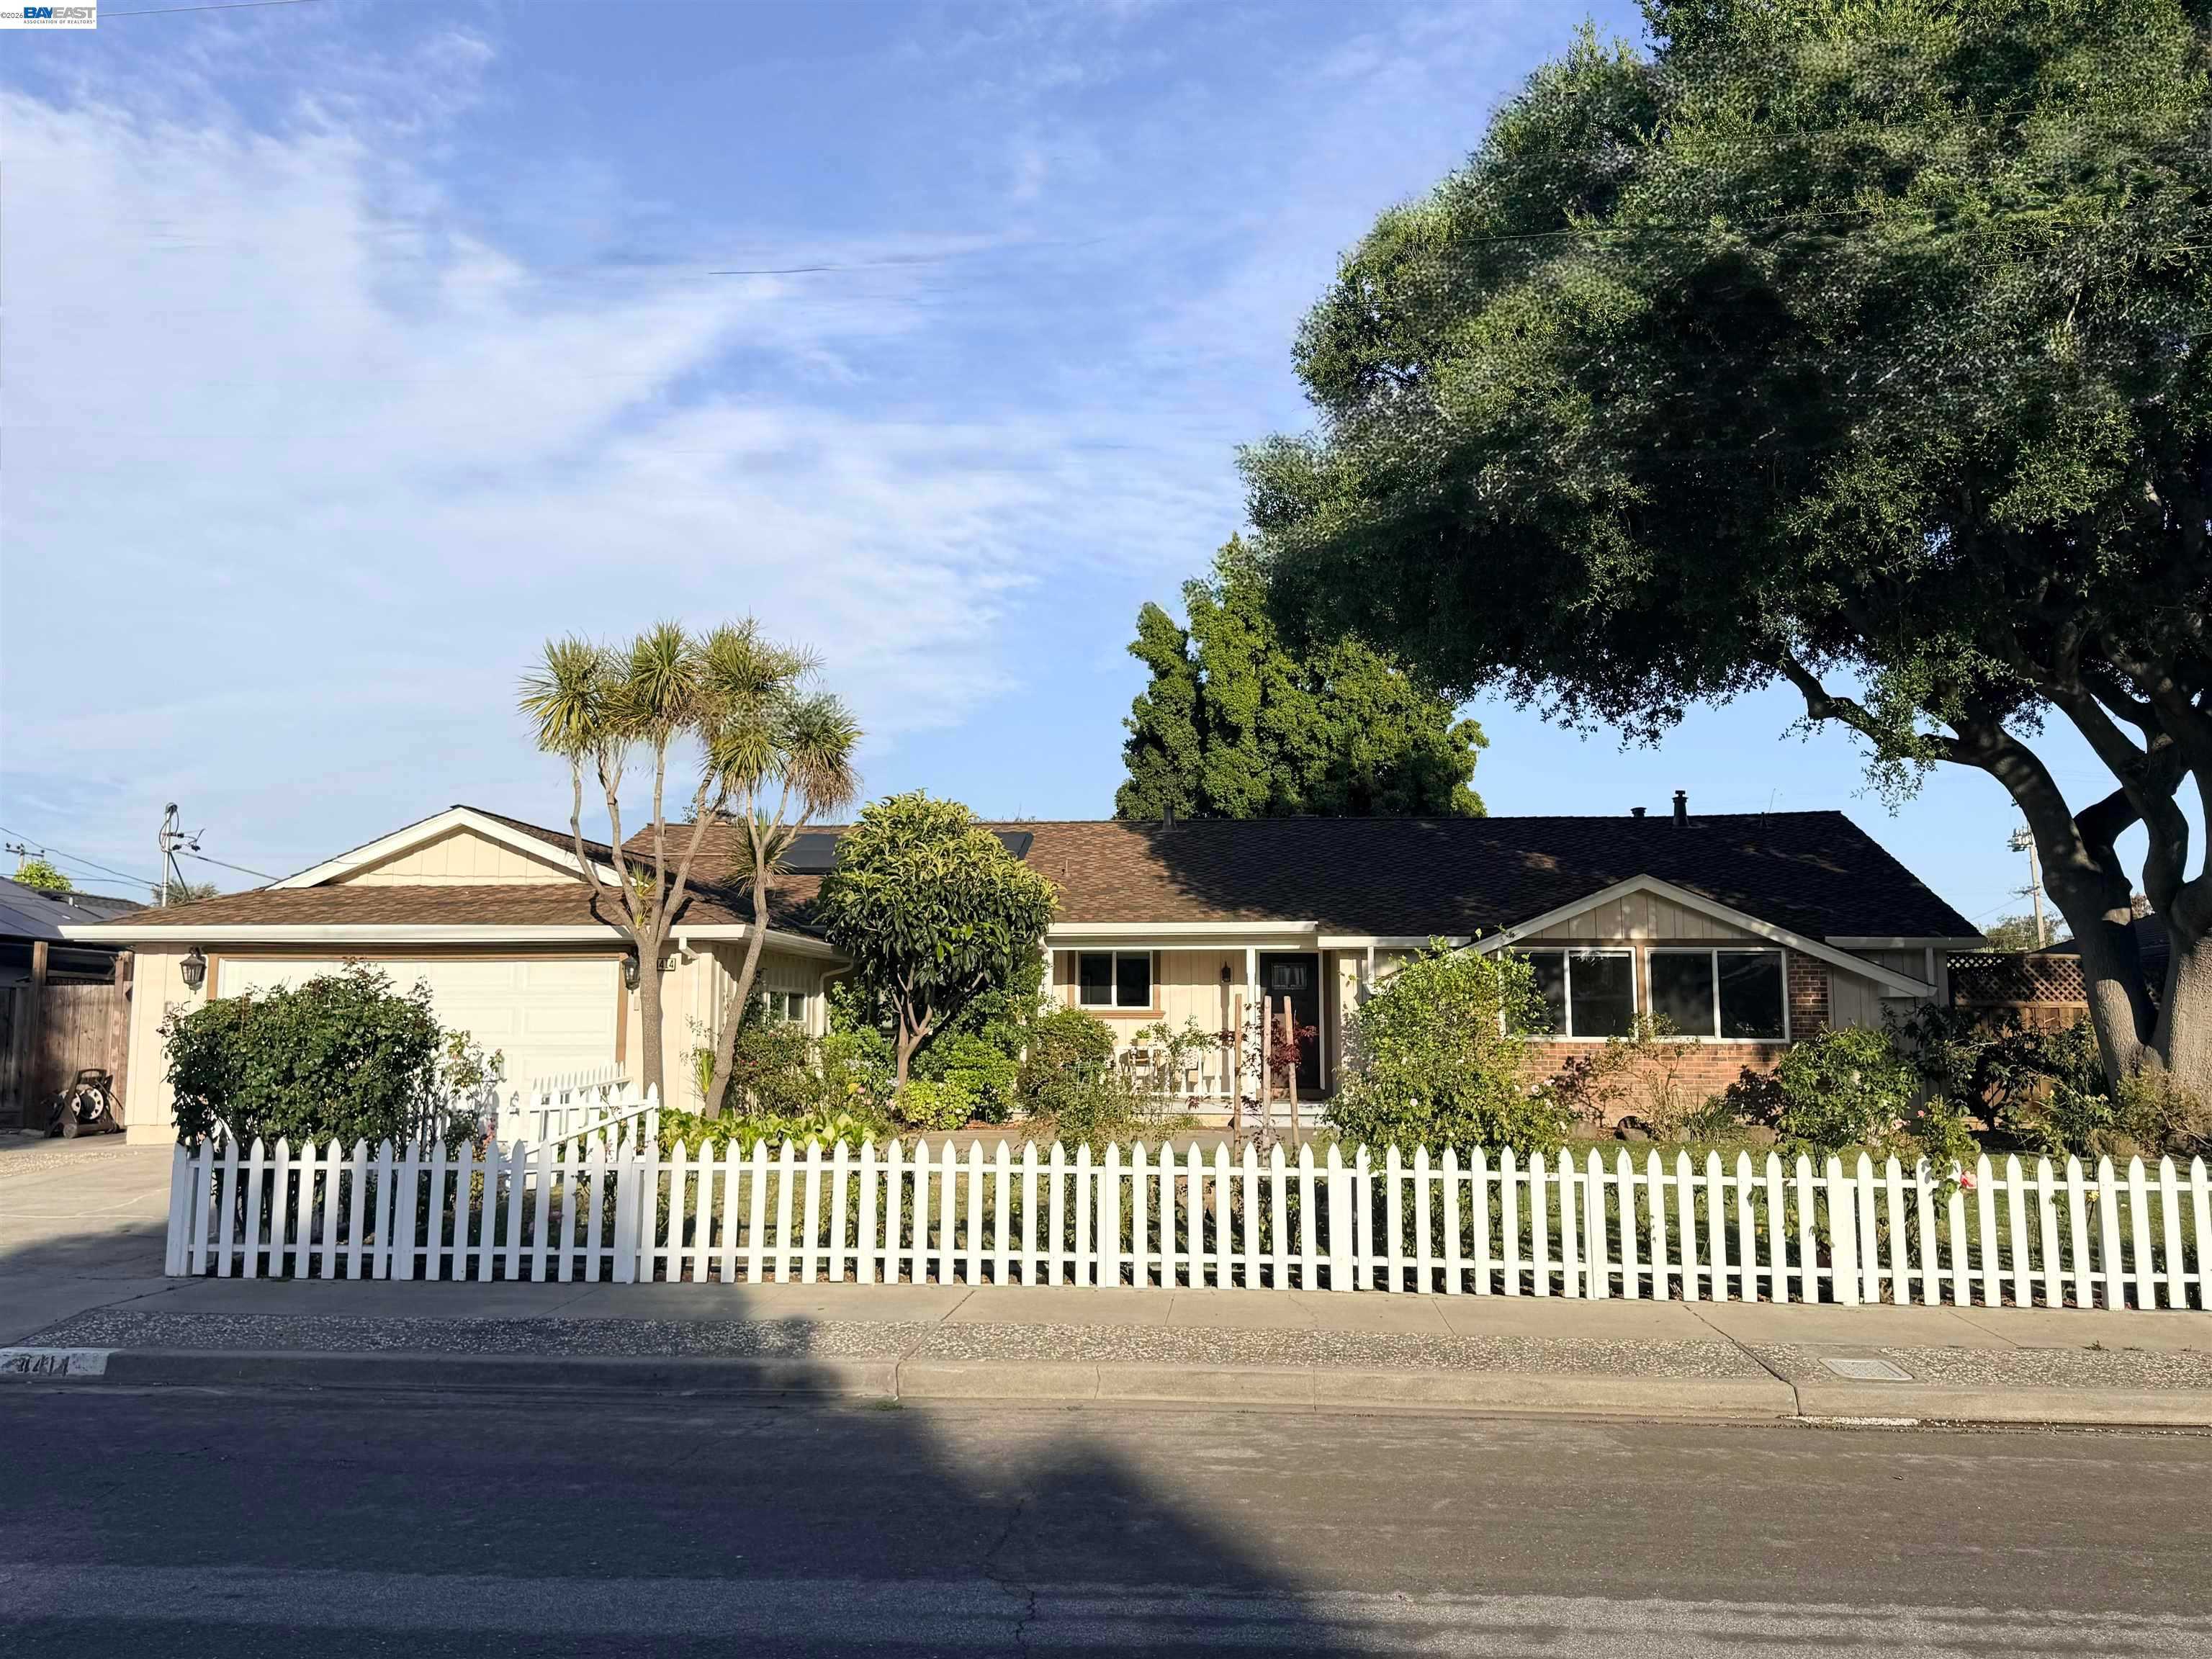
Behind these county totals: hundreds of homes still for sale in Fremont, Hayward, Union City, Newark and Milpitas, counted, priced and sorted every morning from the same MLS export, with a map search for the homes themselves.
30-Year Fixed: 7.17% 0.00 | 15-Year Fixed: 6.83% +0.03
Rates are where Friday left them. Mortgage News Daily's 30-year average is 7.17% and the 15-year 6.83%; those are Friday's rates, and Monday's reading posts this afternoon. The 30-year is 0.10 lower than a week ago and 0.39 lower than a month ago (7.56%). At 7.17%, a Fremont buyer at today's $1,286,500 median with 20% down would pay about $6,965 a month in principal and interest, $274 less than at last month's rate.
December Fed odds keep climbing. By our math from fed funds futures at 9:00 AM PT, traders put the chance of a quarter point increase at the December 9 Federal Reserve meeting at about 82%, up from the high 70s after Friday's settlement. The Fed's target range is 3.75% to 4.00%. The Fed does not set mortgage rates; they follow the 10-Year Treasury, which is near 4.88% this morning, about where it was Friday.
What it means for you. If you are under contract or close to it, ask your lender what a lock through early December would cost, since the Fed meets December 9. Every quarter point on the median Fremont home is about $175 a month. Sellers, 175 homes in our five cities have now been listed 60 days or longer, up from 163 in Saturday's report.
Today's count. Board wide: 2,451 listings across the 15 city table, counting active and in contract together, down from 2,456, with 140 coming soon and 157 brand new. The five city ledger carries 624 live listings across Fremont, Hayward, Milpitas, Newark and Union City, 560 on the market and 64 coming soon, down from 625.
Fremont holds 212 live listings: 168 active, 28 coming soon and 15 brand new, with a median on market list price of $1,286,500 at $802 a square foot, down from $1,298,000, and a typical listing out 35 days. Hayward carries 178, Milpitas 94, Newark 78 and Union City 62. Across all five cities the median is $1,022,475 at $665 a square foot, 278 homes are priced under a million, and 175 have been sitting 60 days or longer.
S&P 500: 7,544.41 +2.27% | Dow: 52,336.11 +2.05% | Nasdaq: 25,223.41 +2.62%
Stocks are bouncing back. At 9:13 AM PT Monday the S&P 500 is up 2.27%, the Nasdaq 2.62% and the Dow 2.05%, or about 1,050 points, against Friday's close. Even so, the S&P 500 is still about 1.9% below where it closed last Wednesday, before Thursday's selloff.
Local chipmakers lead. The Philadelphia Semiconductor Index is up 6.62% and sits about 2.5% below its Wednesday close, after Thursday's 12.25% plunge. Fremont's Lam Research is up 9.2% and Milpitas's KLA 8.9%. AMD is up 11.6%. Nvidia is the exception, down 4.9%. Falling oil is helping too.
10-Year Treasury: 4.88% +0.02 | Gold: $4,120.20 +1.11% | Silver: $52.77 +1.60% | Brent Crude: $98.32 +0.03%
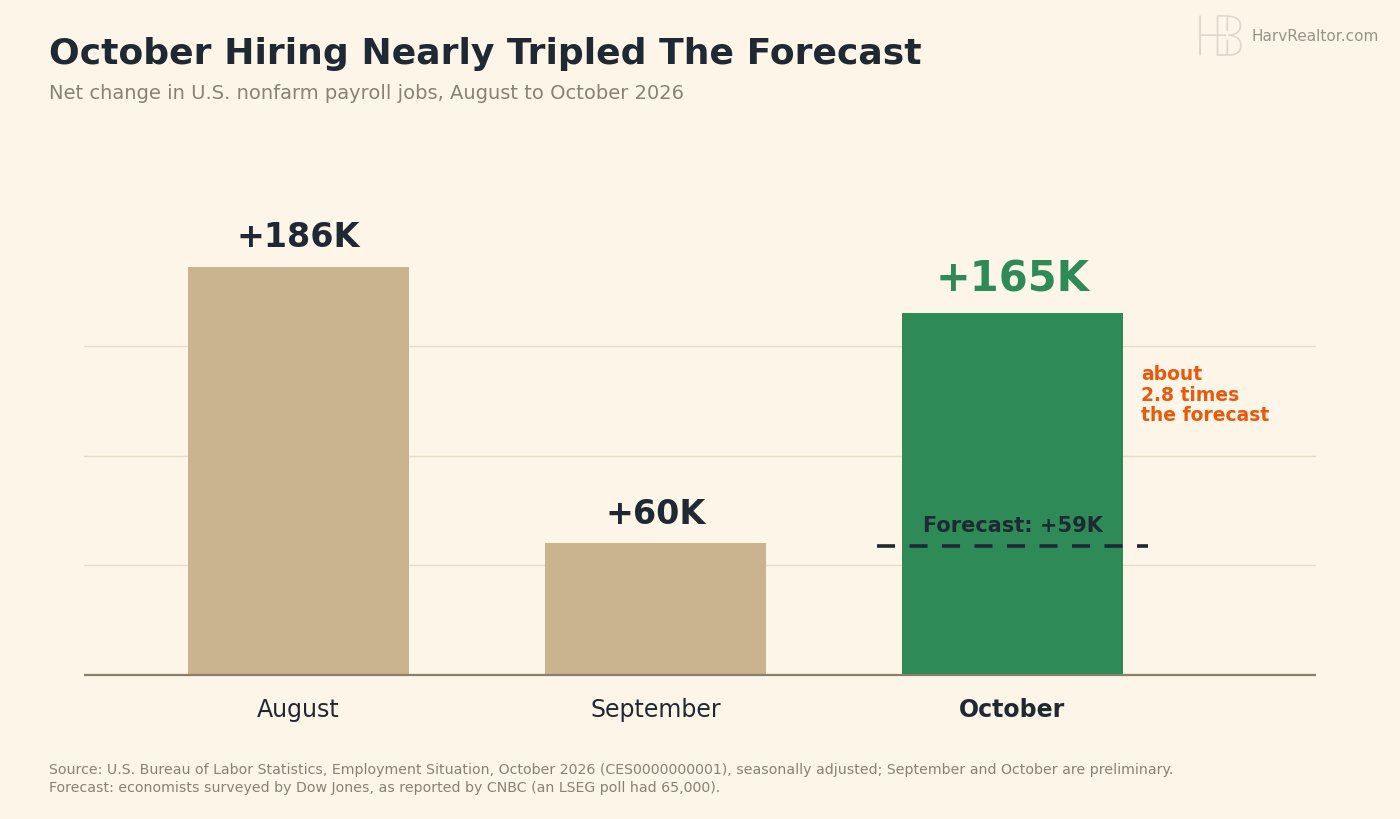
October hiring nearly tripled the forecast. Employers added 165,000 jobs in October, nearly three times the 59,000 that economists surveyed by Dow Jones expected, after 186,000 in August and 60,000 in September, the Bureau of Labor Statistics said. Unemployment eased to 4.1% from 4.2%. September and October are first estimates, and BLS revises each month twice.
Oil is the big mover. Brent futures are down about 4.5% to $93.86 at 9:13 AM PT; the Brent figure above is Friday's settlement of $98.32 because today's price has not settled. Gold is up 1.11% to $4,120.20 and silver 1.60% to $52.77 against Friday's settlements. The 10-Year is near 4.88%, up about 0.02 from Treasury's 4.86% close Friday.
Bitcoin: $74,834 -1.07% | Ethereum: $2,126.19 -4.43% | XRP: $1.10 -5.11%
Crypto is not joining the rally. Over 24 hours Bitcoin is down 1.07% near $74,834, Ether 4.43% near $2,126.19 and XRP 5.11% near $1.10, live from CoinGecko at 9:13 AM PT. Bitcoin is about $900 below where it stood when we wrote Saturday's report.
Sources
- Mortgage News Daily (30 year and 15 year index, November 6)
- U.S. Bureau of Labor Statistics (Employment Situation, October 2026)
- CME Group (30 day fed funds futures, November 9 at 9:00 AM PT)
- Federal Reserve Bank of New York (effective federal funds rate and target range)
- U.S. Treasury (10-Year daily yield curve, November 6)
- Yahoo Finance (index, chip stock and futures quotes, November 9 at 9:13 AM PT)
- CNBC (COMEX gold and silver and ICE Brent settlements, November 6)
- October jobs forecast: economists surveyed by Dow Jones, as reported by CNBC
- CoinGecko (9:13 AM PT November 9)
- Bay East MLS daily export, November 9, 2026
- REALTY EXPERTS® Live Inventory (five city ledger, November 9)
Disclaimer: The market data, rates, and information provided are for informational purposes only and should not be considered financial advice. Always verify rates and data with your lender or financial advisor before making any decisions.
Based on information from the Bay East Association of REALTORS® (Bay East MLS) as of November 9, 2026. All data, including all measurements and calculations of area, is obtained from various sources and has not been, and will not be, verified by broker or MLS. All information should be independently reviewed and verified for accuracy. Properties may or may not be listed by the office/agent presenting the information.