


"At a Glance" Local Housing STATS and News 10/24/26
October 24, 2026 · Alameda County Market Dashboard
TODAY'S LIVE INVENTORY
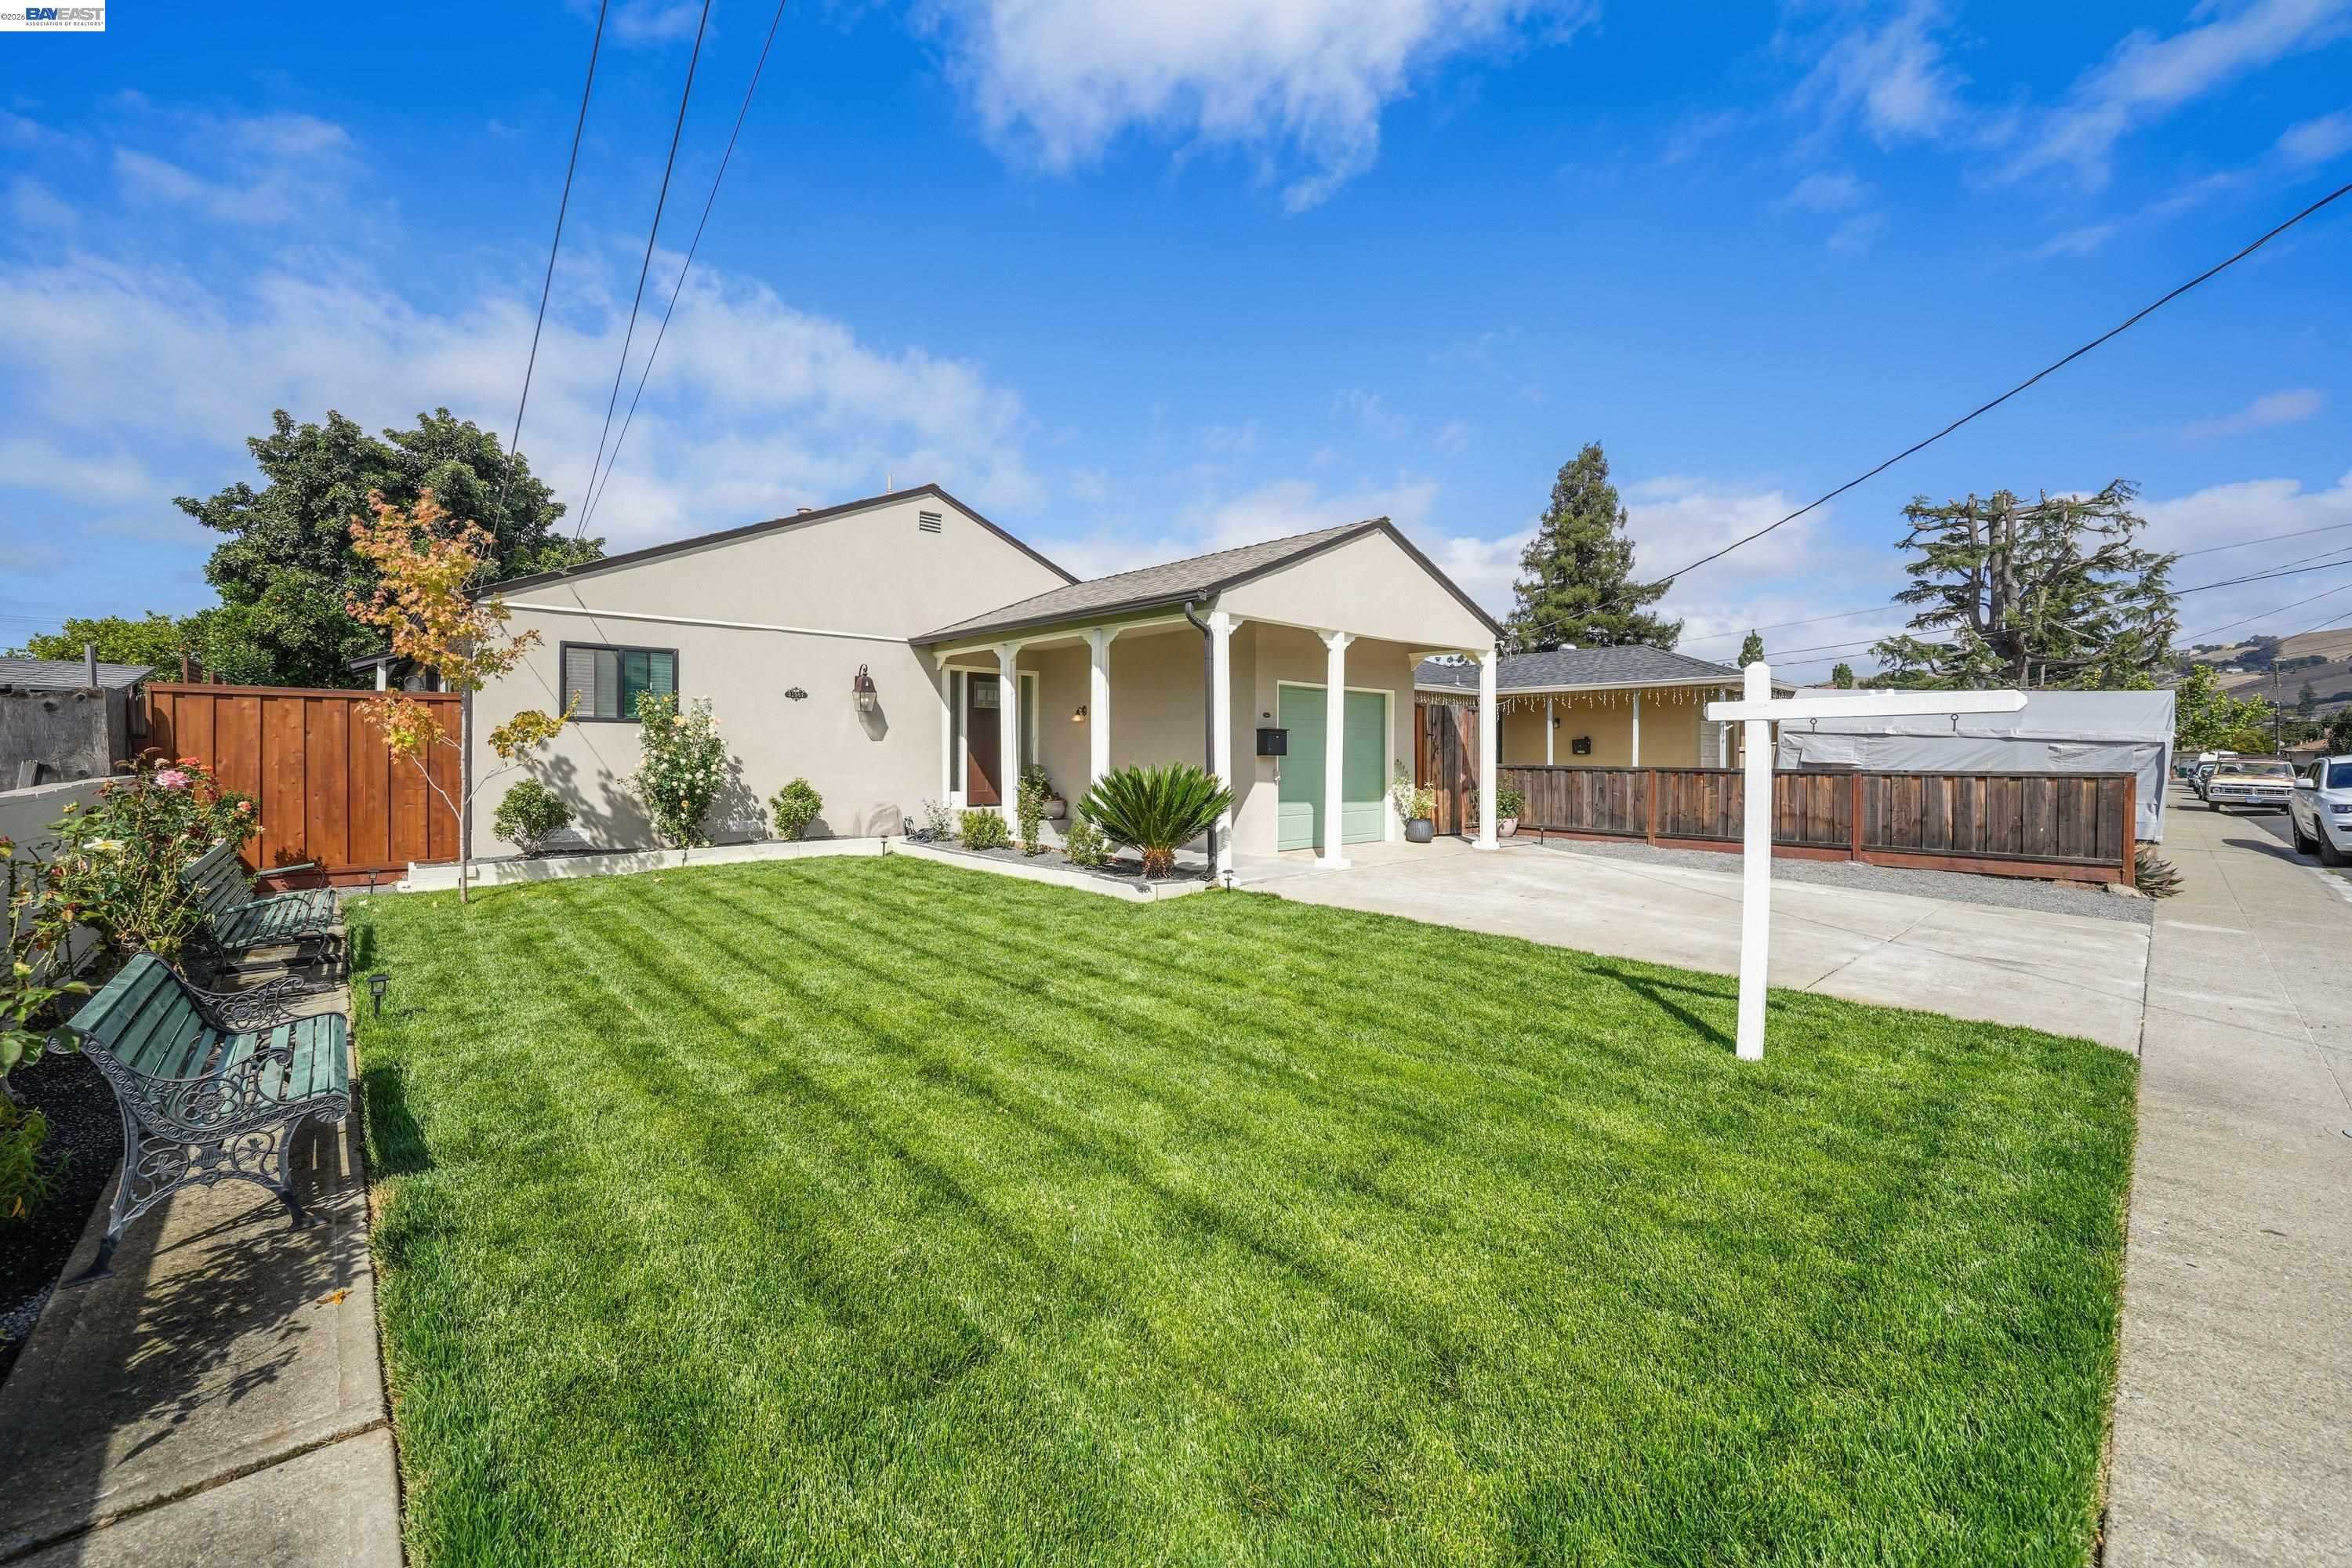
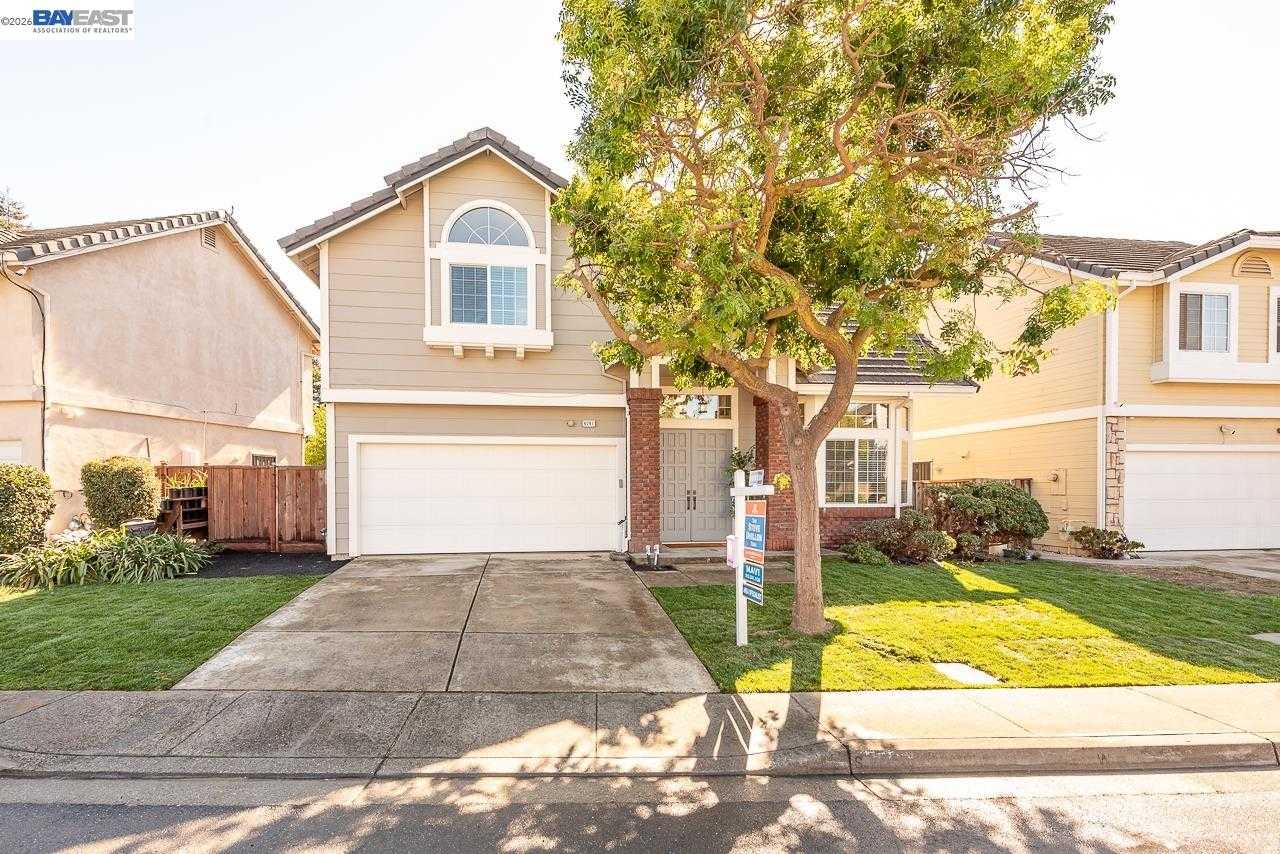
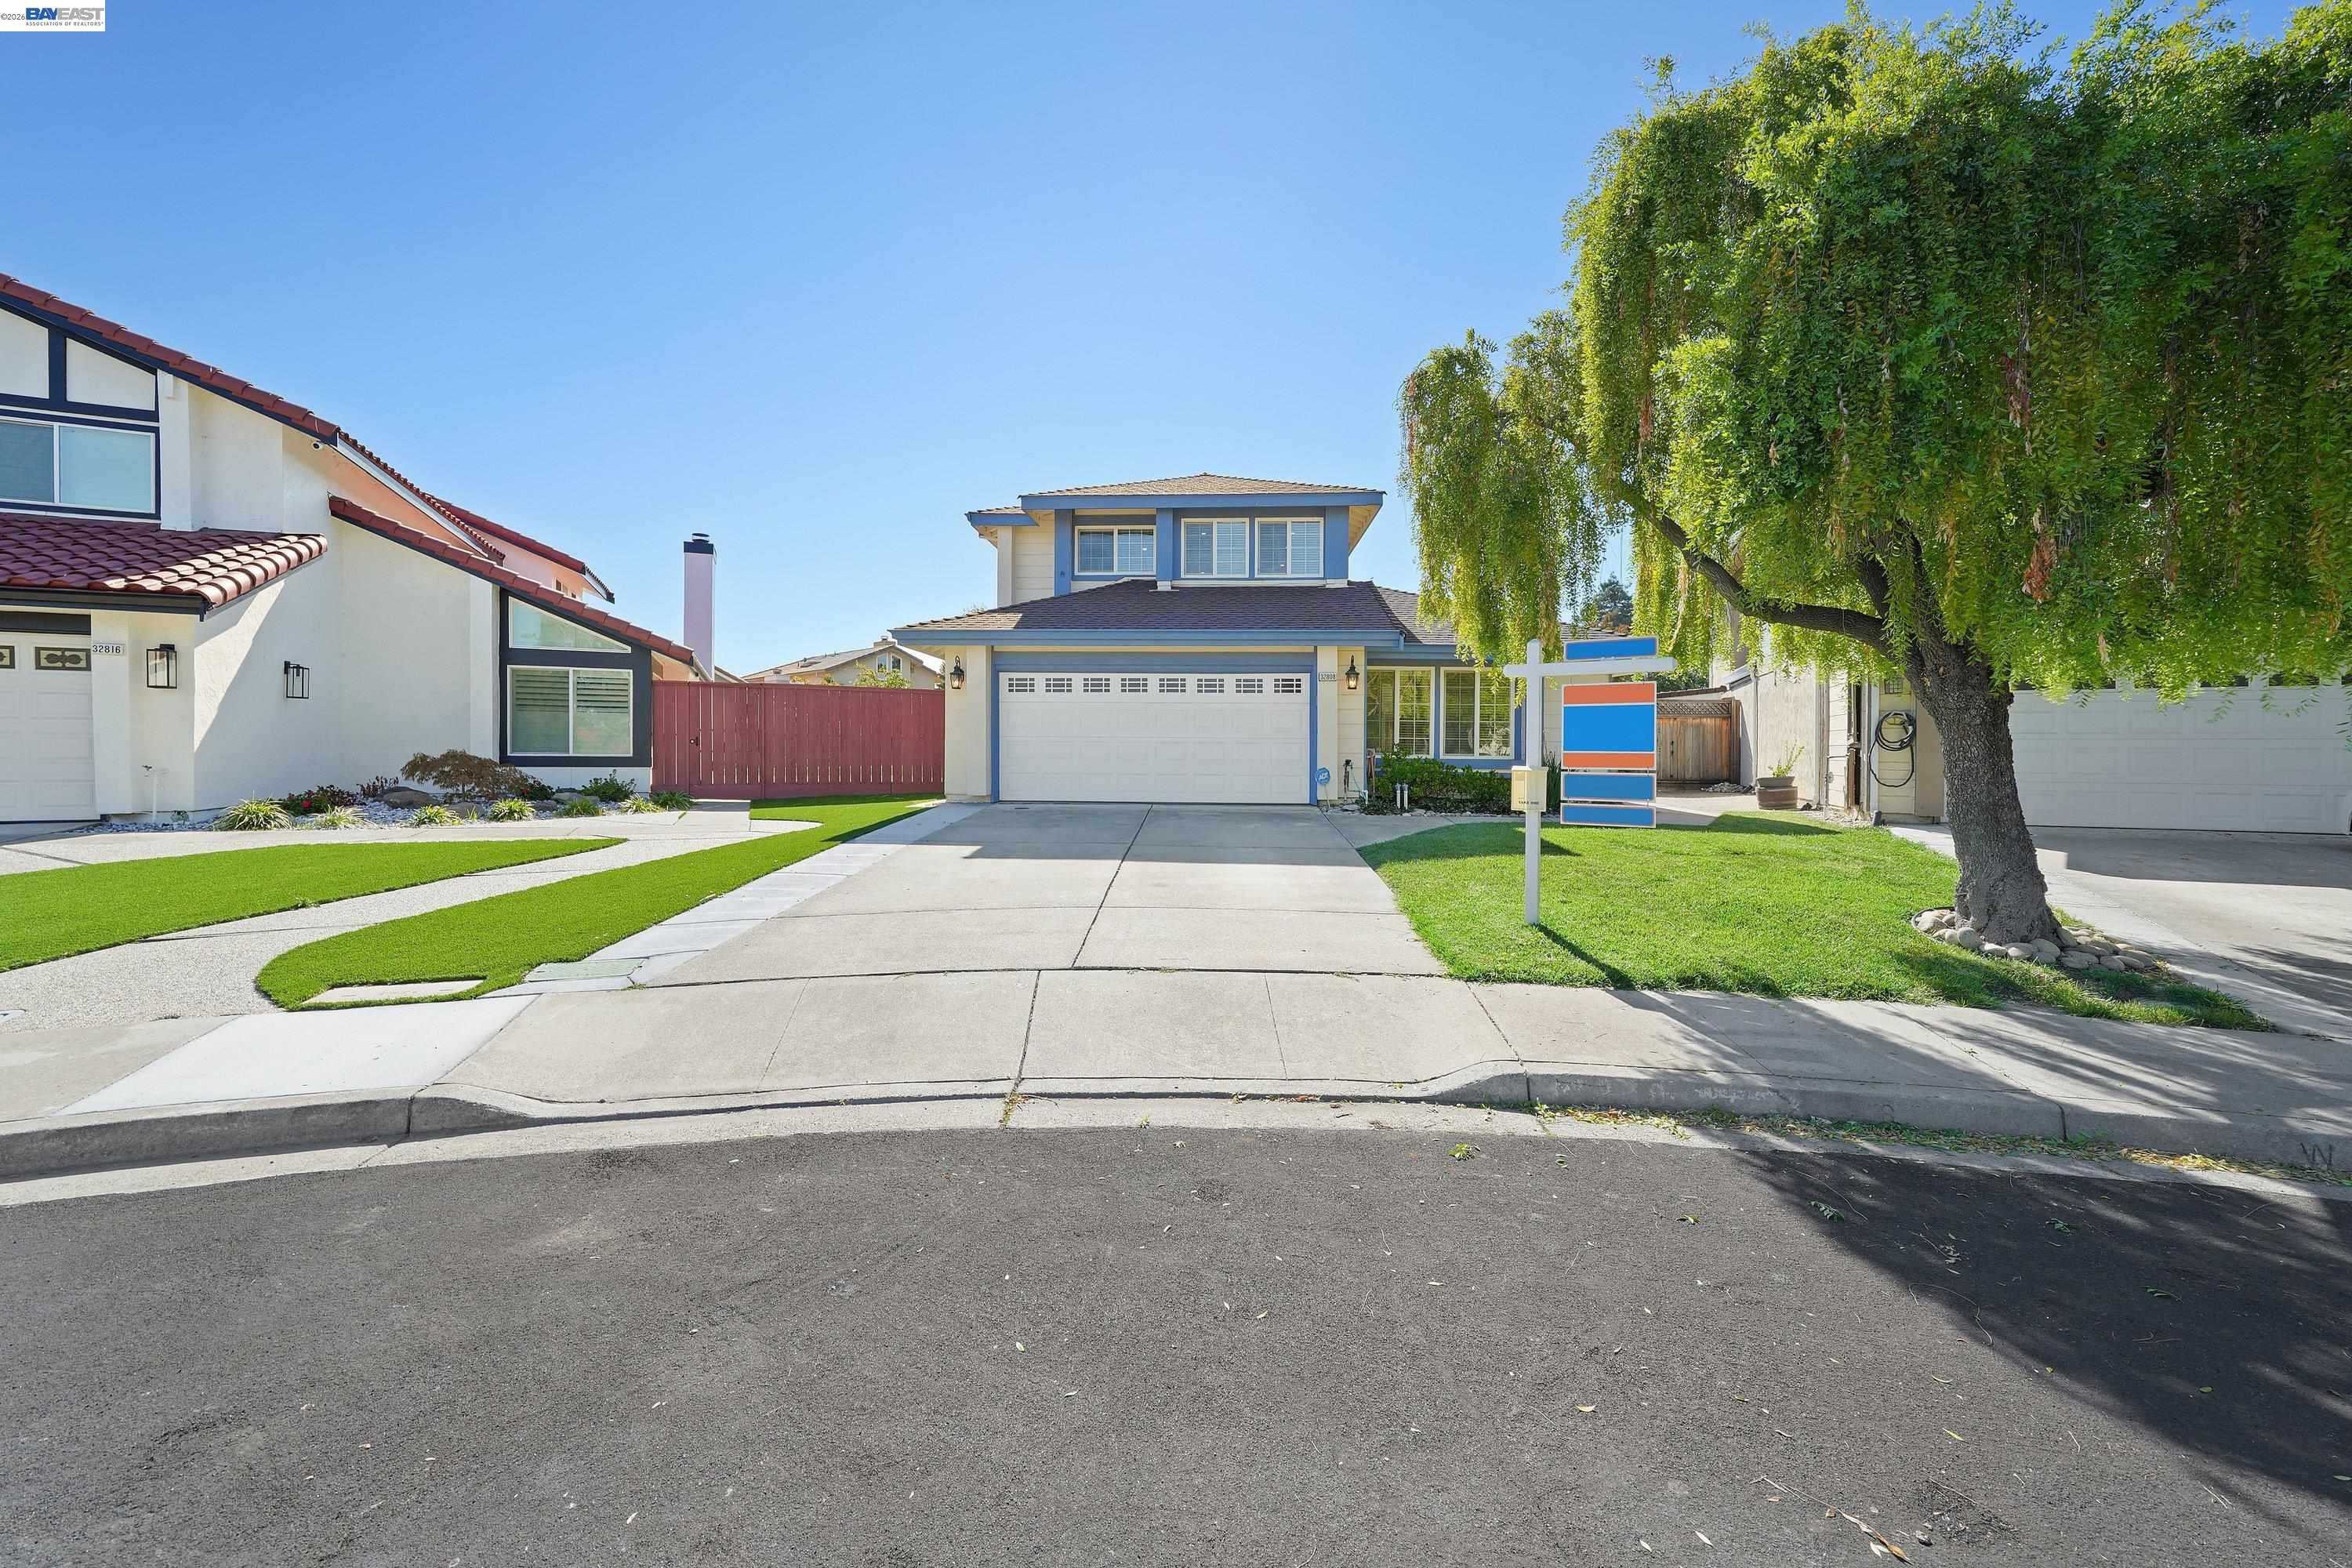
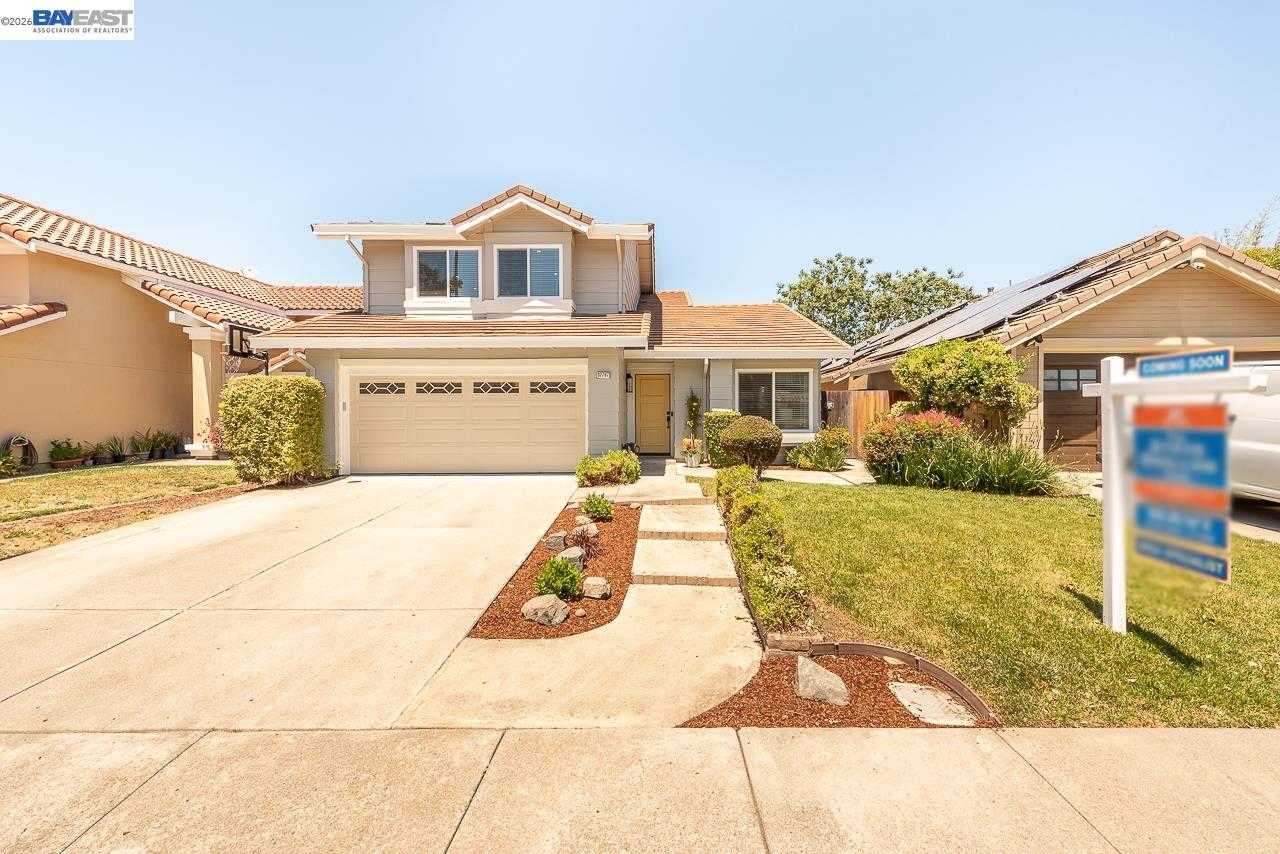
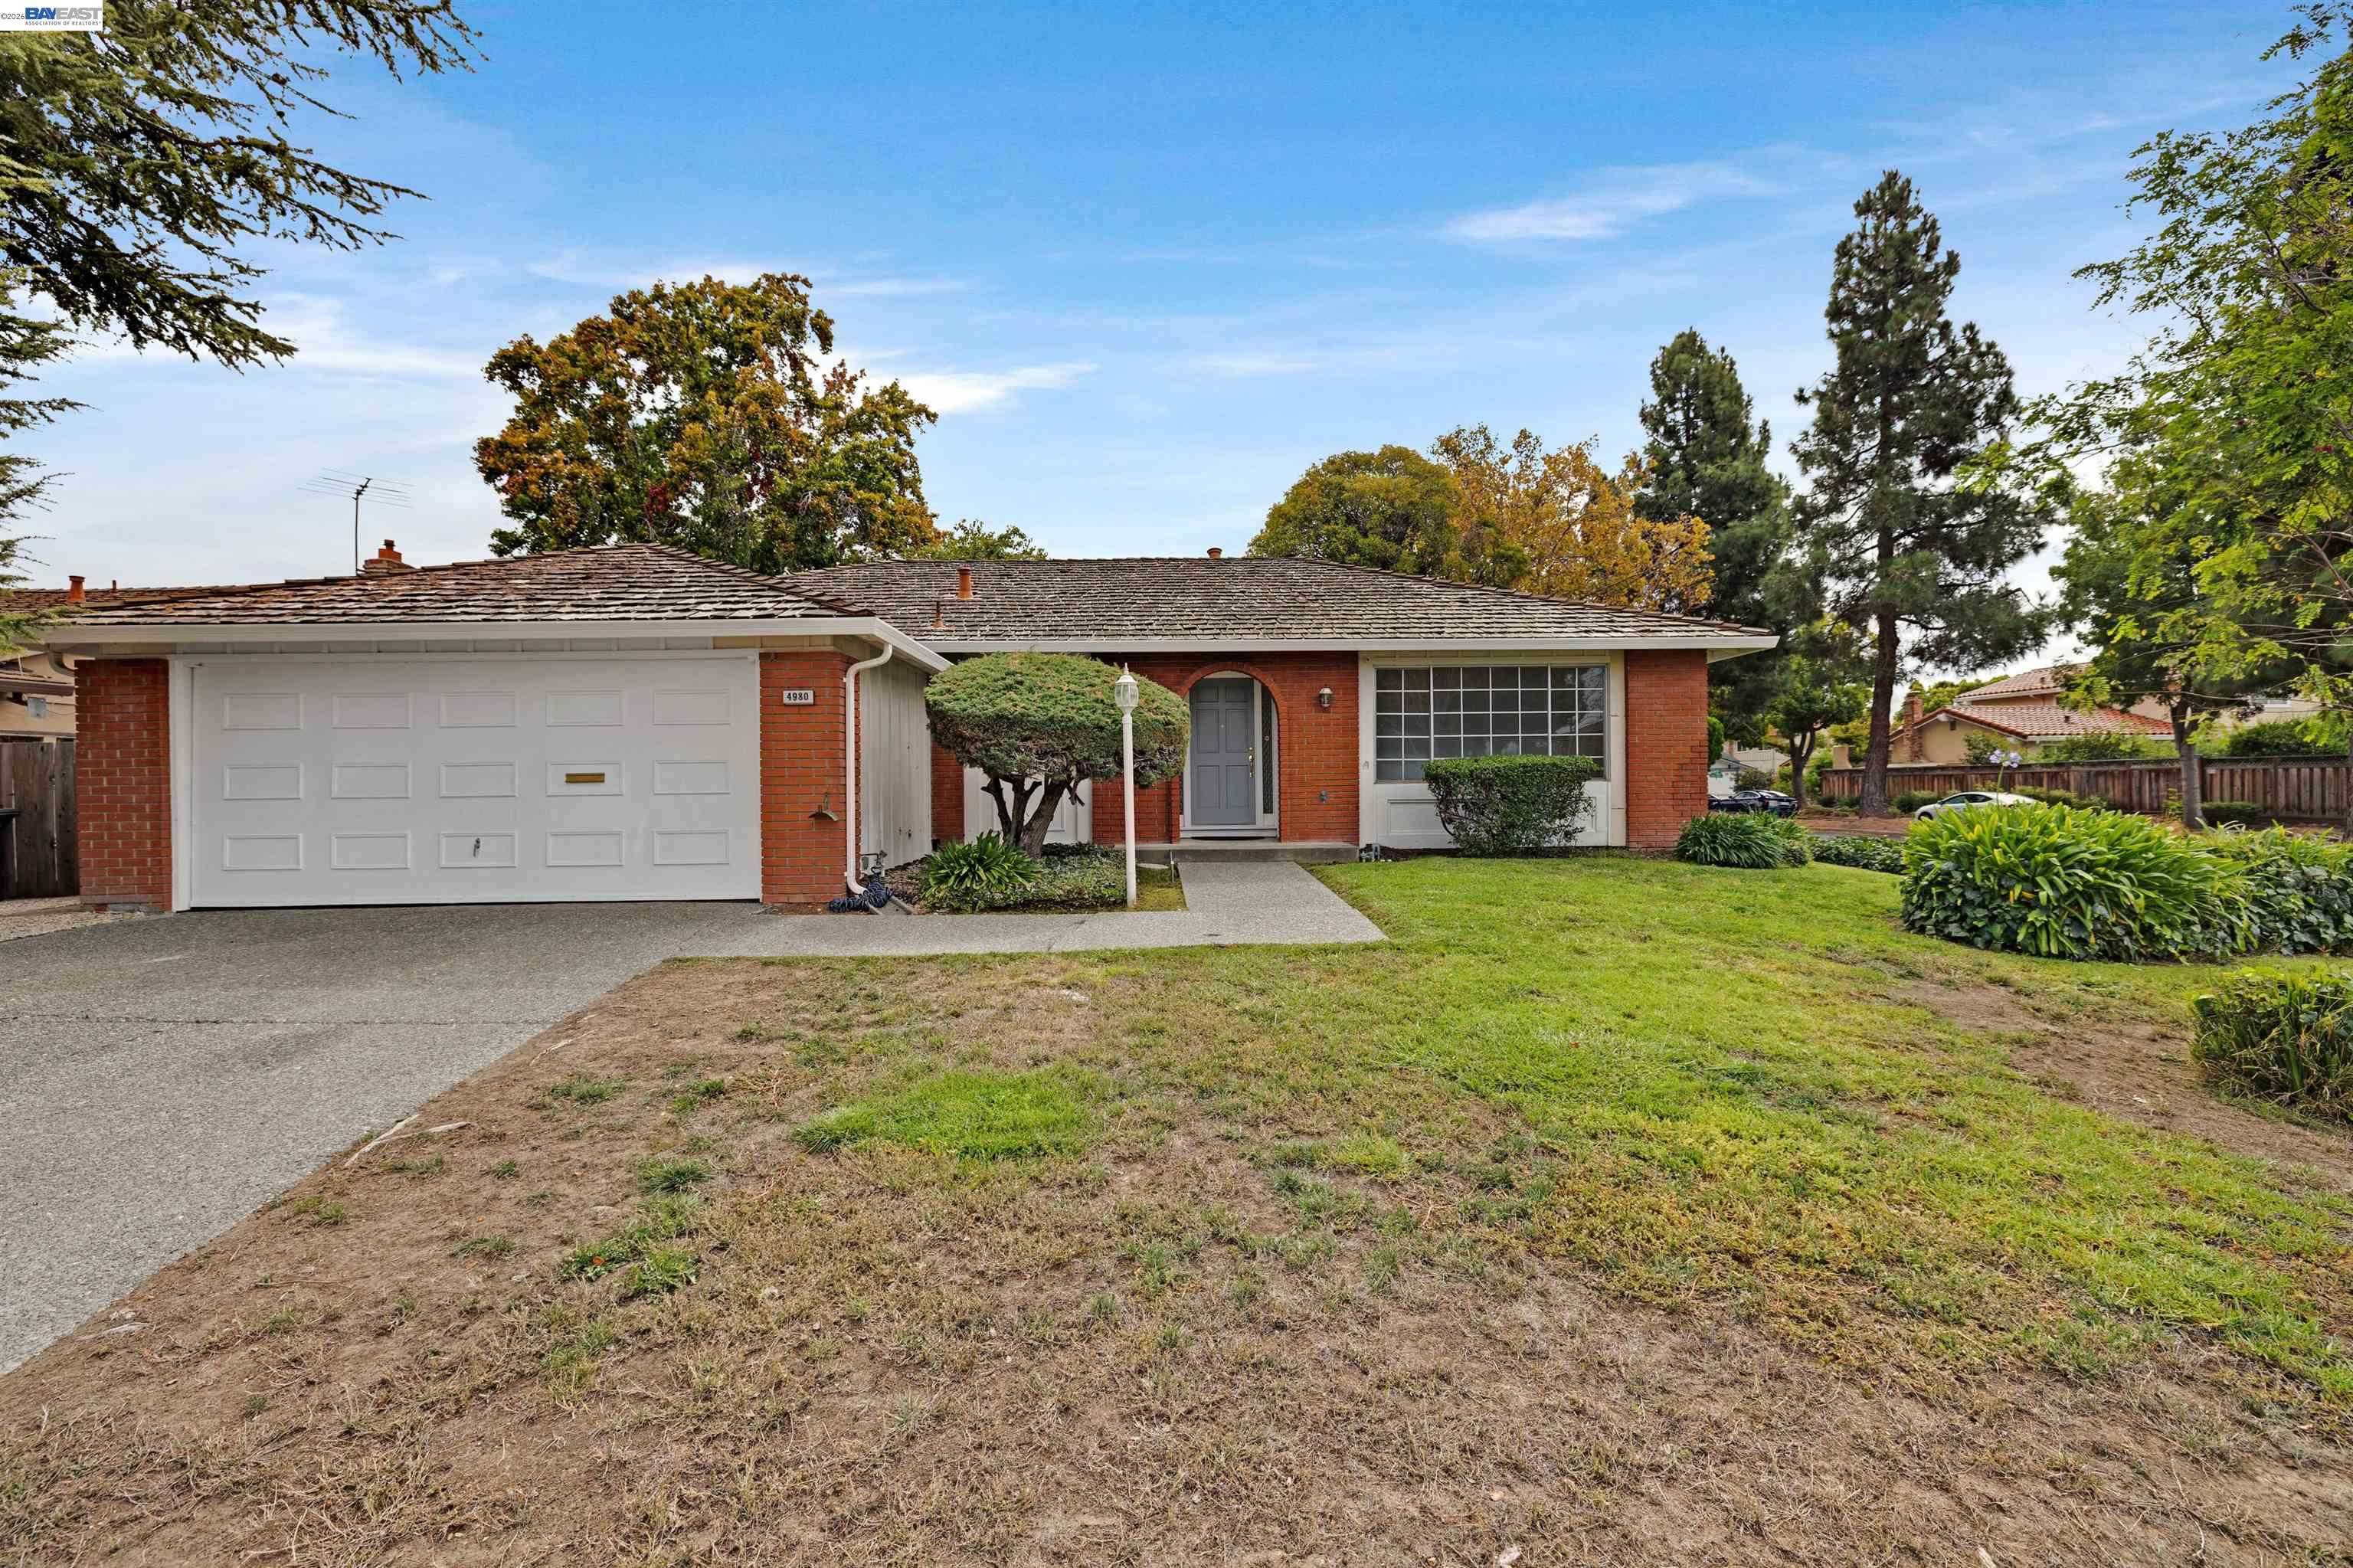
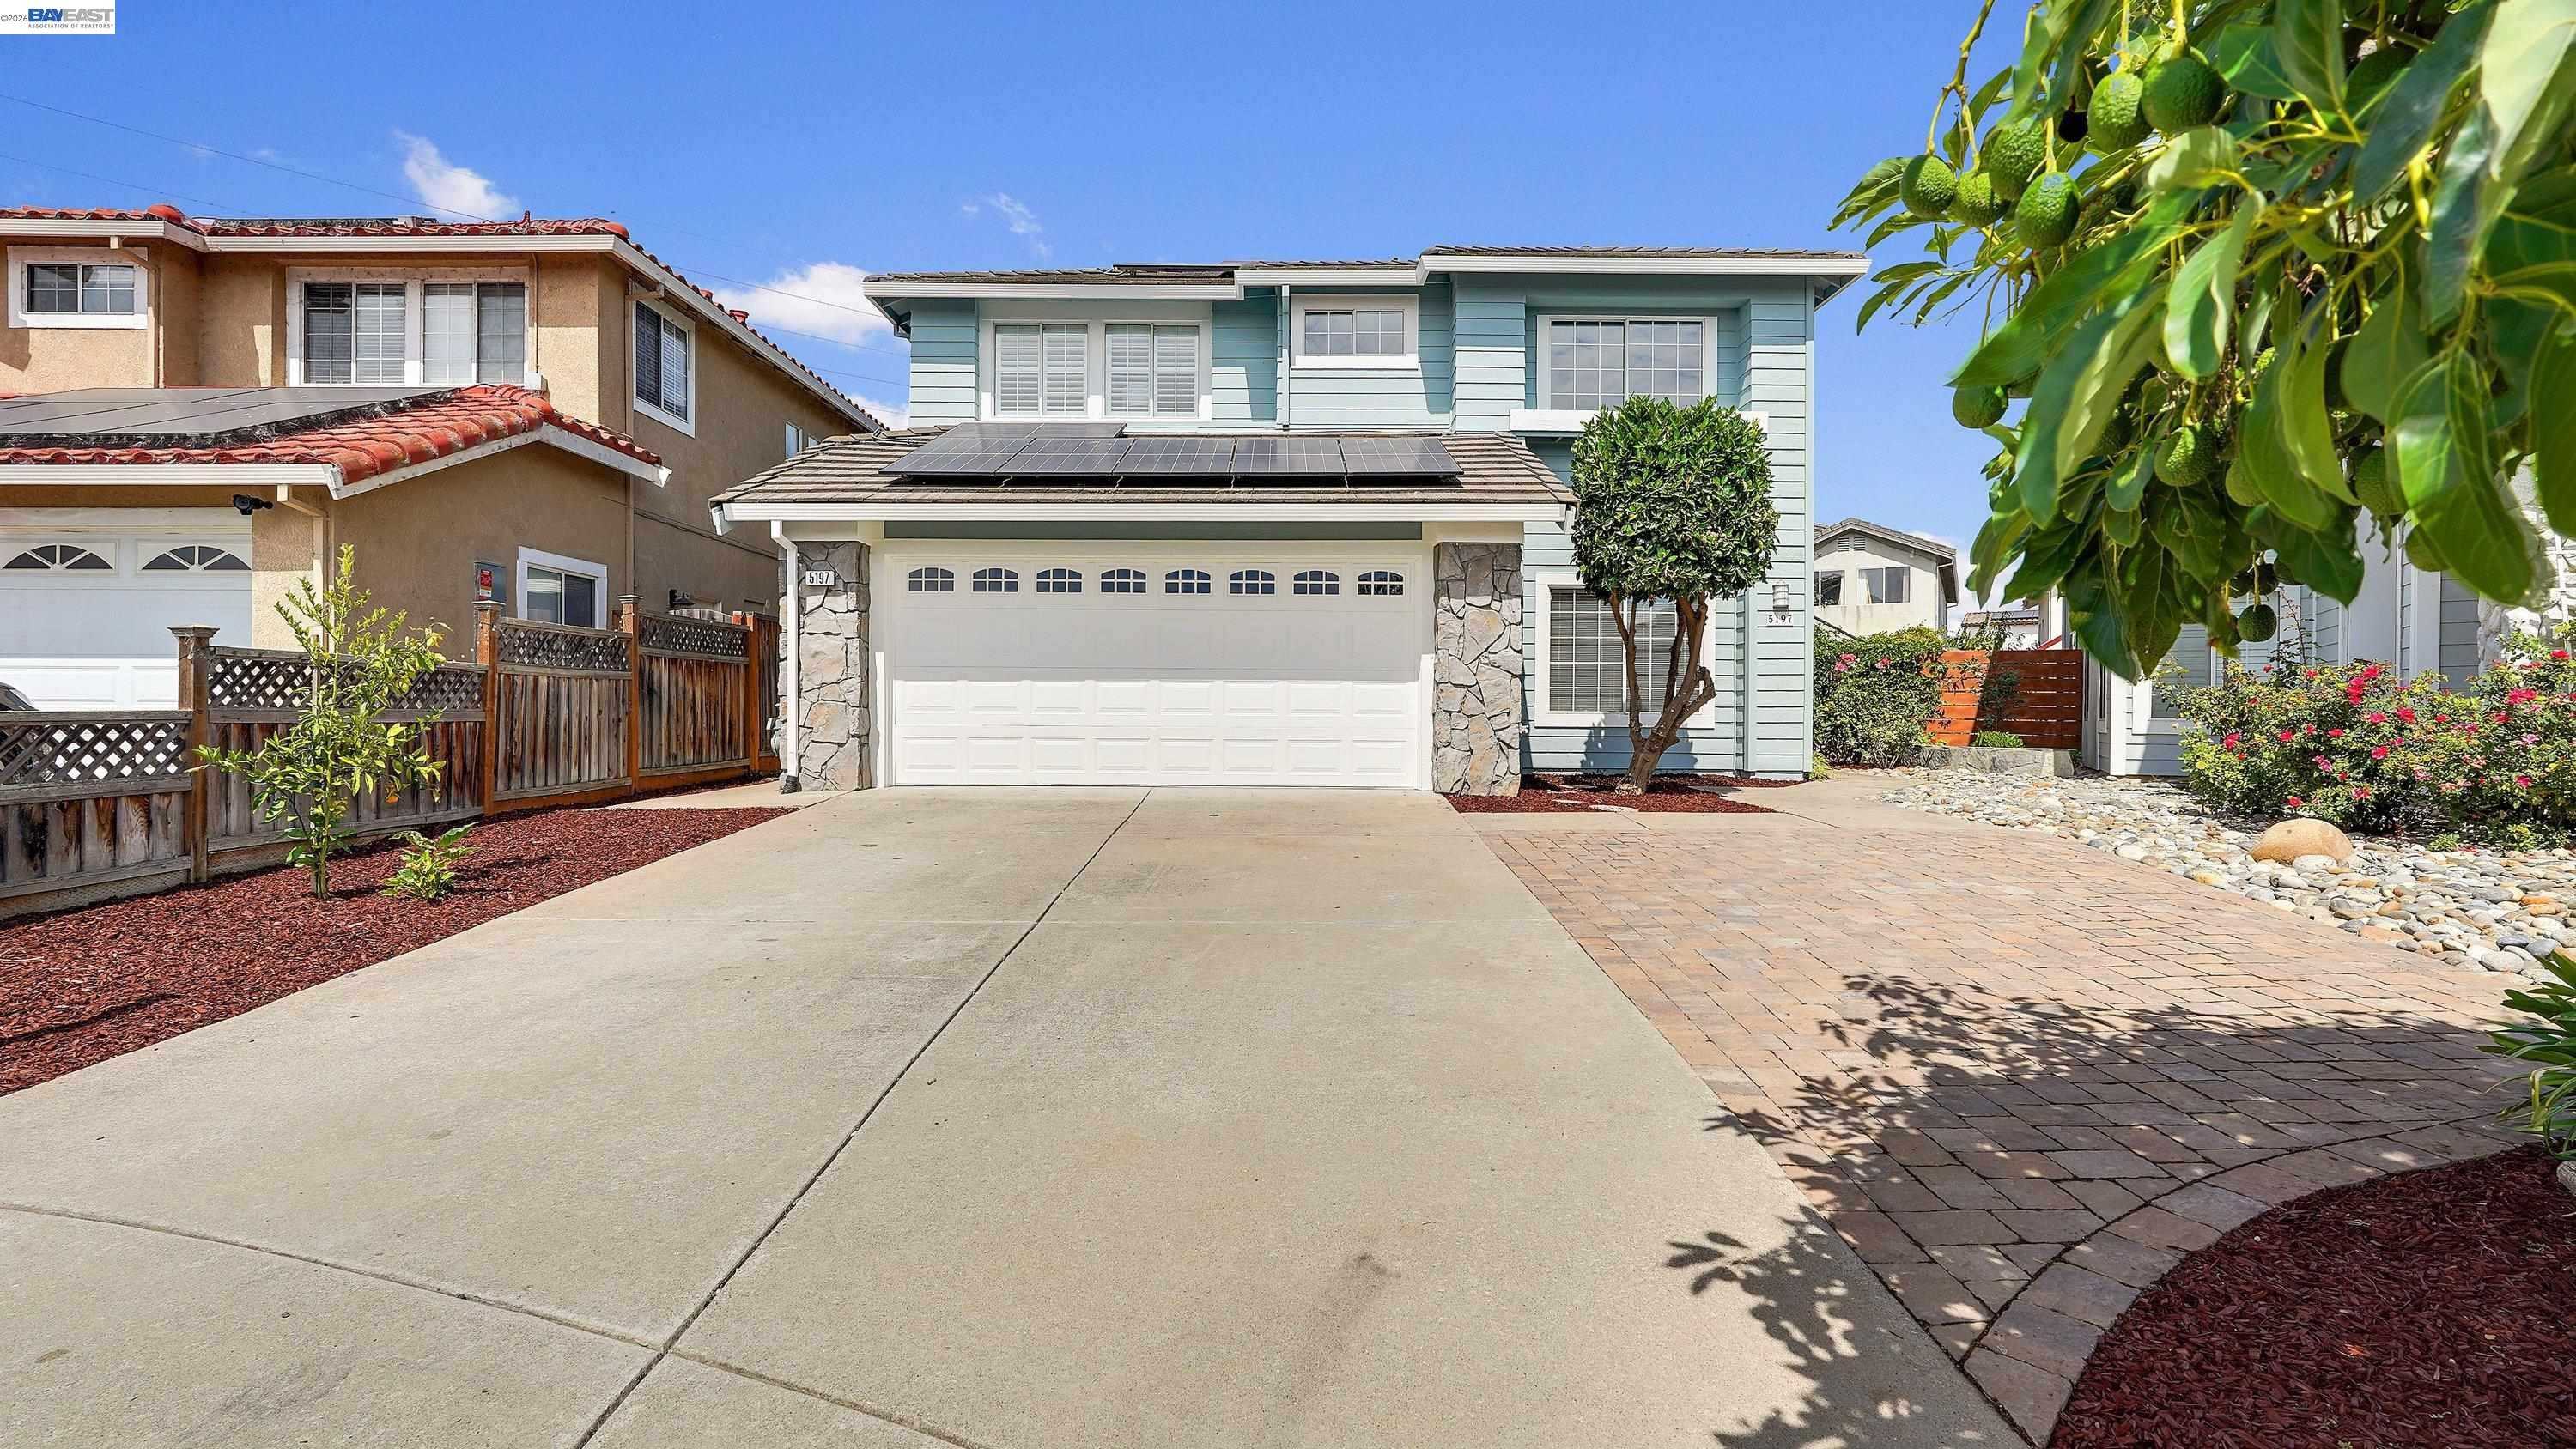
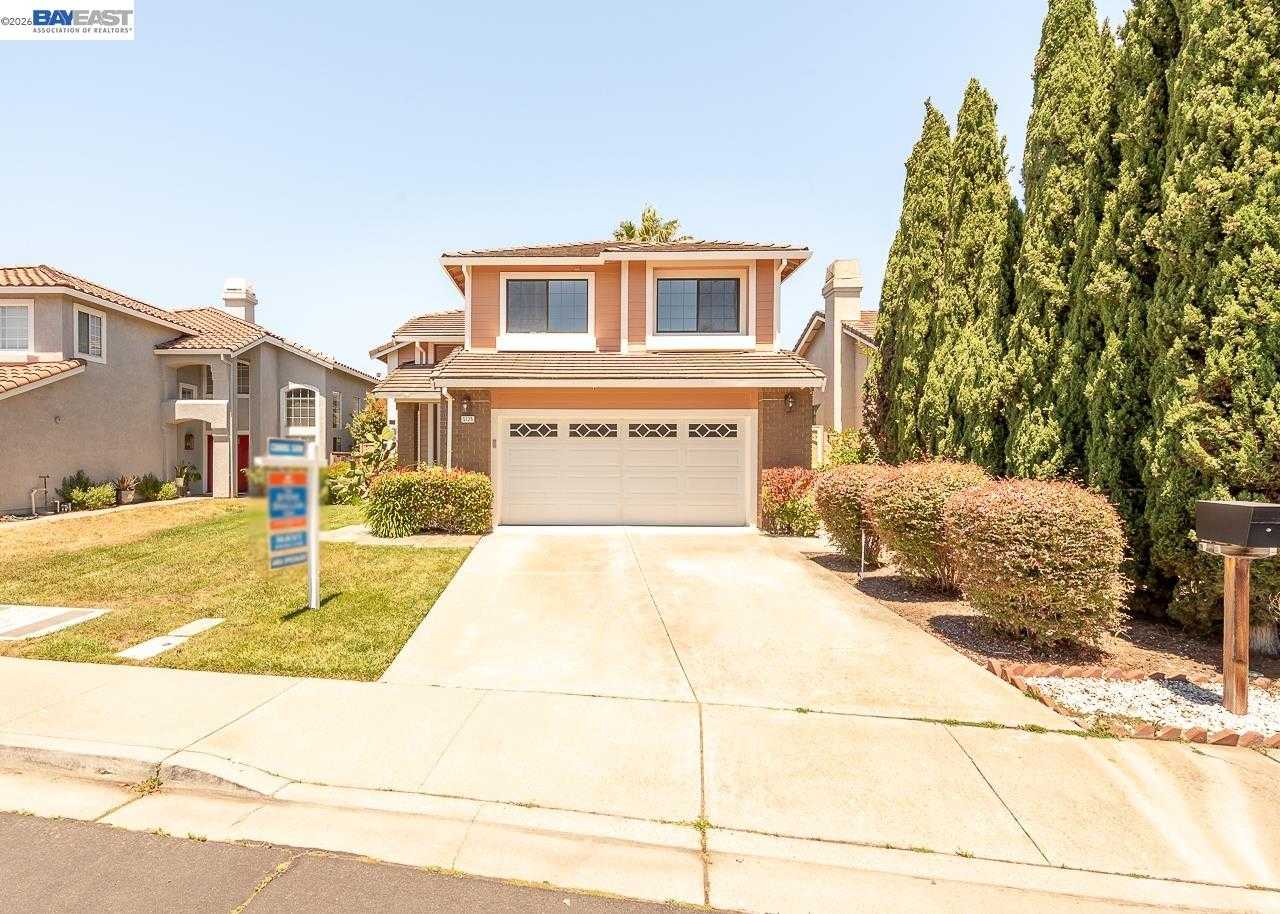
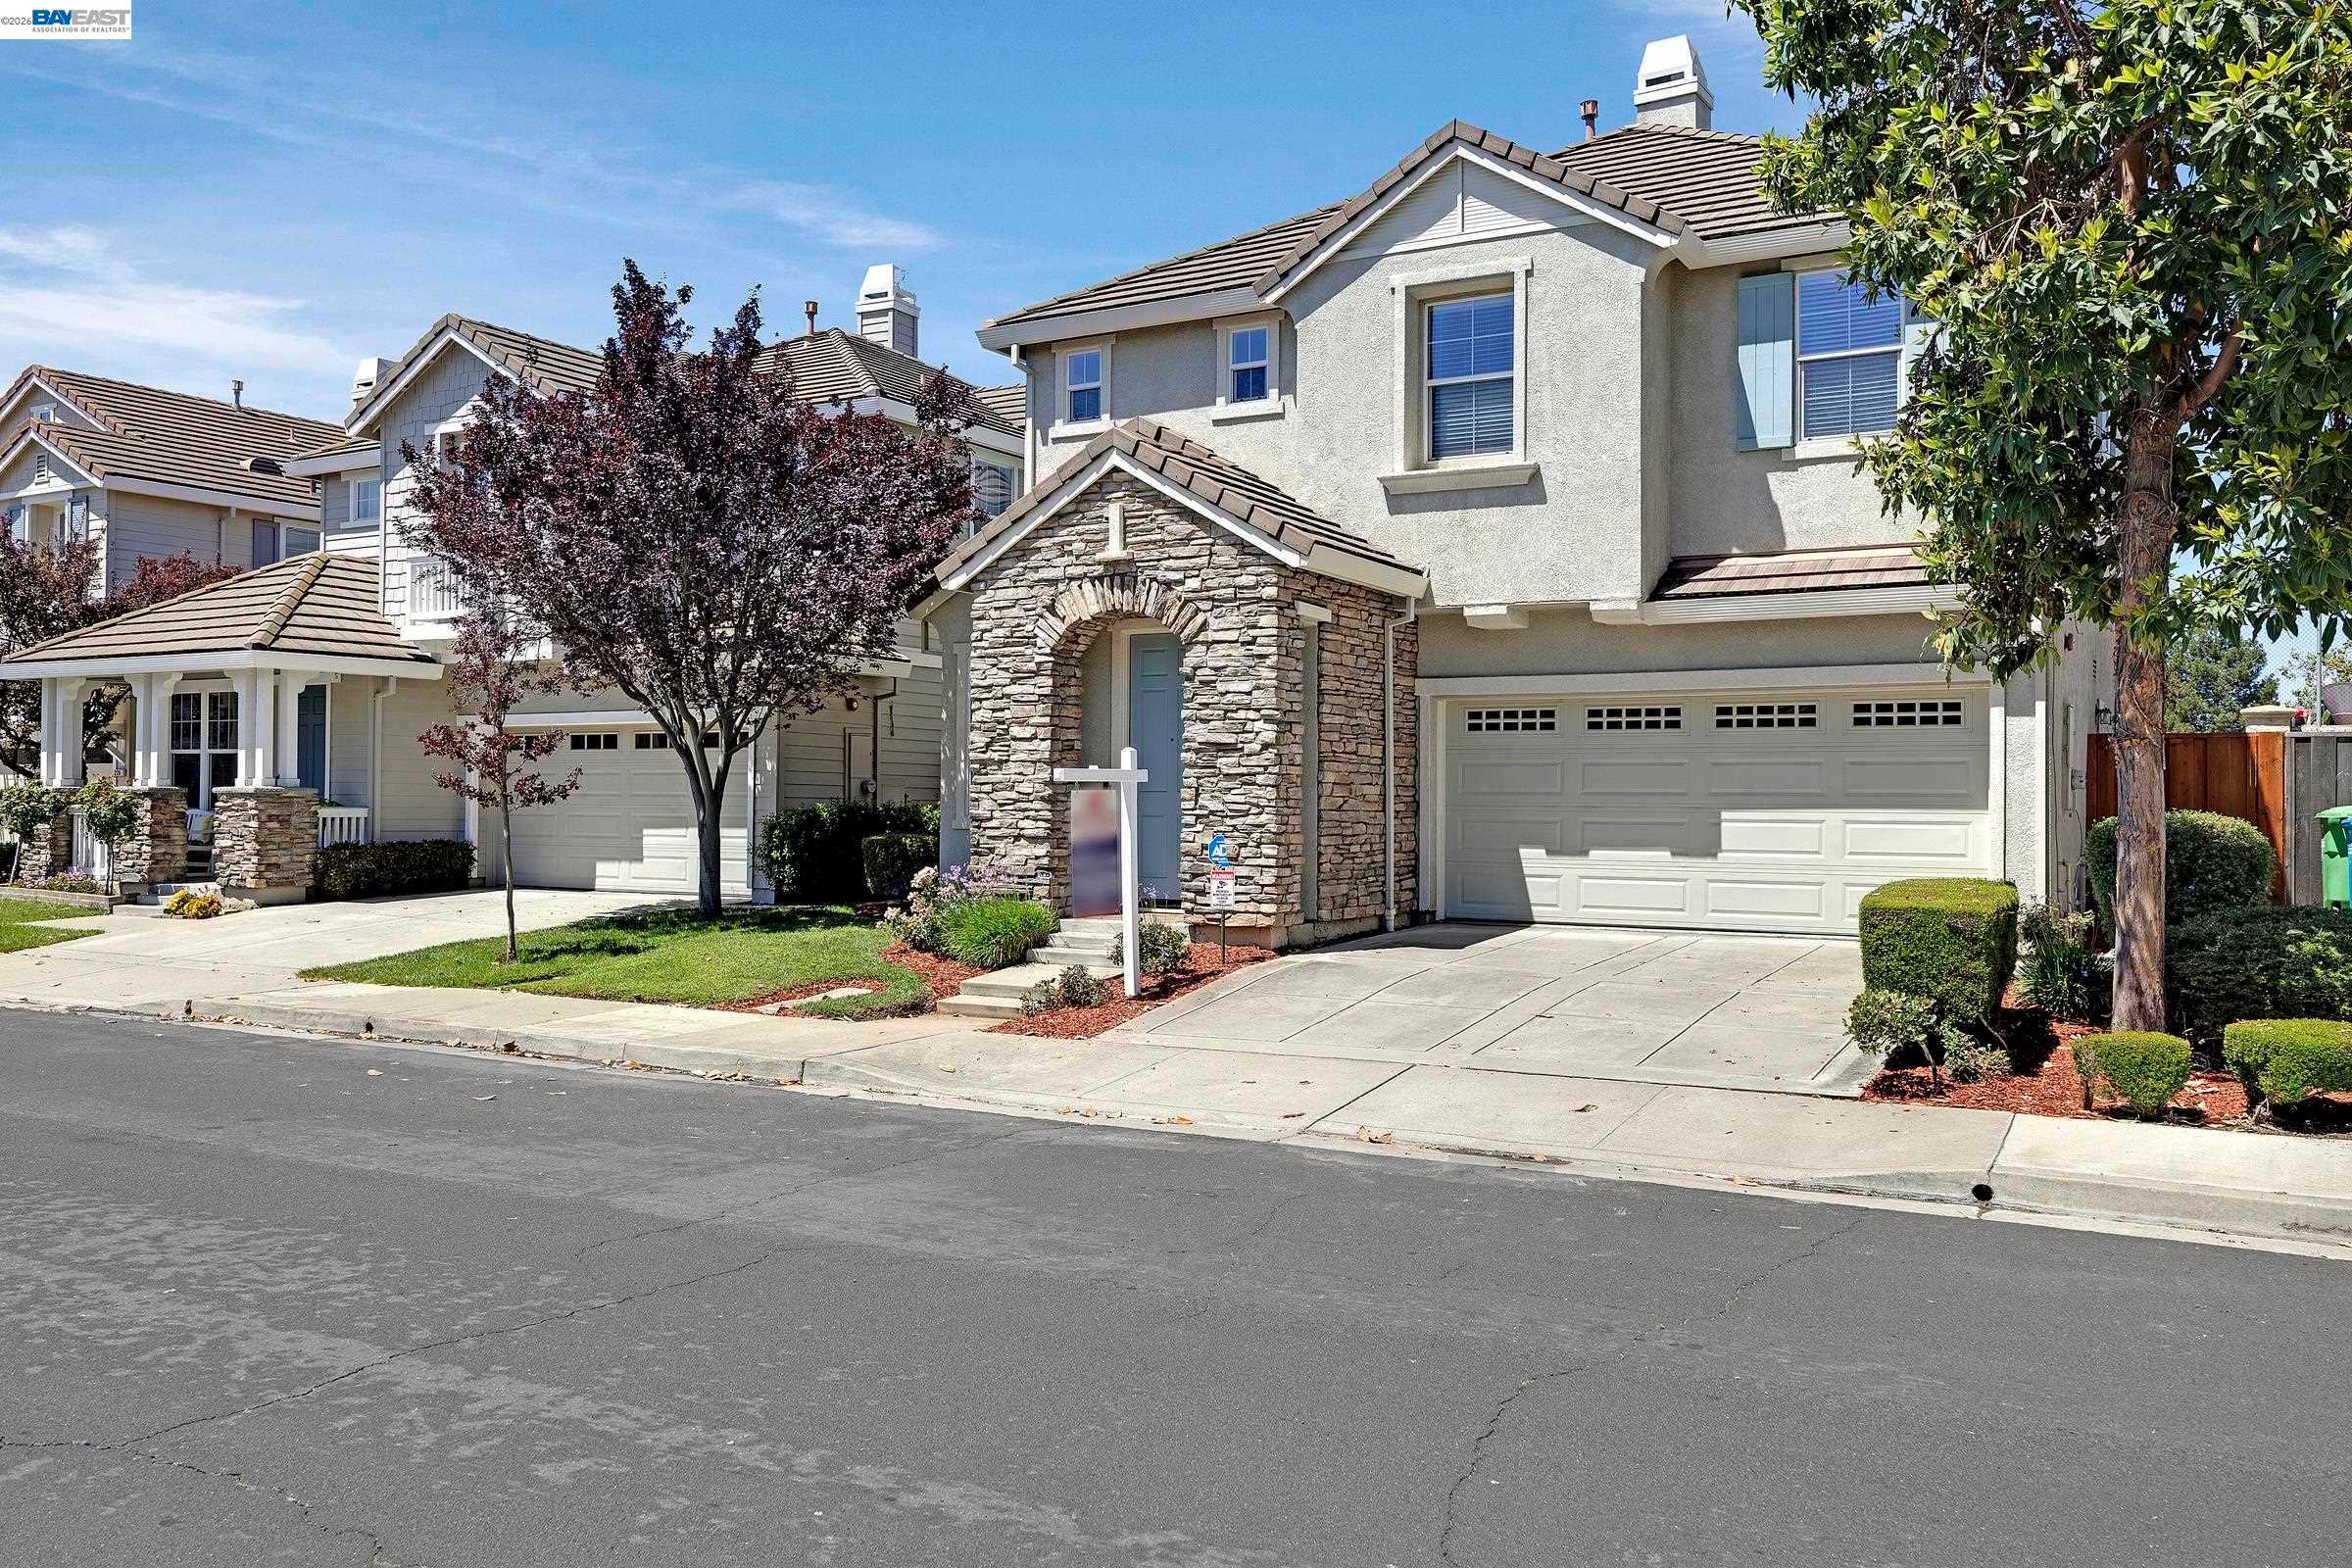
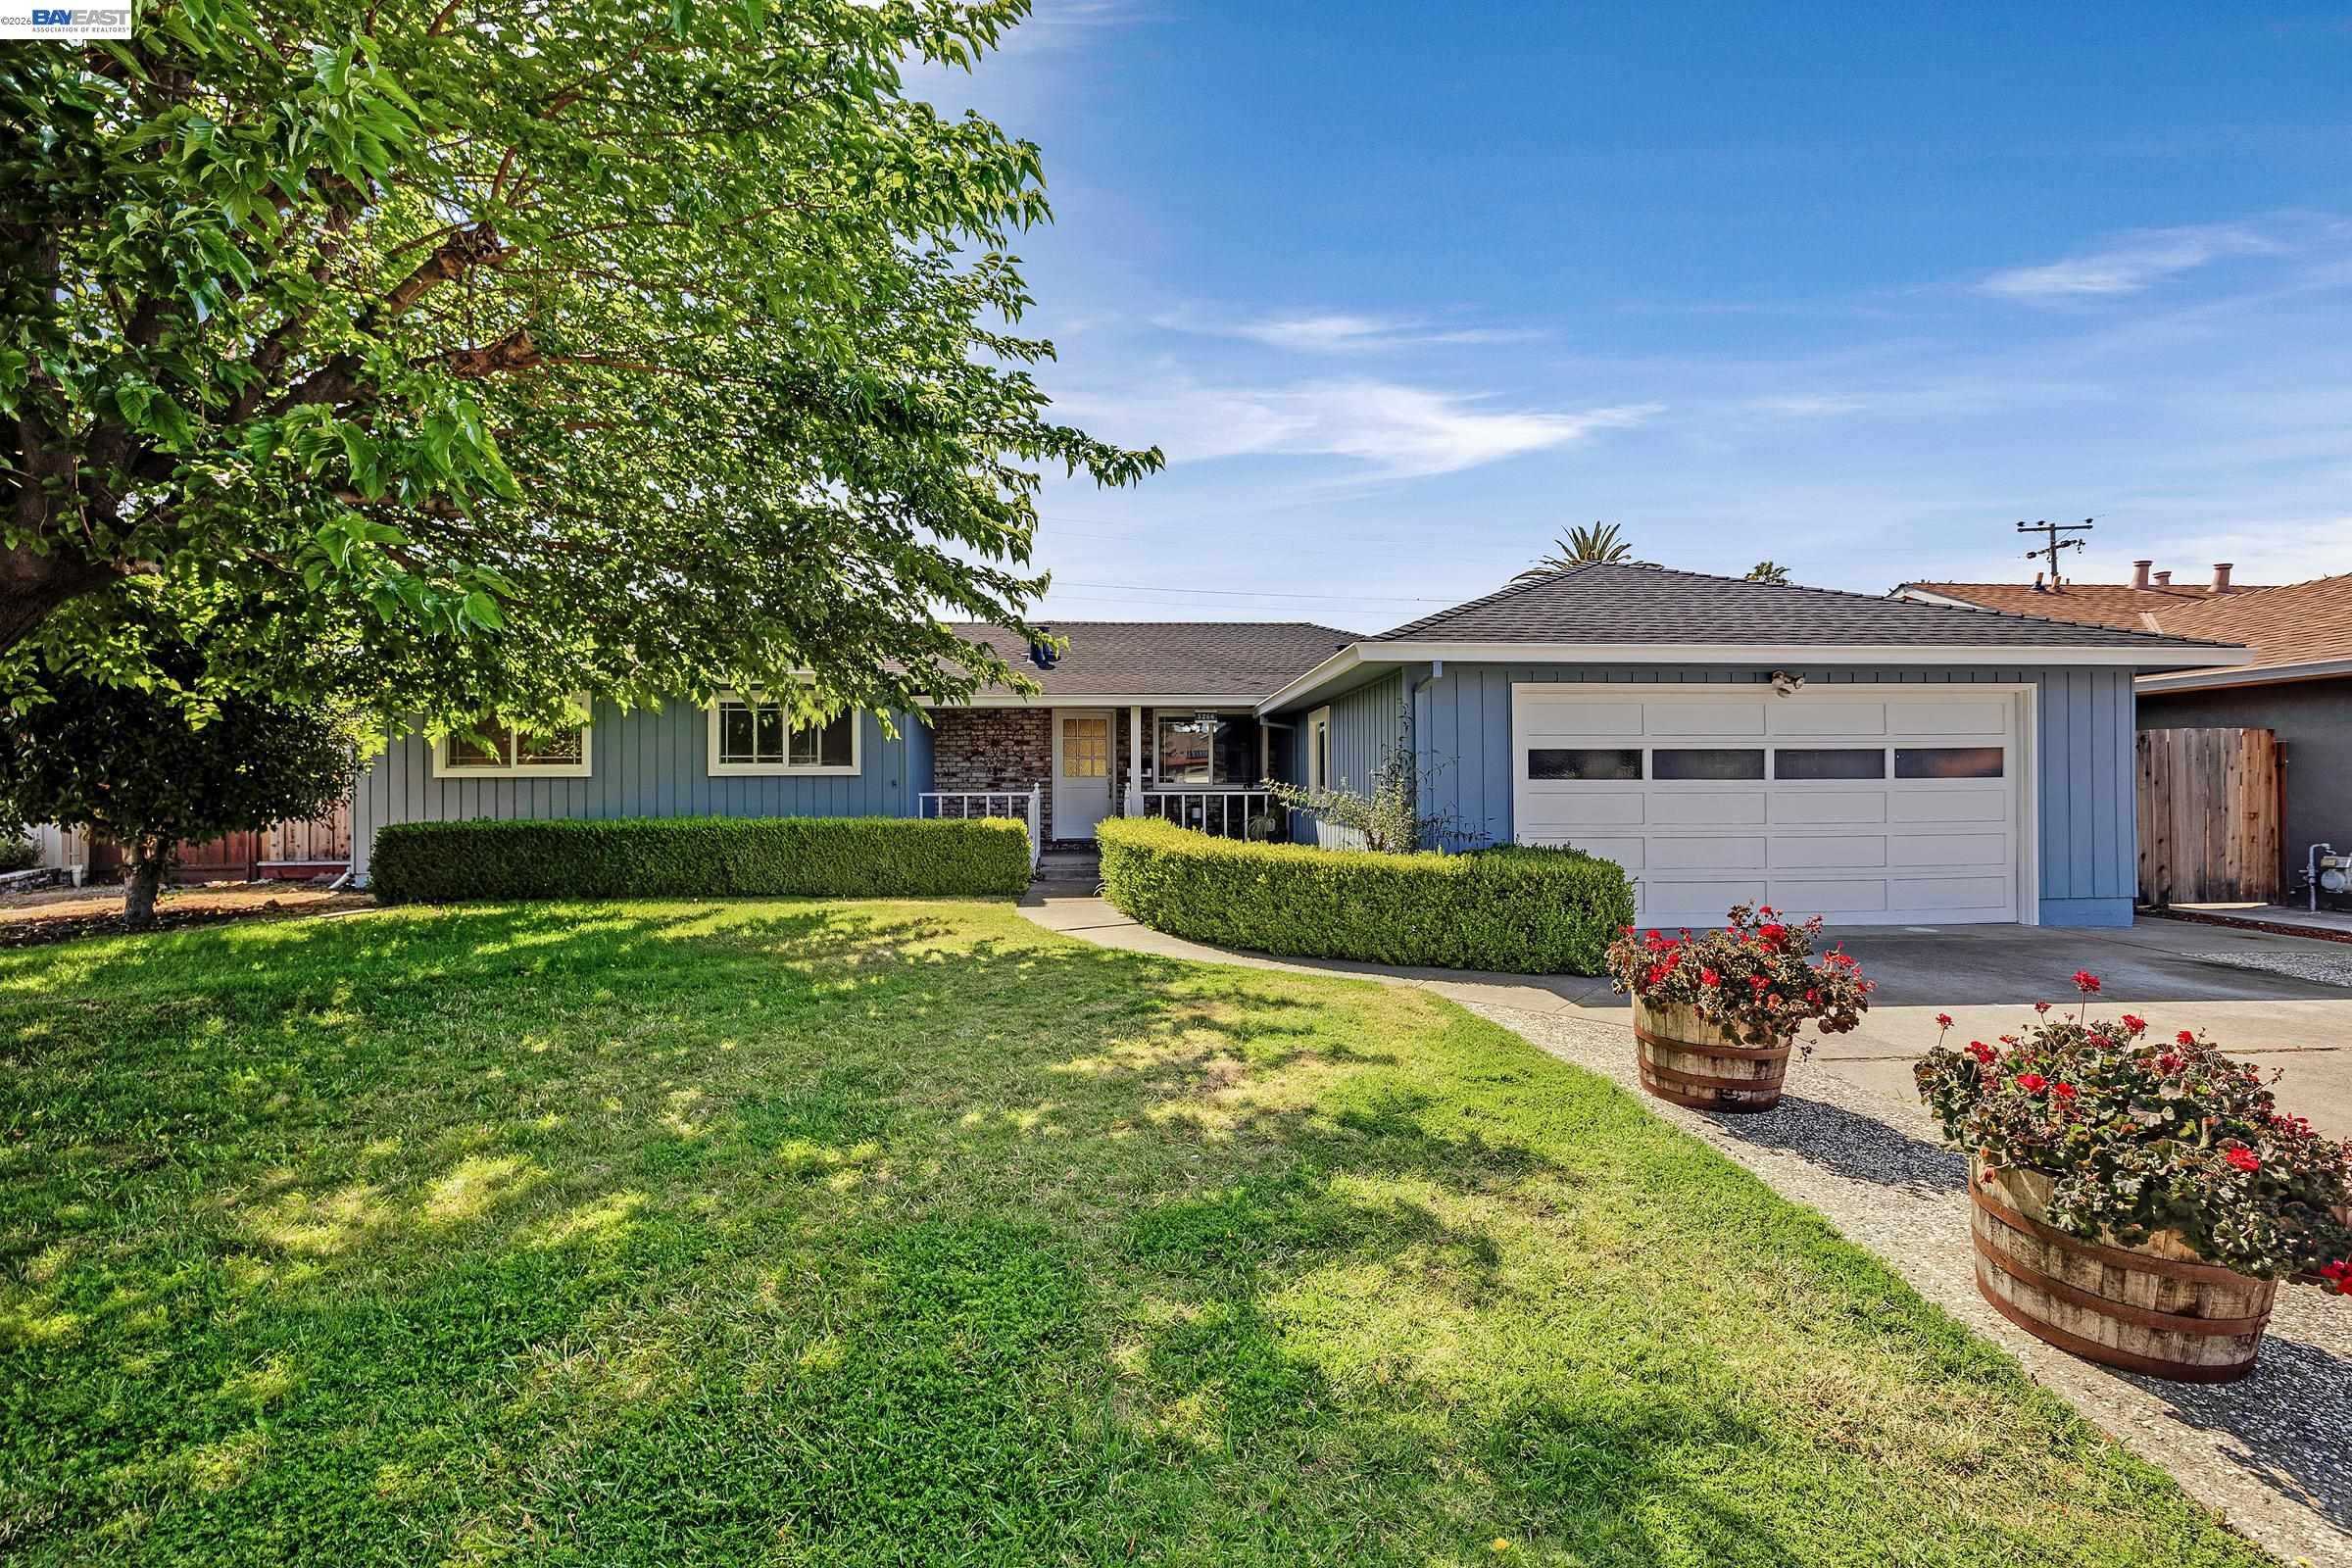
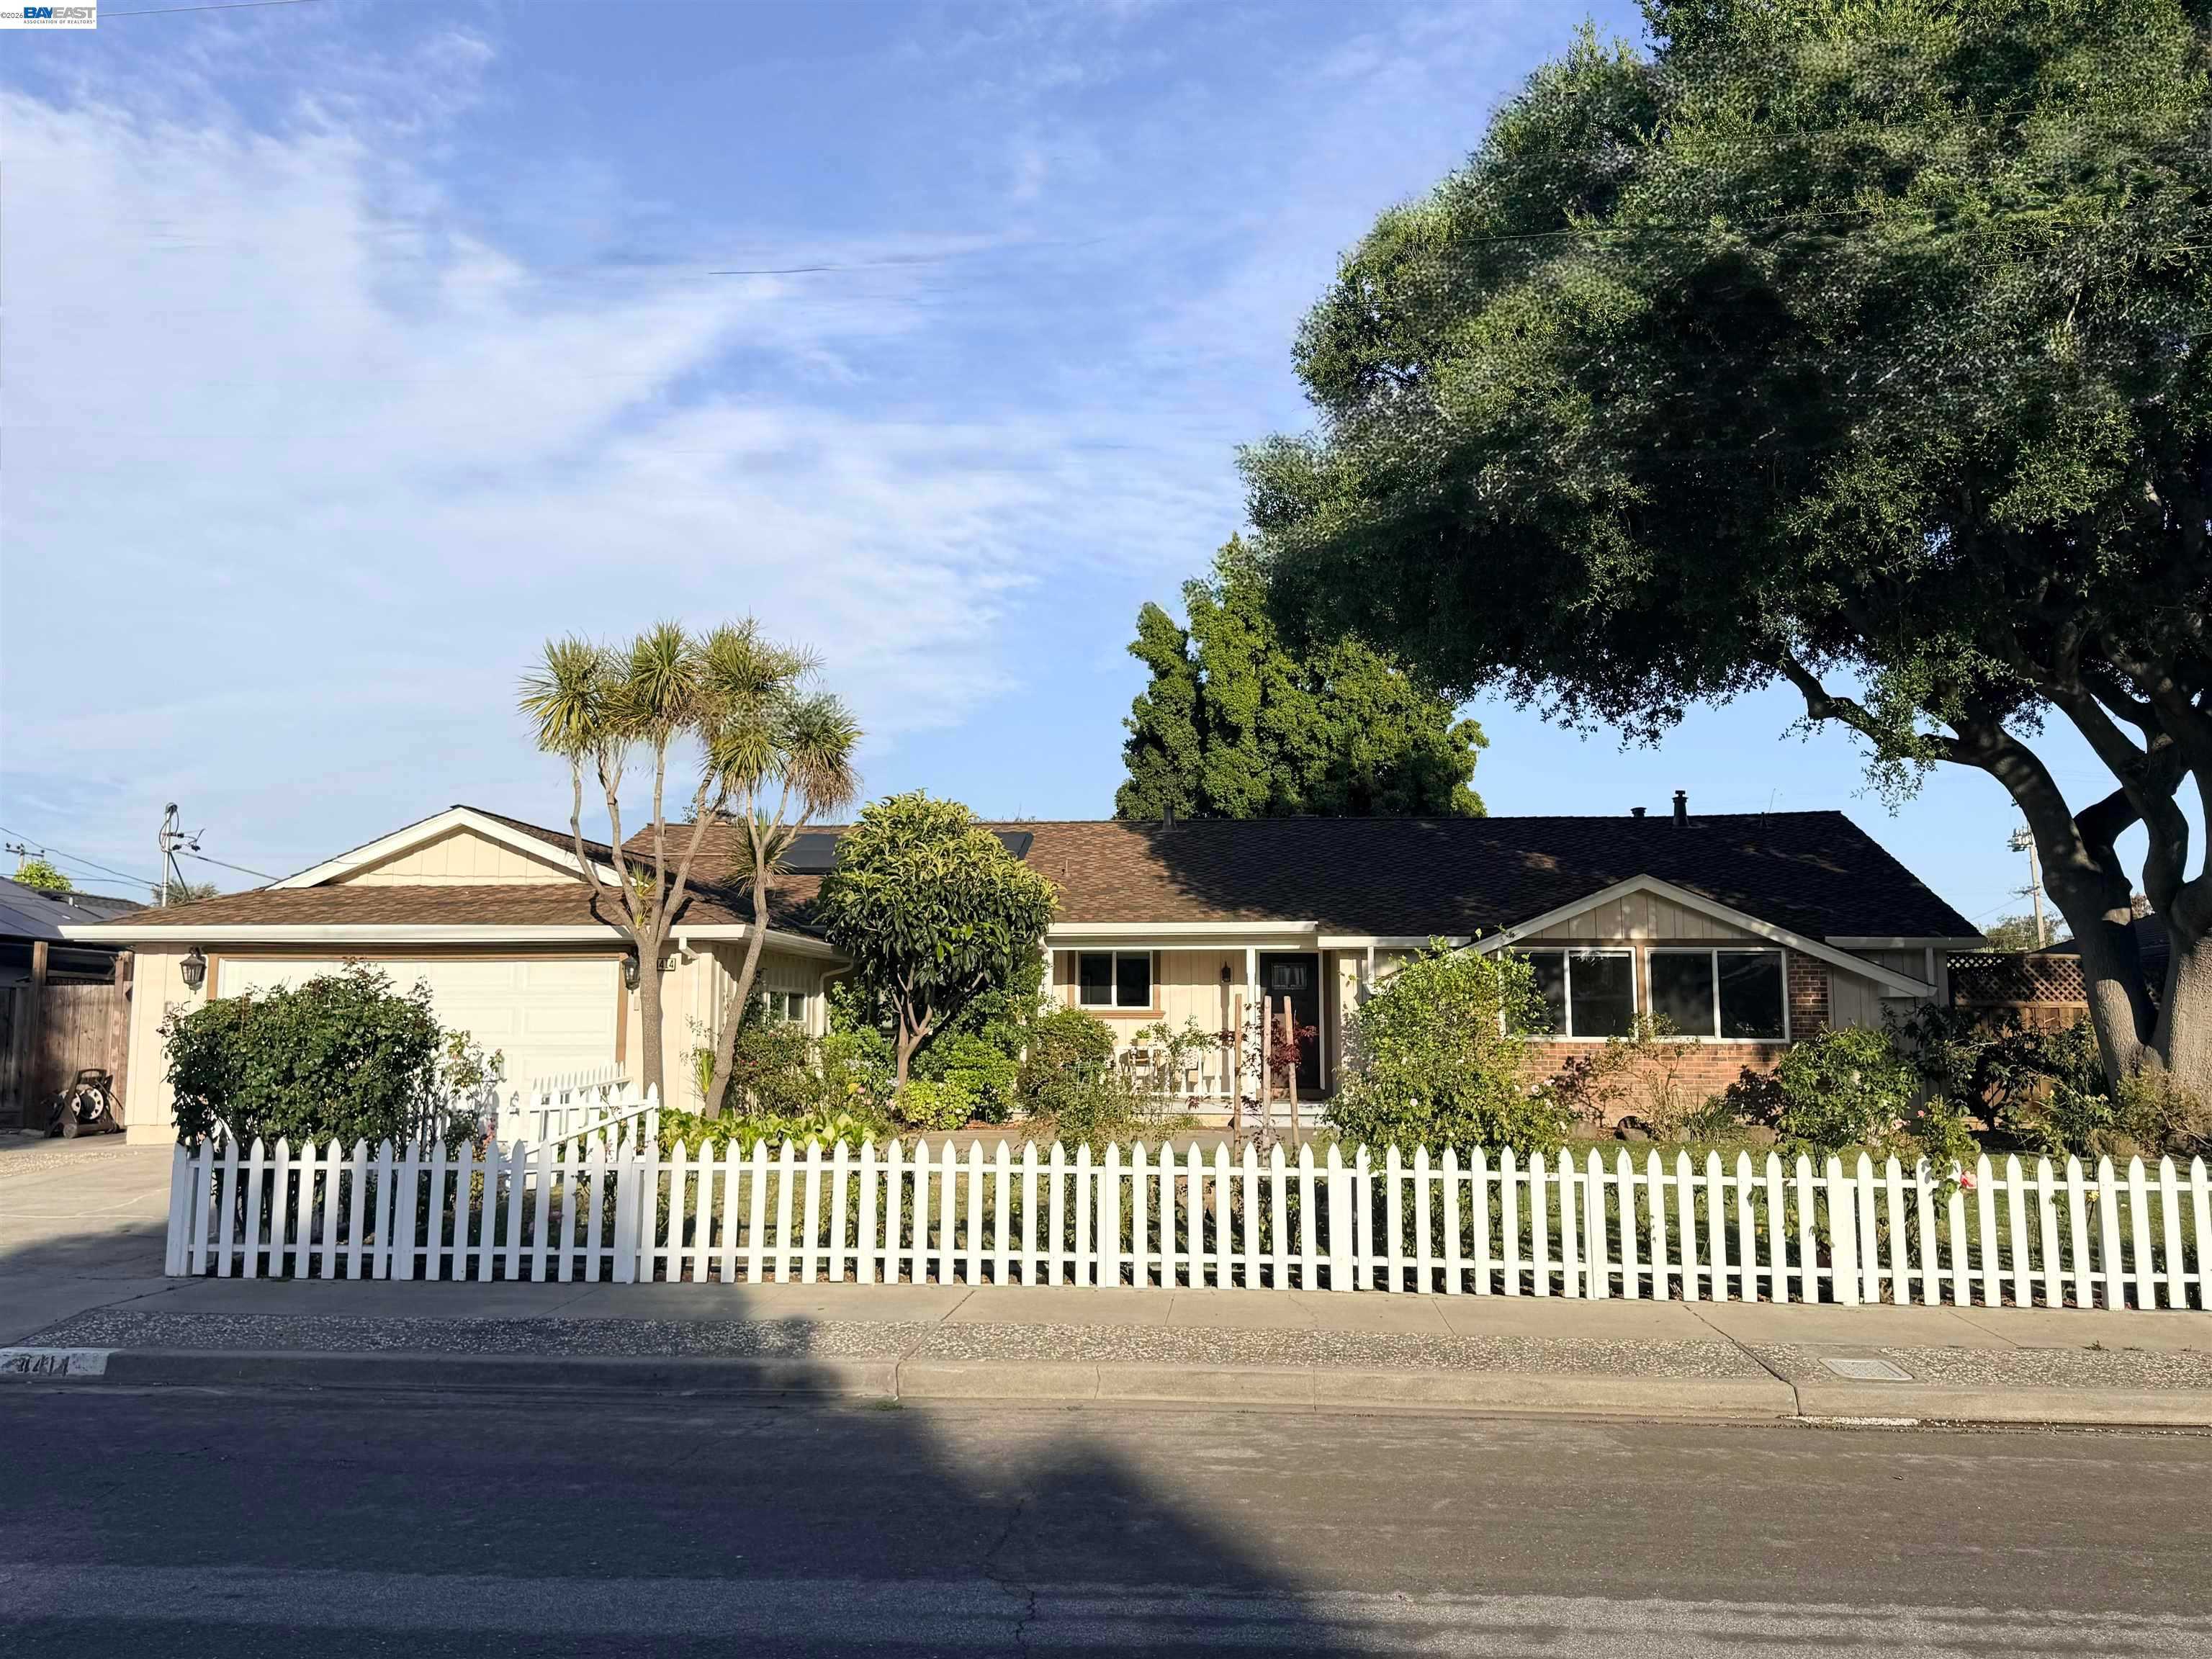
Behind these county totals: hundreds of homes still for sale in Fremont, Hayward, Union City, Newark and Milpitas, counted, priced and sorted every morning from the same MLS export, with a map search for the homes themselves.
30-Year Fixed: 7.33% +0.03 | 15-Year Fixed: 6.98% +0.02
Sellers are meeting today's rates partway. I compared our Sept. 24 and Oct. 24 MLS exports for Fremont, Hayward, Newark and Union City: 105 of the 308 homes on the market in both lowered their asking price in between, or 34.1%, and the typical cut was 3.8%. Newark sellers cut the most, 22 of 48; Hayward the least, 27 of 107.
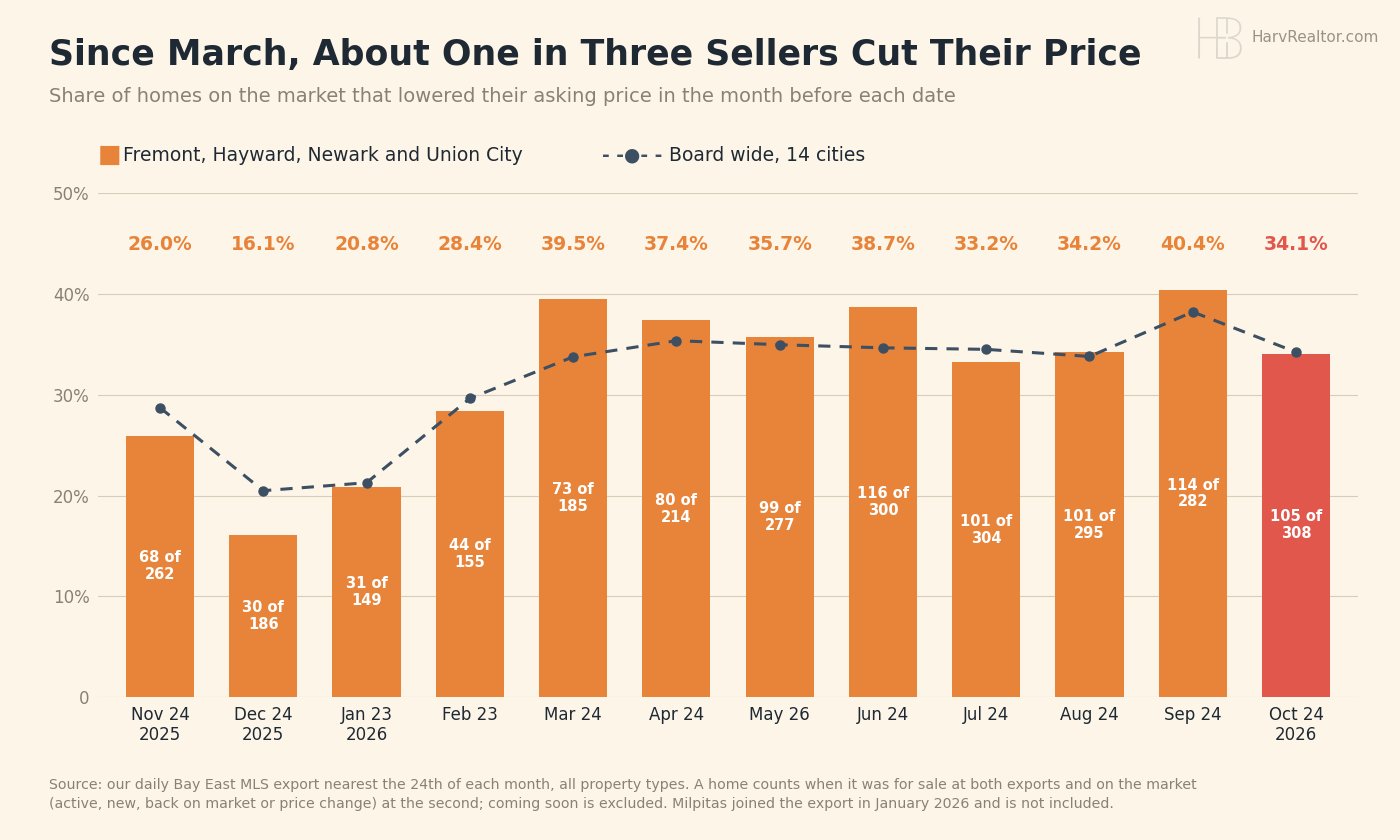
It is not a one month blip. In every month since March, between 33.2% and 40.4% of the listings in those four cities have cut, against 16% to 28% last fall and winter. Board wide, across 14 cities, it was 34.2% this month.
Rates held over the weekend. Mortgage News Daily's 30-year average ended the week at 7.33% and the 15-year at 6.98%, and Freddie Mac's weekly average was 7.32% Thursday. The Fed meets Tuesday and Wednesday, its first meeting since raising its rate in September.
What it means for you. A typical cut is worth real money. On our five city median of $1,075,000 with 20% down, a 3.8% cut takes about $40,850 off the price and about $225 off the monthly principal and interest at 7.33%, roughly what a rate near 6.94% would do. If you are buying, ask about price before you shop for a lower rate. If you are selling, a third of your competition has already cut, so price for today's payment from day one.
Today's count. Inventory held steady. Board wide: 2,640 listings across the 15 city table, counting active and in contract together, up from 2,636, with 133 coming soon and 205 brand new. The five city ledger carries 688 live listings across Fremont, Hayward, Milpitas, Newark and Union City, 618 on the market and 70 coming soon, up from 684.
Fremont holds 230 live listings: 182 active, 29 coming soon, 18 brand new and 1 back on market, with a median on market list price of $1,300,000 at $796 a square foot and a typical listing out 36 days. Hayward carries 198 (from 194), Milpitas 102 (from 95), Newark 91 (from 92) and Union City 67 (from 68). Across all five cities the median is $1,075,000 at $666 a square foot, 291 homes are priced under a million, and 176 have been sitting 60 days or longer.
S&P 500: 7,623.68 -0.52% | Dow: 52,215.16 -1.23% | Nasdaq: 25,955.34 -0.21%
Oil set the tone Friday. The Dow fell 652.82 points, or 1.23%, as Brent climbed, while the S&P 500 slipped 0.52% and the Nasdaq 0.21% after Thursday's tech selloff. For the week, the S&P 500 fell 0.47%, the Nasdaq 0.71%, and the Dow rose 0.41%.
A good quarter, a bad day. American Express fell 3.68% even after record third quarter revenue of $20.1 billion, up 9%, adjusted earnings of $4.68 a share, up 13%, and a raised full year forecast; the quarter carried a $336 million restructuring charge. Next week brings the Fed and more big tech earnings, so enjoy the intermission.
10-Year Treasury: 5.00% +0.04 | Gold: $4,007.90 -1.29% | Silver: $53.95 -1.92% | Brent Crude: $116.72 +3.14%
Oil kept climbing. Brent settled up 3.14% at $116.72 Friday on renewed Middle East tensions, its highest settlement since April 29, and gained 6.2% for the week from $109.86. The numbers above are Friday's Treasury close and COMEX and ICE December settlements.
Bonds gave a little back. The 10-Year closed at 5.00%, up 0.04 point on the day but down 0.09 for the week. Gold settled down 1.29% at $4,007.90 and silver down 1.92% at $53.95, leaving gold $7.90 above $4,000, close enough that traders will be watching it Monday.
Bitcoin: $80,472 -1.07% | Ethereum: $2,342.62 -2.24% | XRP: $1.29 -1.13%
Crypto slipped into the weekend. Bitcoin is down 1.07% over 24 hours near $80,500, Ether is down 2.24% and XRP is down 1.13%, live from CoinGecko at 1:31 PM PT. Bitcoin is holding above $80,000, which these days passes for a quiet Saturday.
Sources
- Bay East MLS daily exports nearest the 24th of each month, October 24, 2025 to October 24, 2026 (price cut count)
- Mortgage News Daily (30 year and 15 year index, October 23)
- Freddie Mac (Primary Mortgage Market Survey, October 22)
- Federal Reserve (FOMC meeting calendar)
- American Express Form 8-K (third quarter 2026 results)
- U.S. Treasury (10-Year daily yield curve, October 23)
- CNBC (COMEX and ICE December settlements, October 23)
- Yahoo Finance (index closes and Brent front month history, October 23)
- CoinGecko (live crypto, 1:31 PM PT October 24)
- Bay East MLS daily export, October 24, 2026
- REALTY EXPERTS® Live Inventory (five city ledger, October 24)
Disclaimer: The market data, rates, and information provided are for informational purposes only and should not be considered financial advice. Always verify rates and data with your lender or financial advisor before making any decisions.
Based on information from the Bay East Association of REALTORS® (Bay East MLS) as of October 24, 2026. All data, including all measurements and calculations of area, is obtained from various sources and has not been, and will not be, verified by broker or MLS. All information should be independently reviewed and verified for accuracy. Properties may or may not be listed by the office/agent presenting the information.