



"At a Glance" Local Housing STATS and News 10/18/26
October 18, 2026 · Alameda County Market Dashboard
TODAY'S LIVE INVENTORY
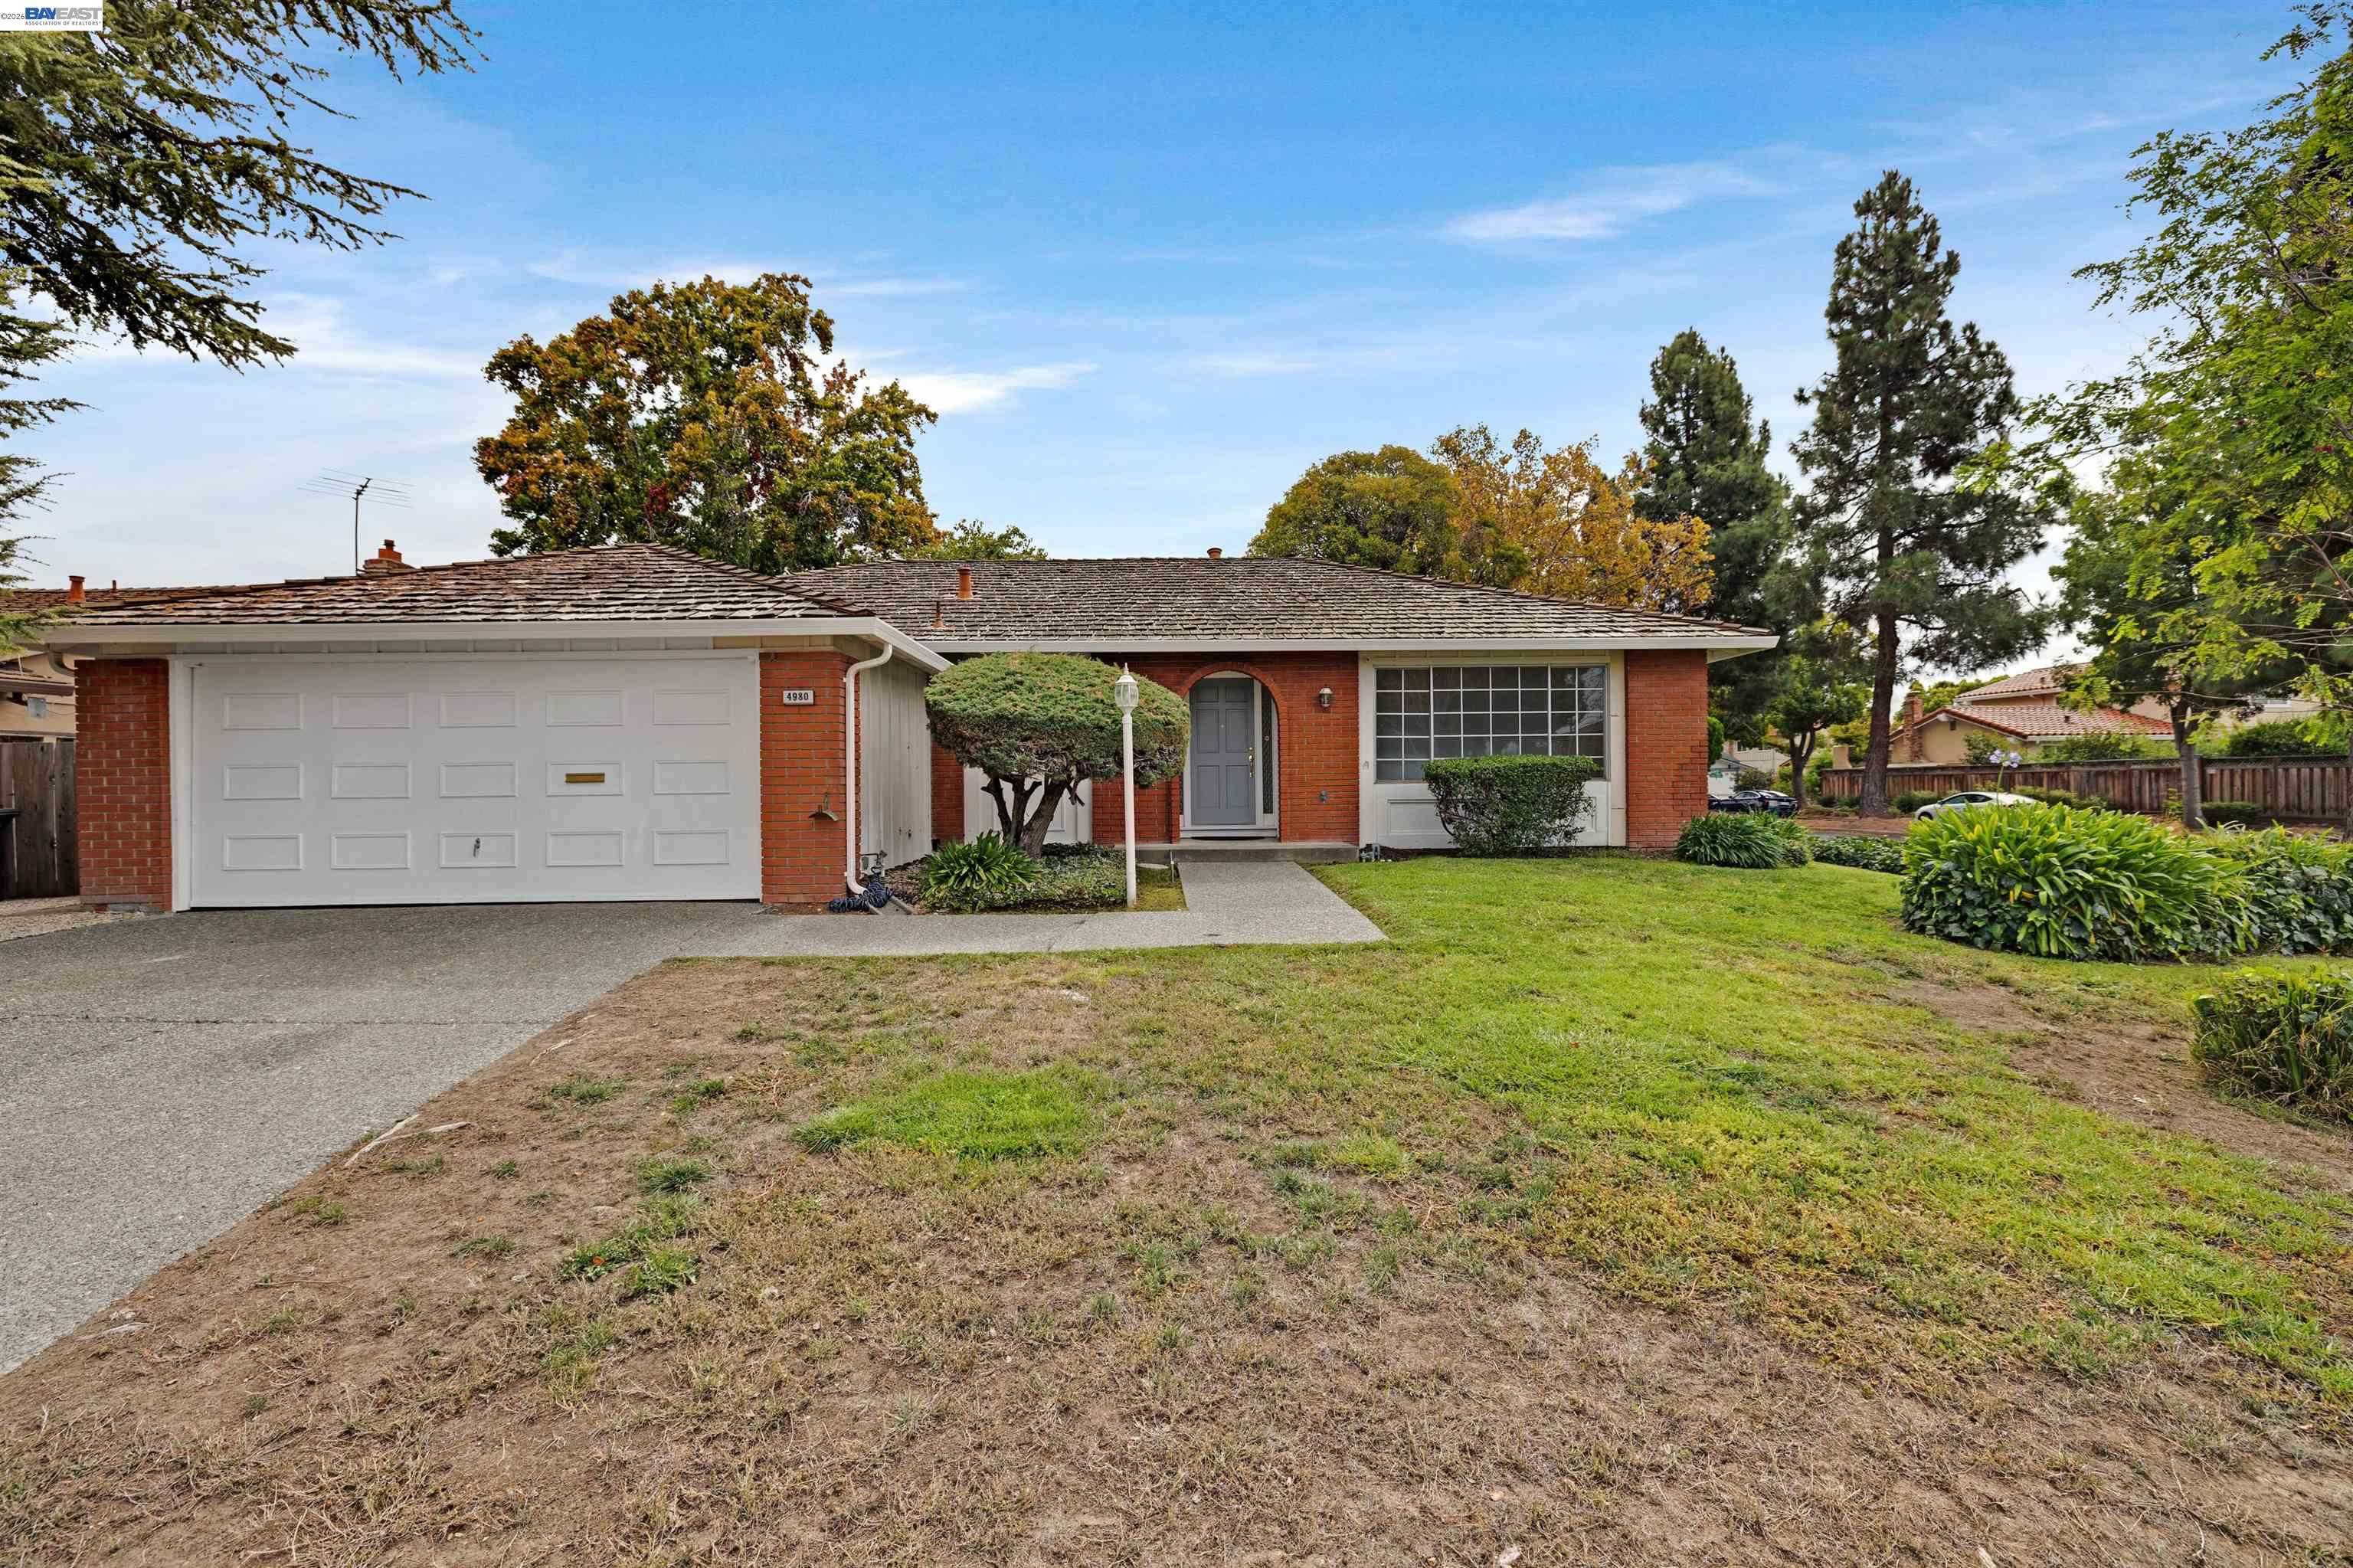
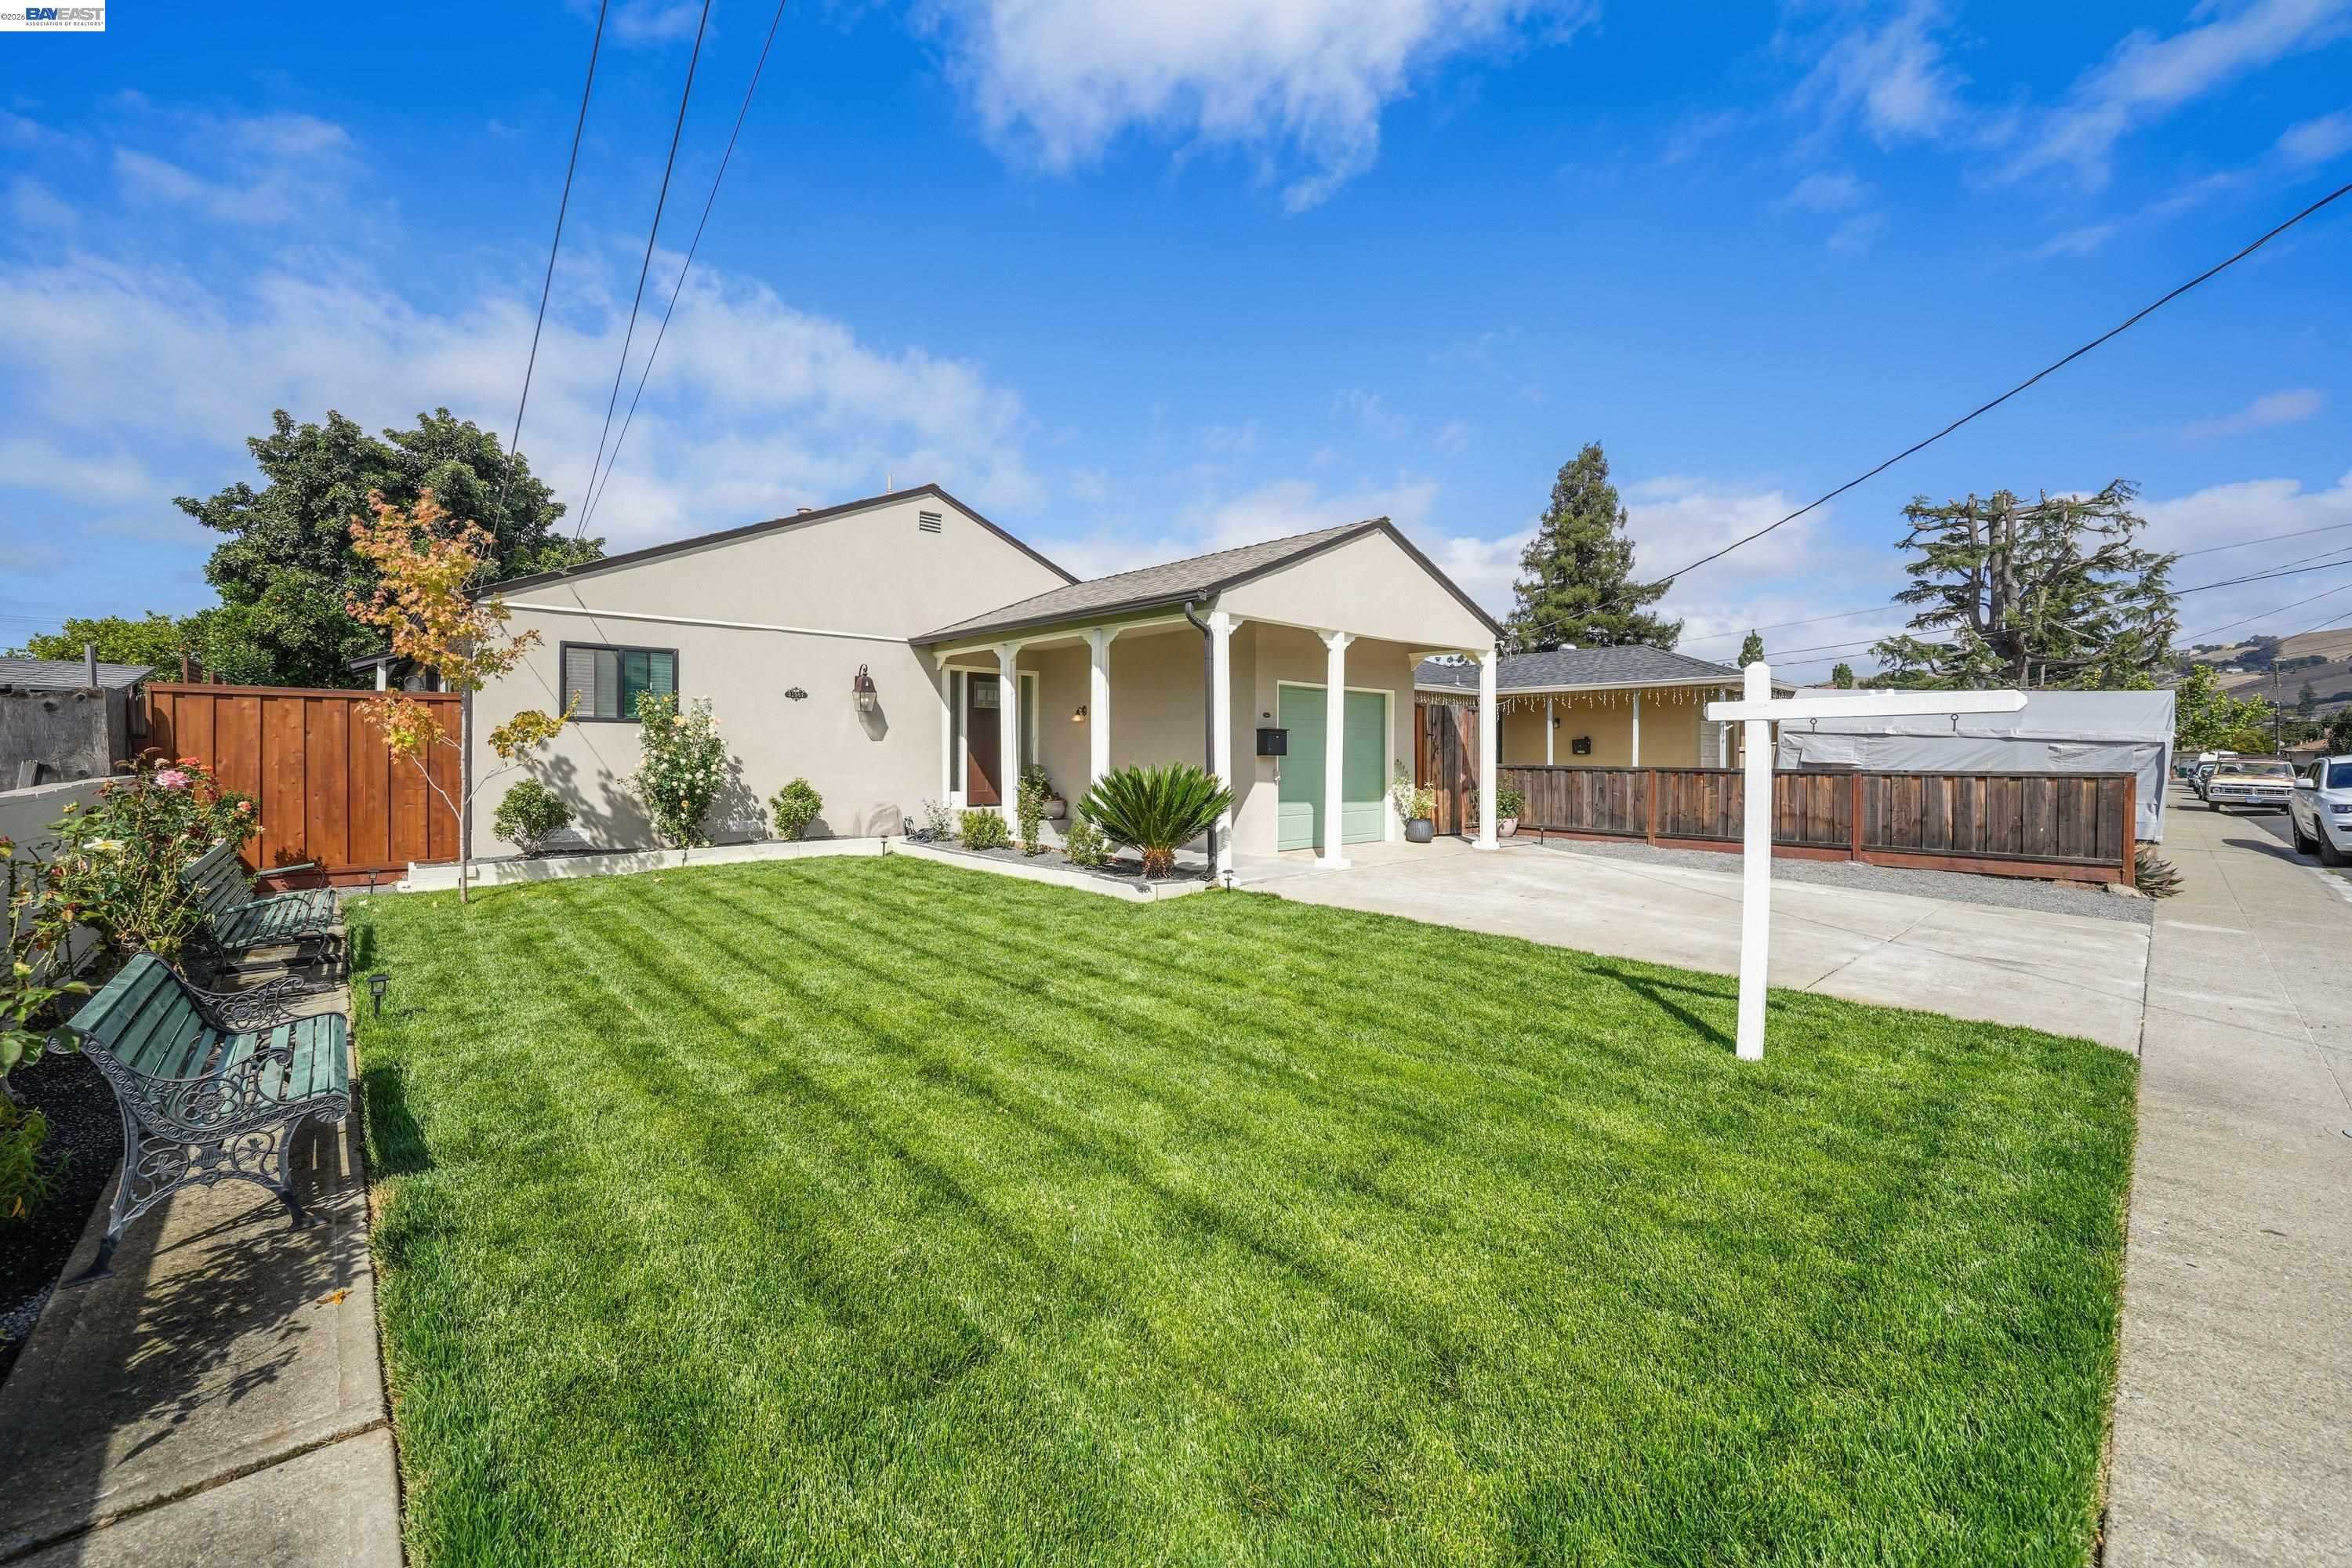
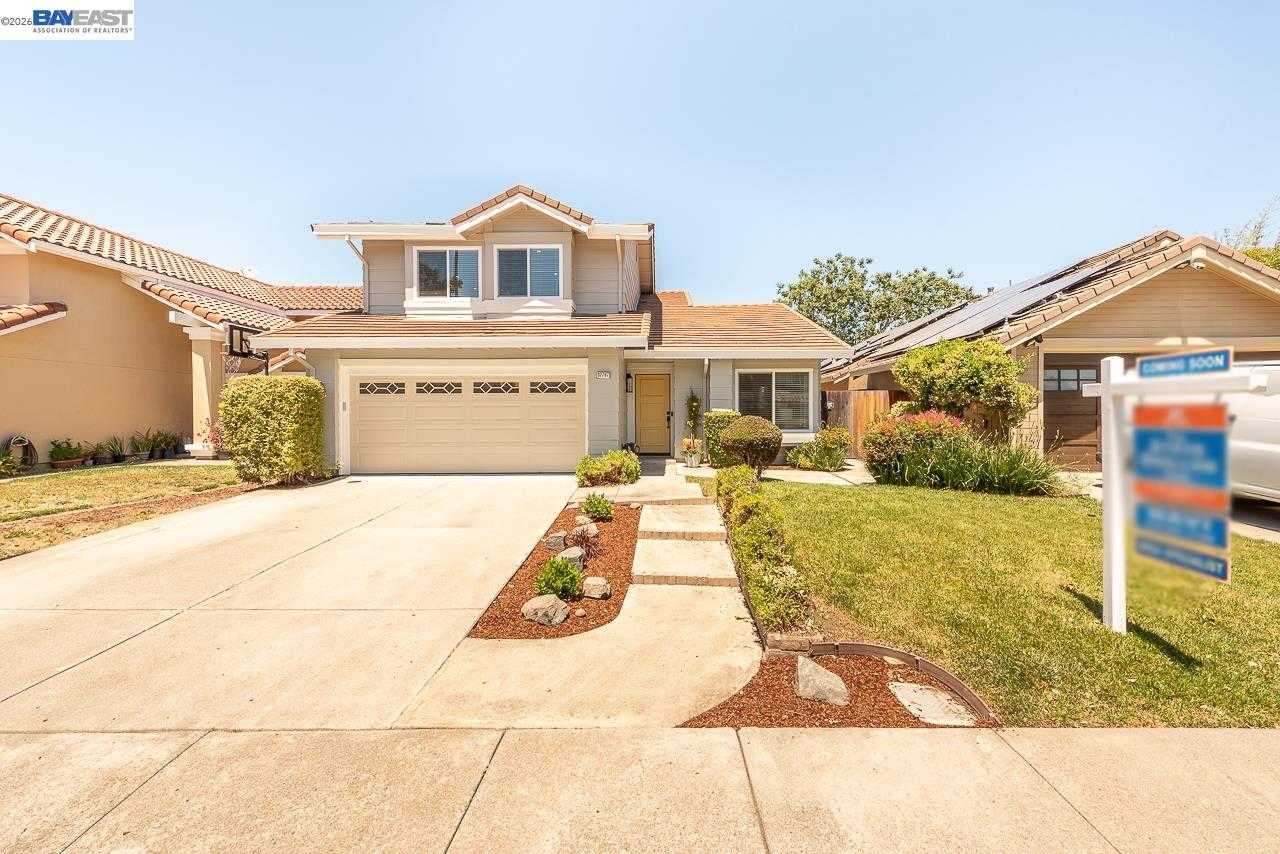
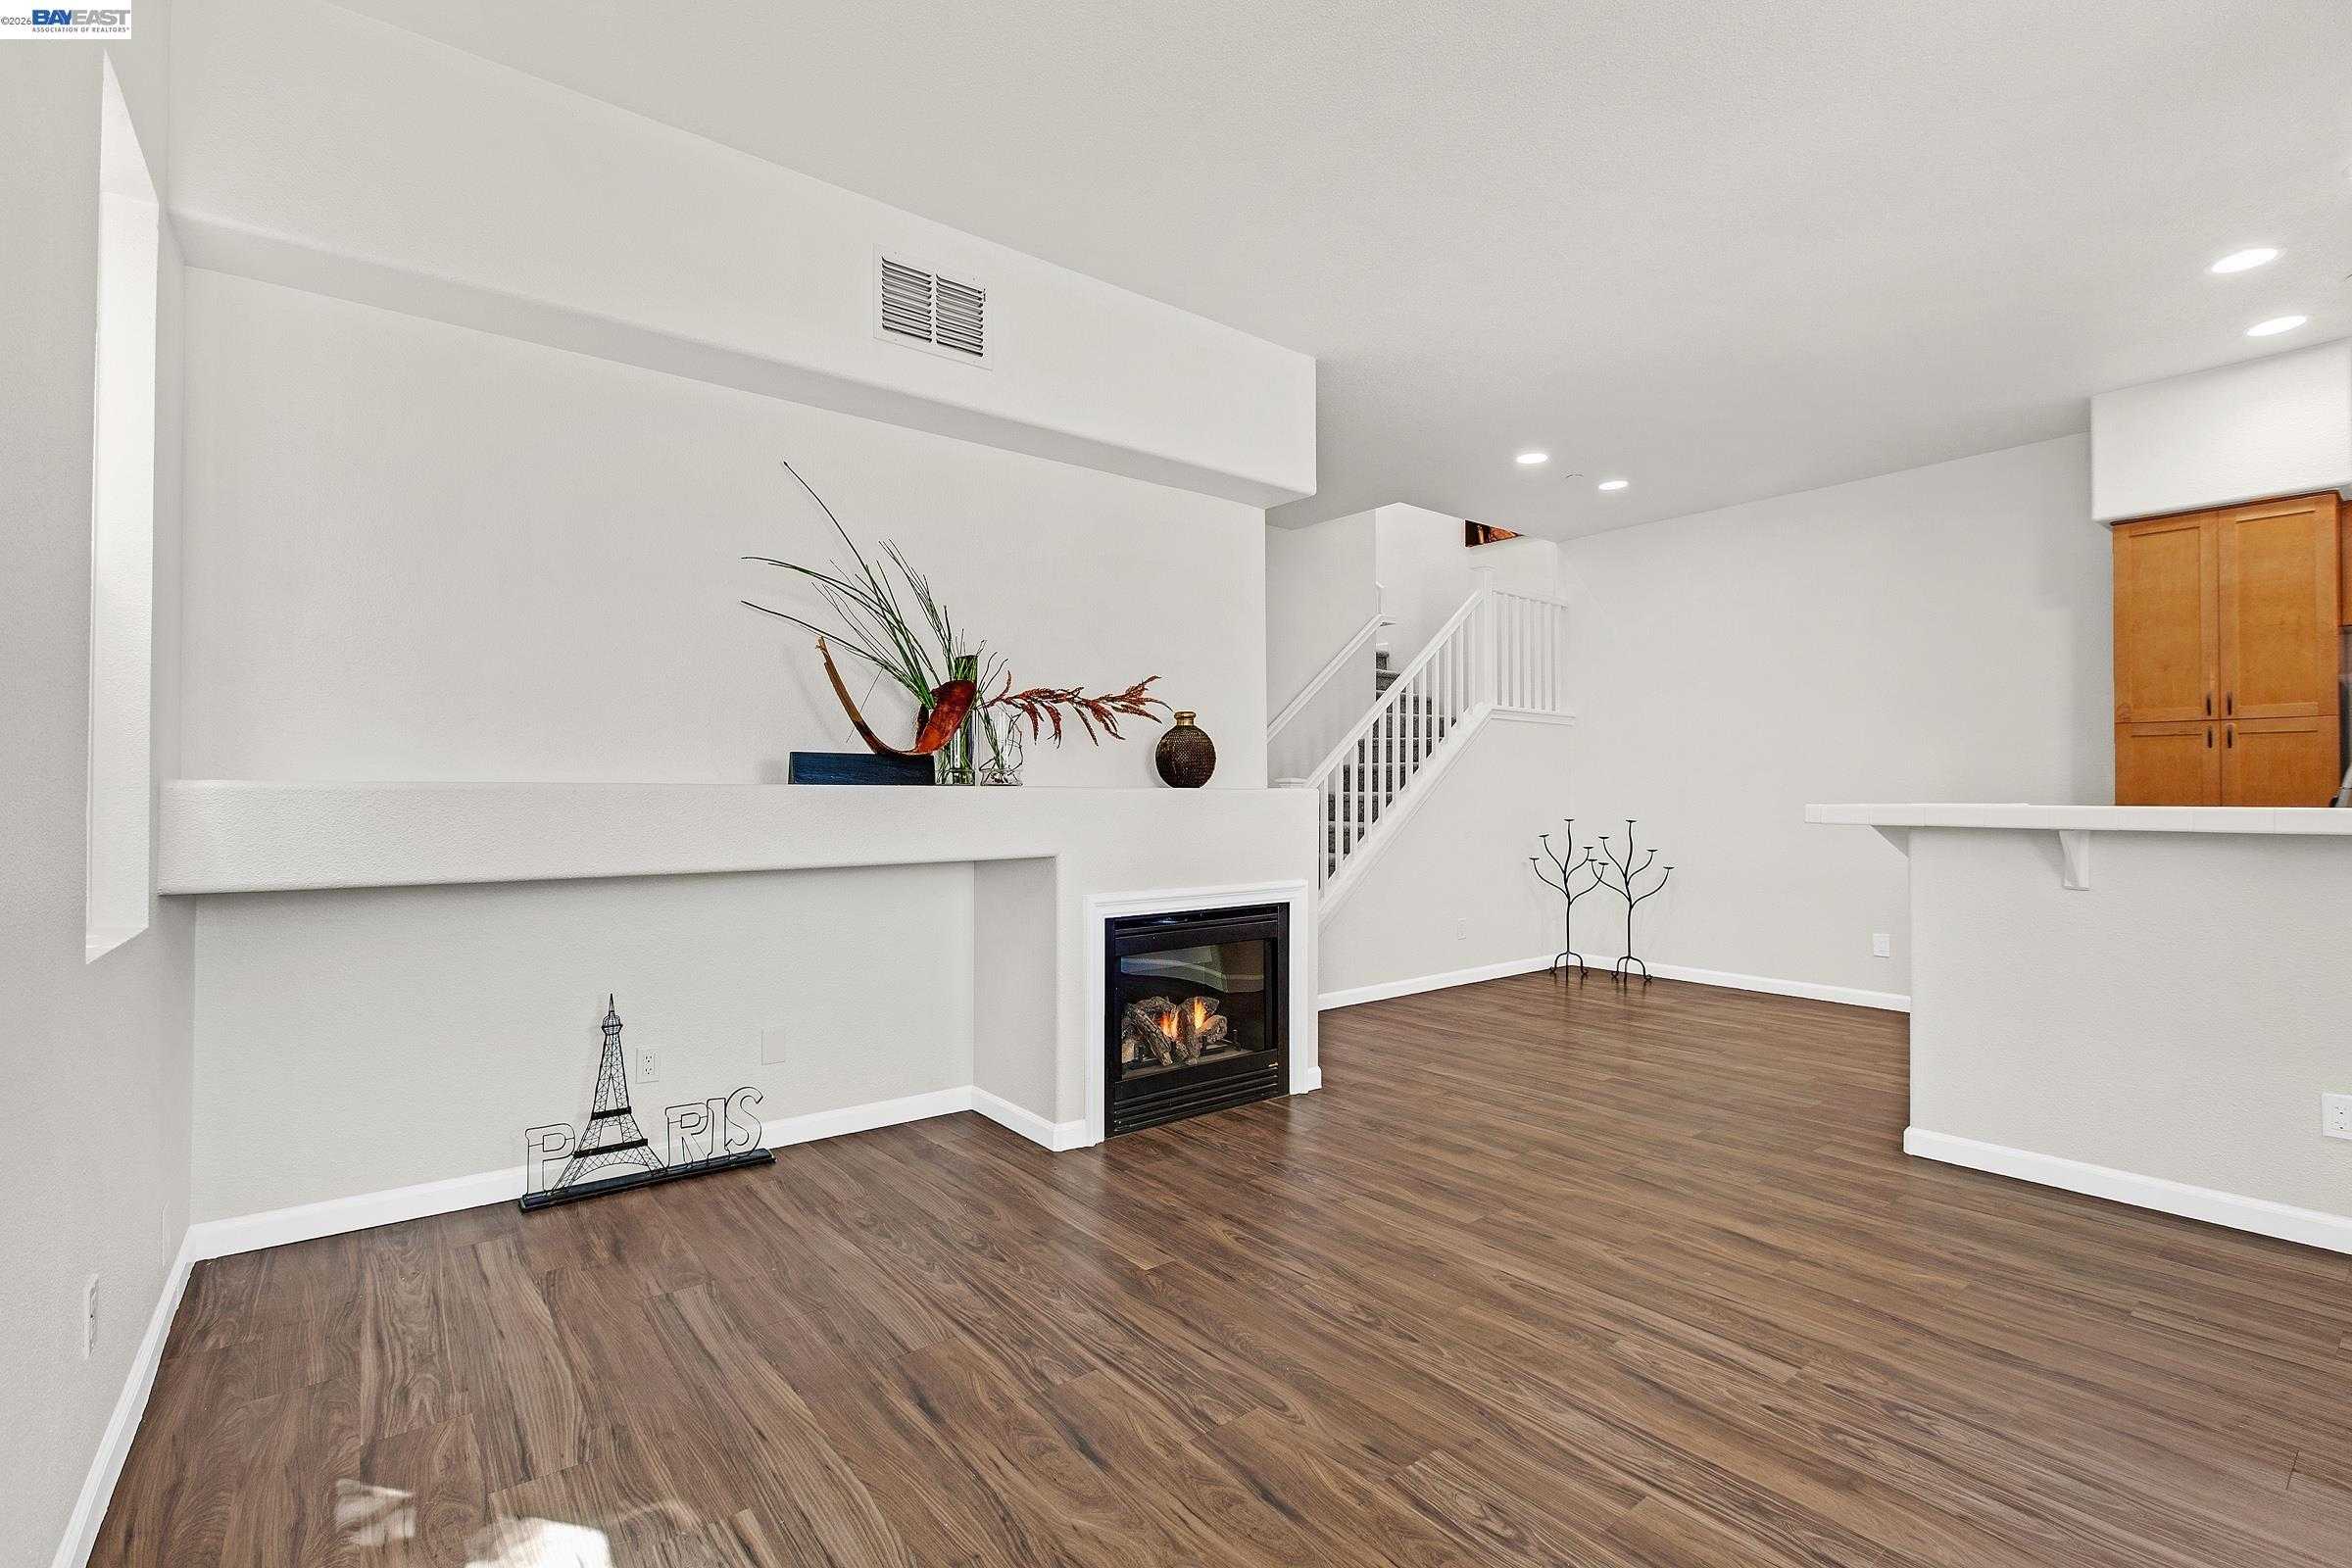
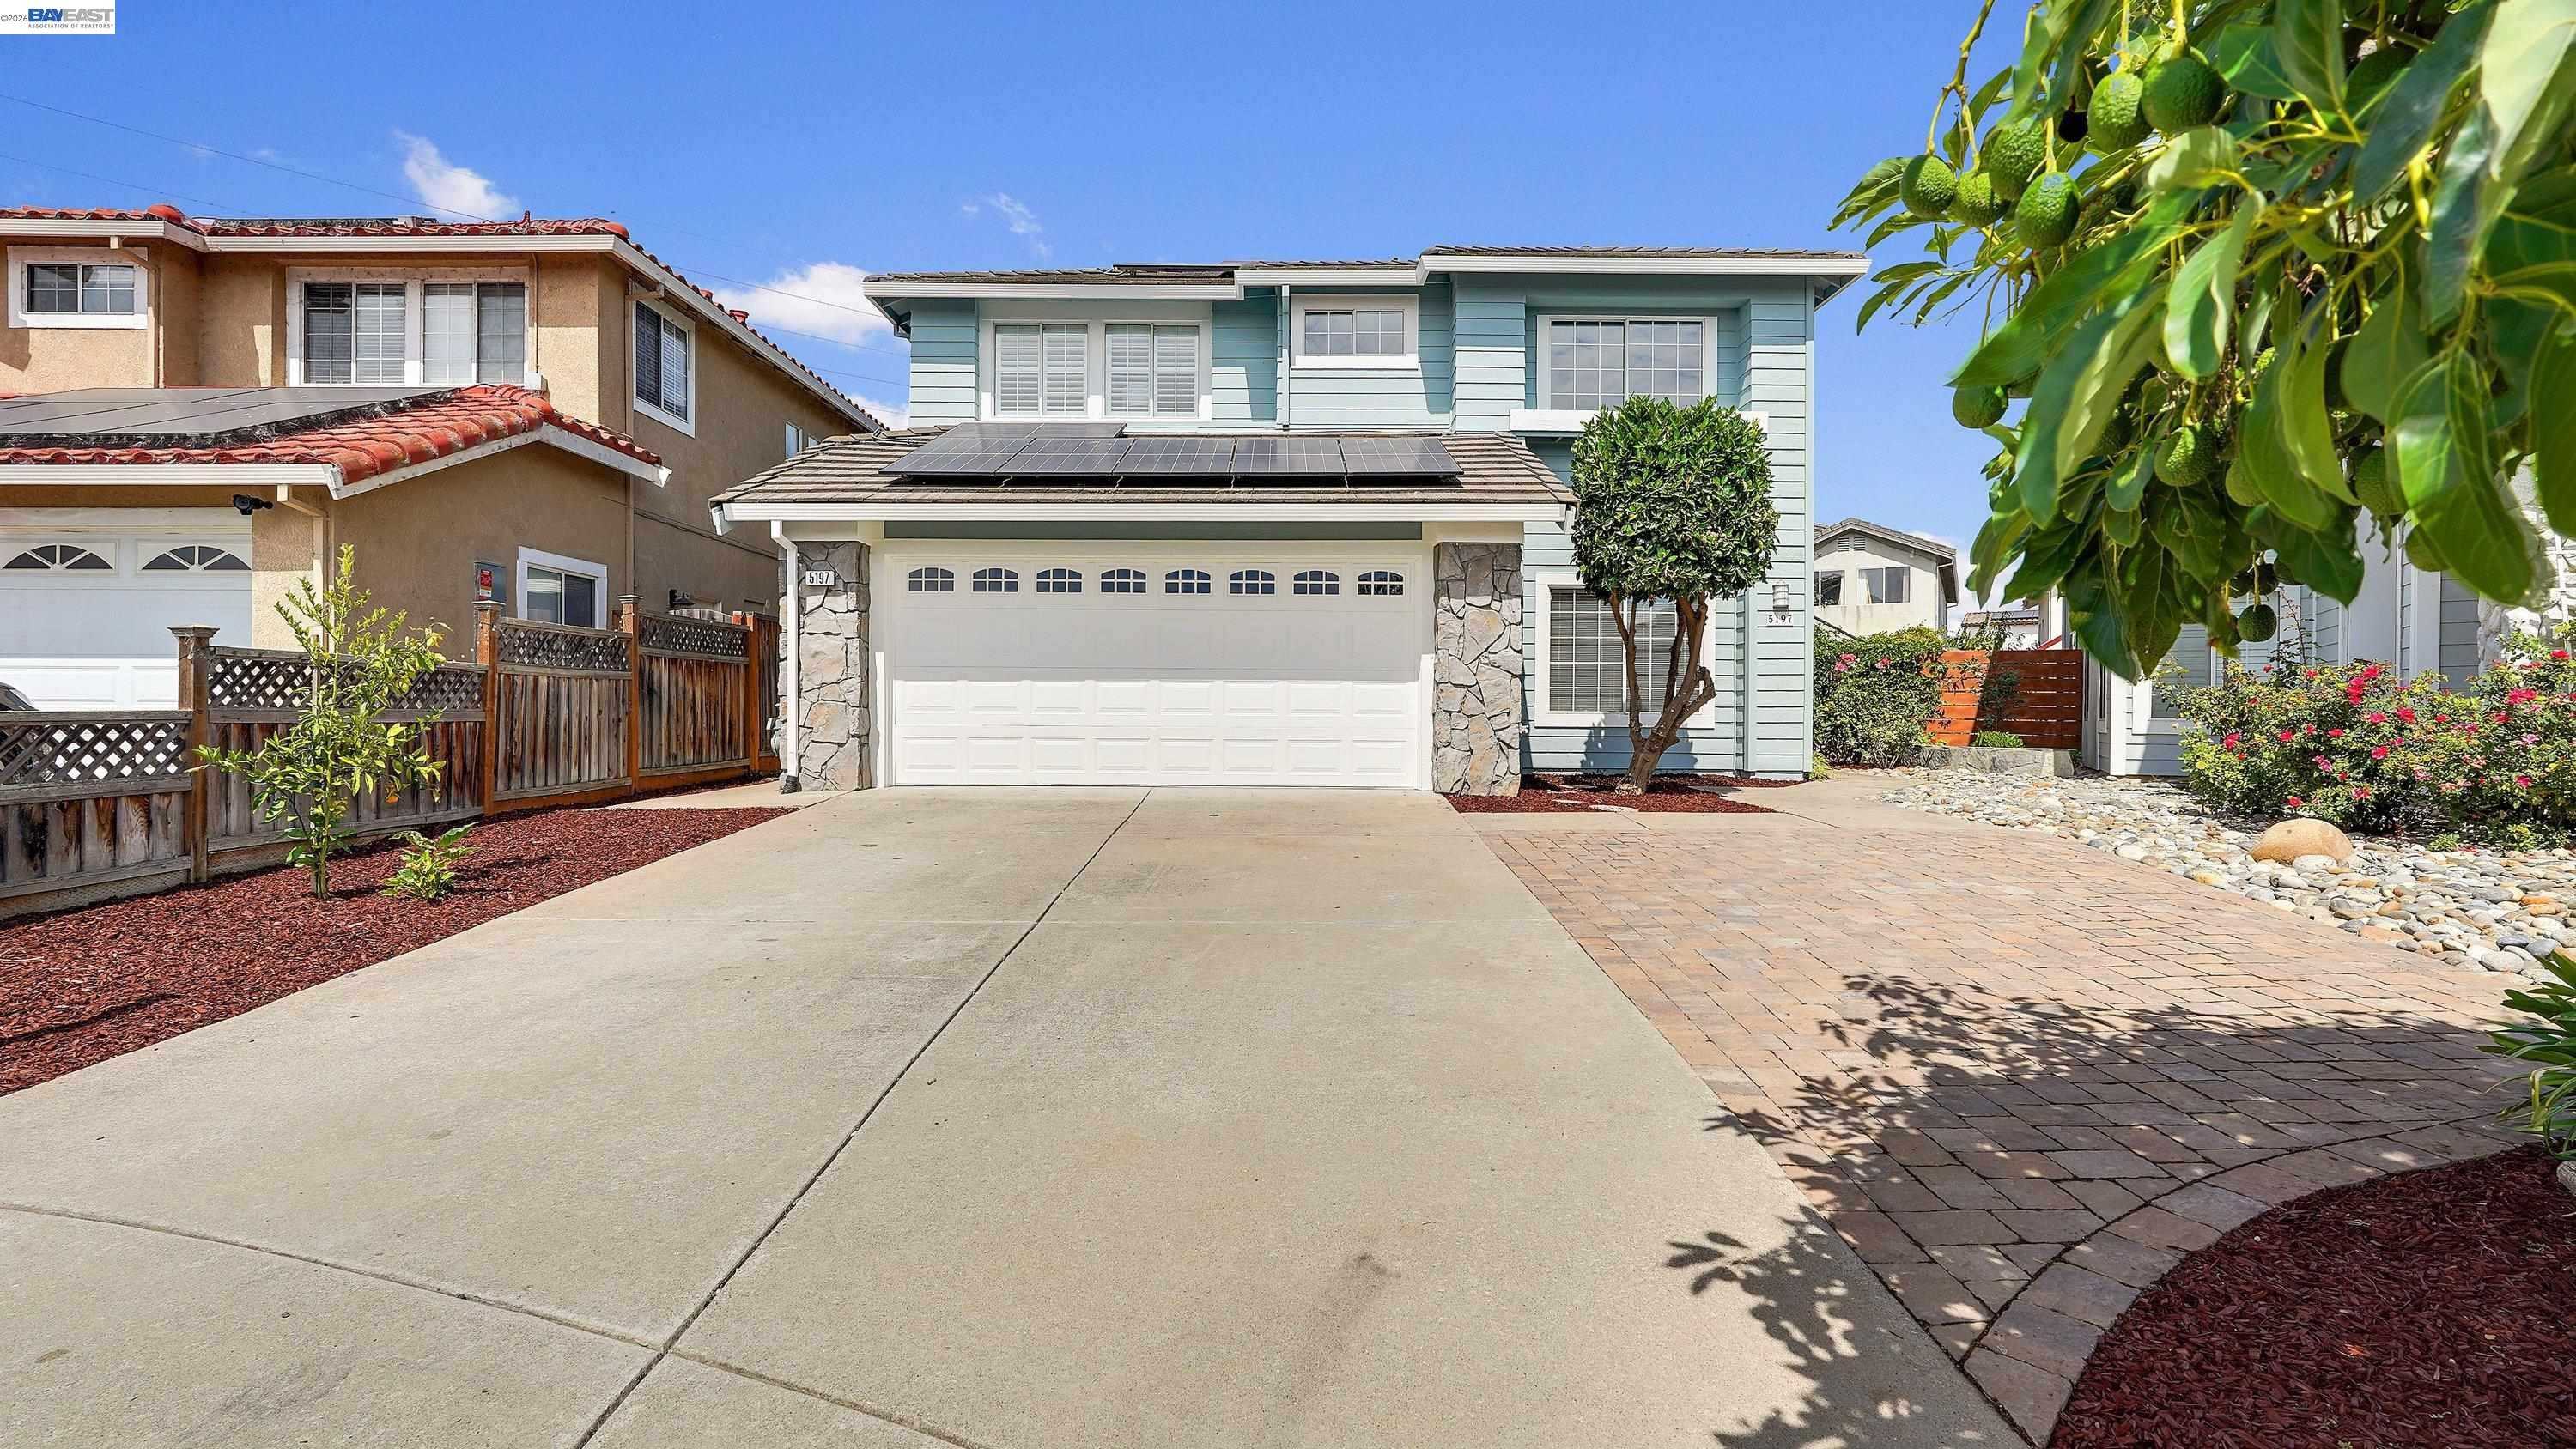
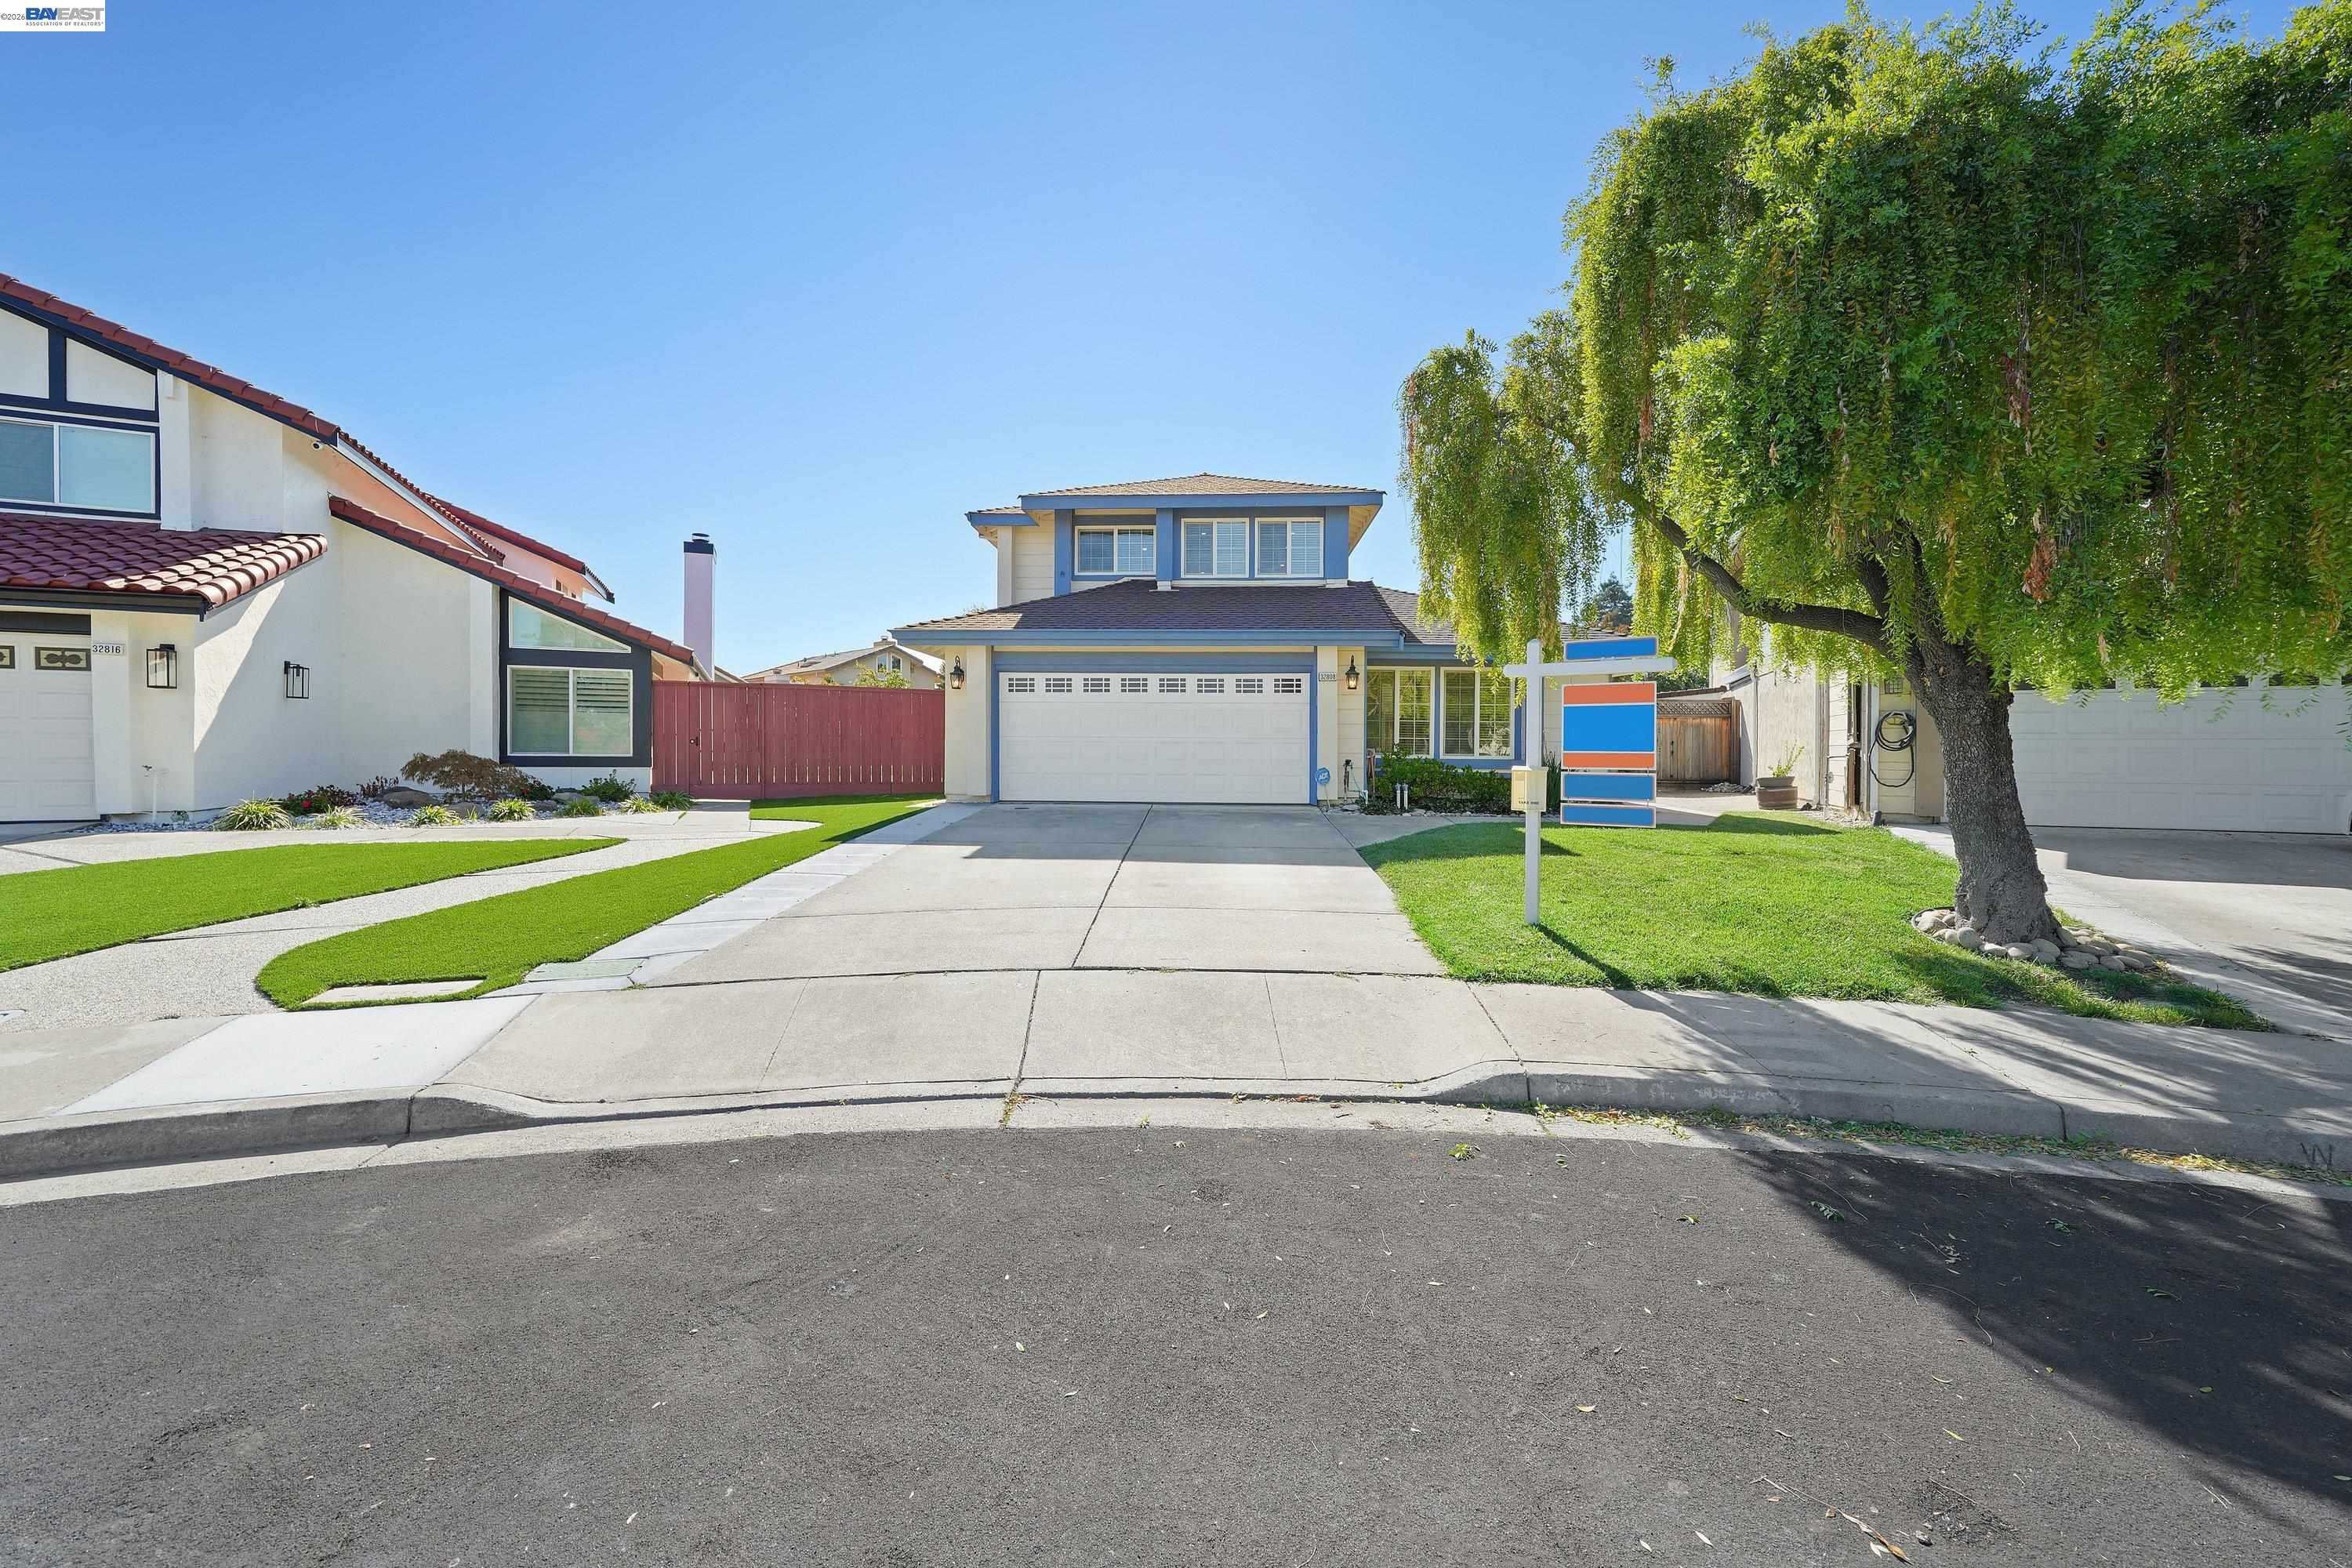
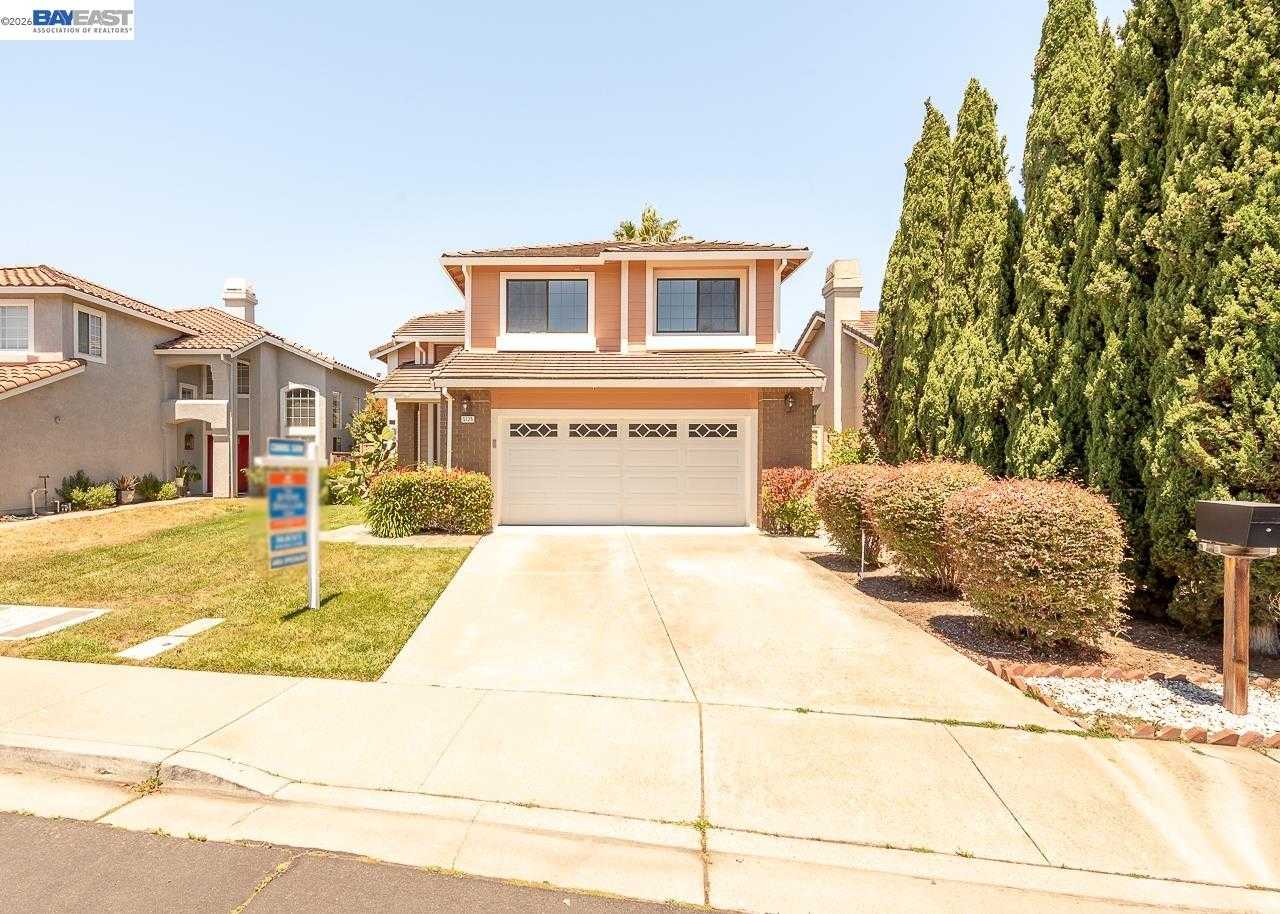
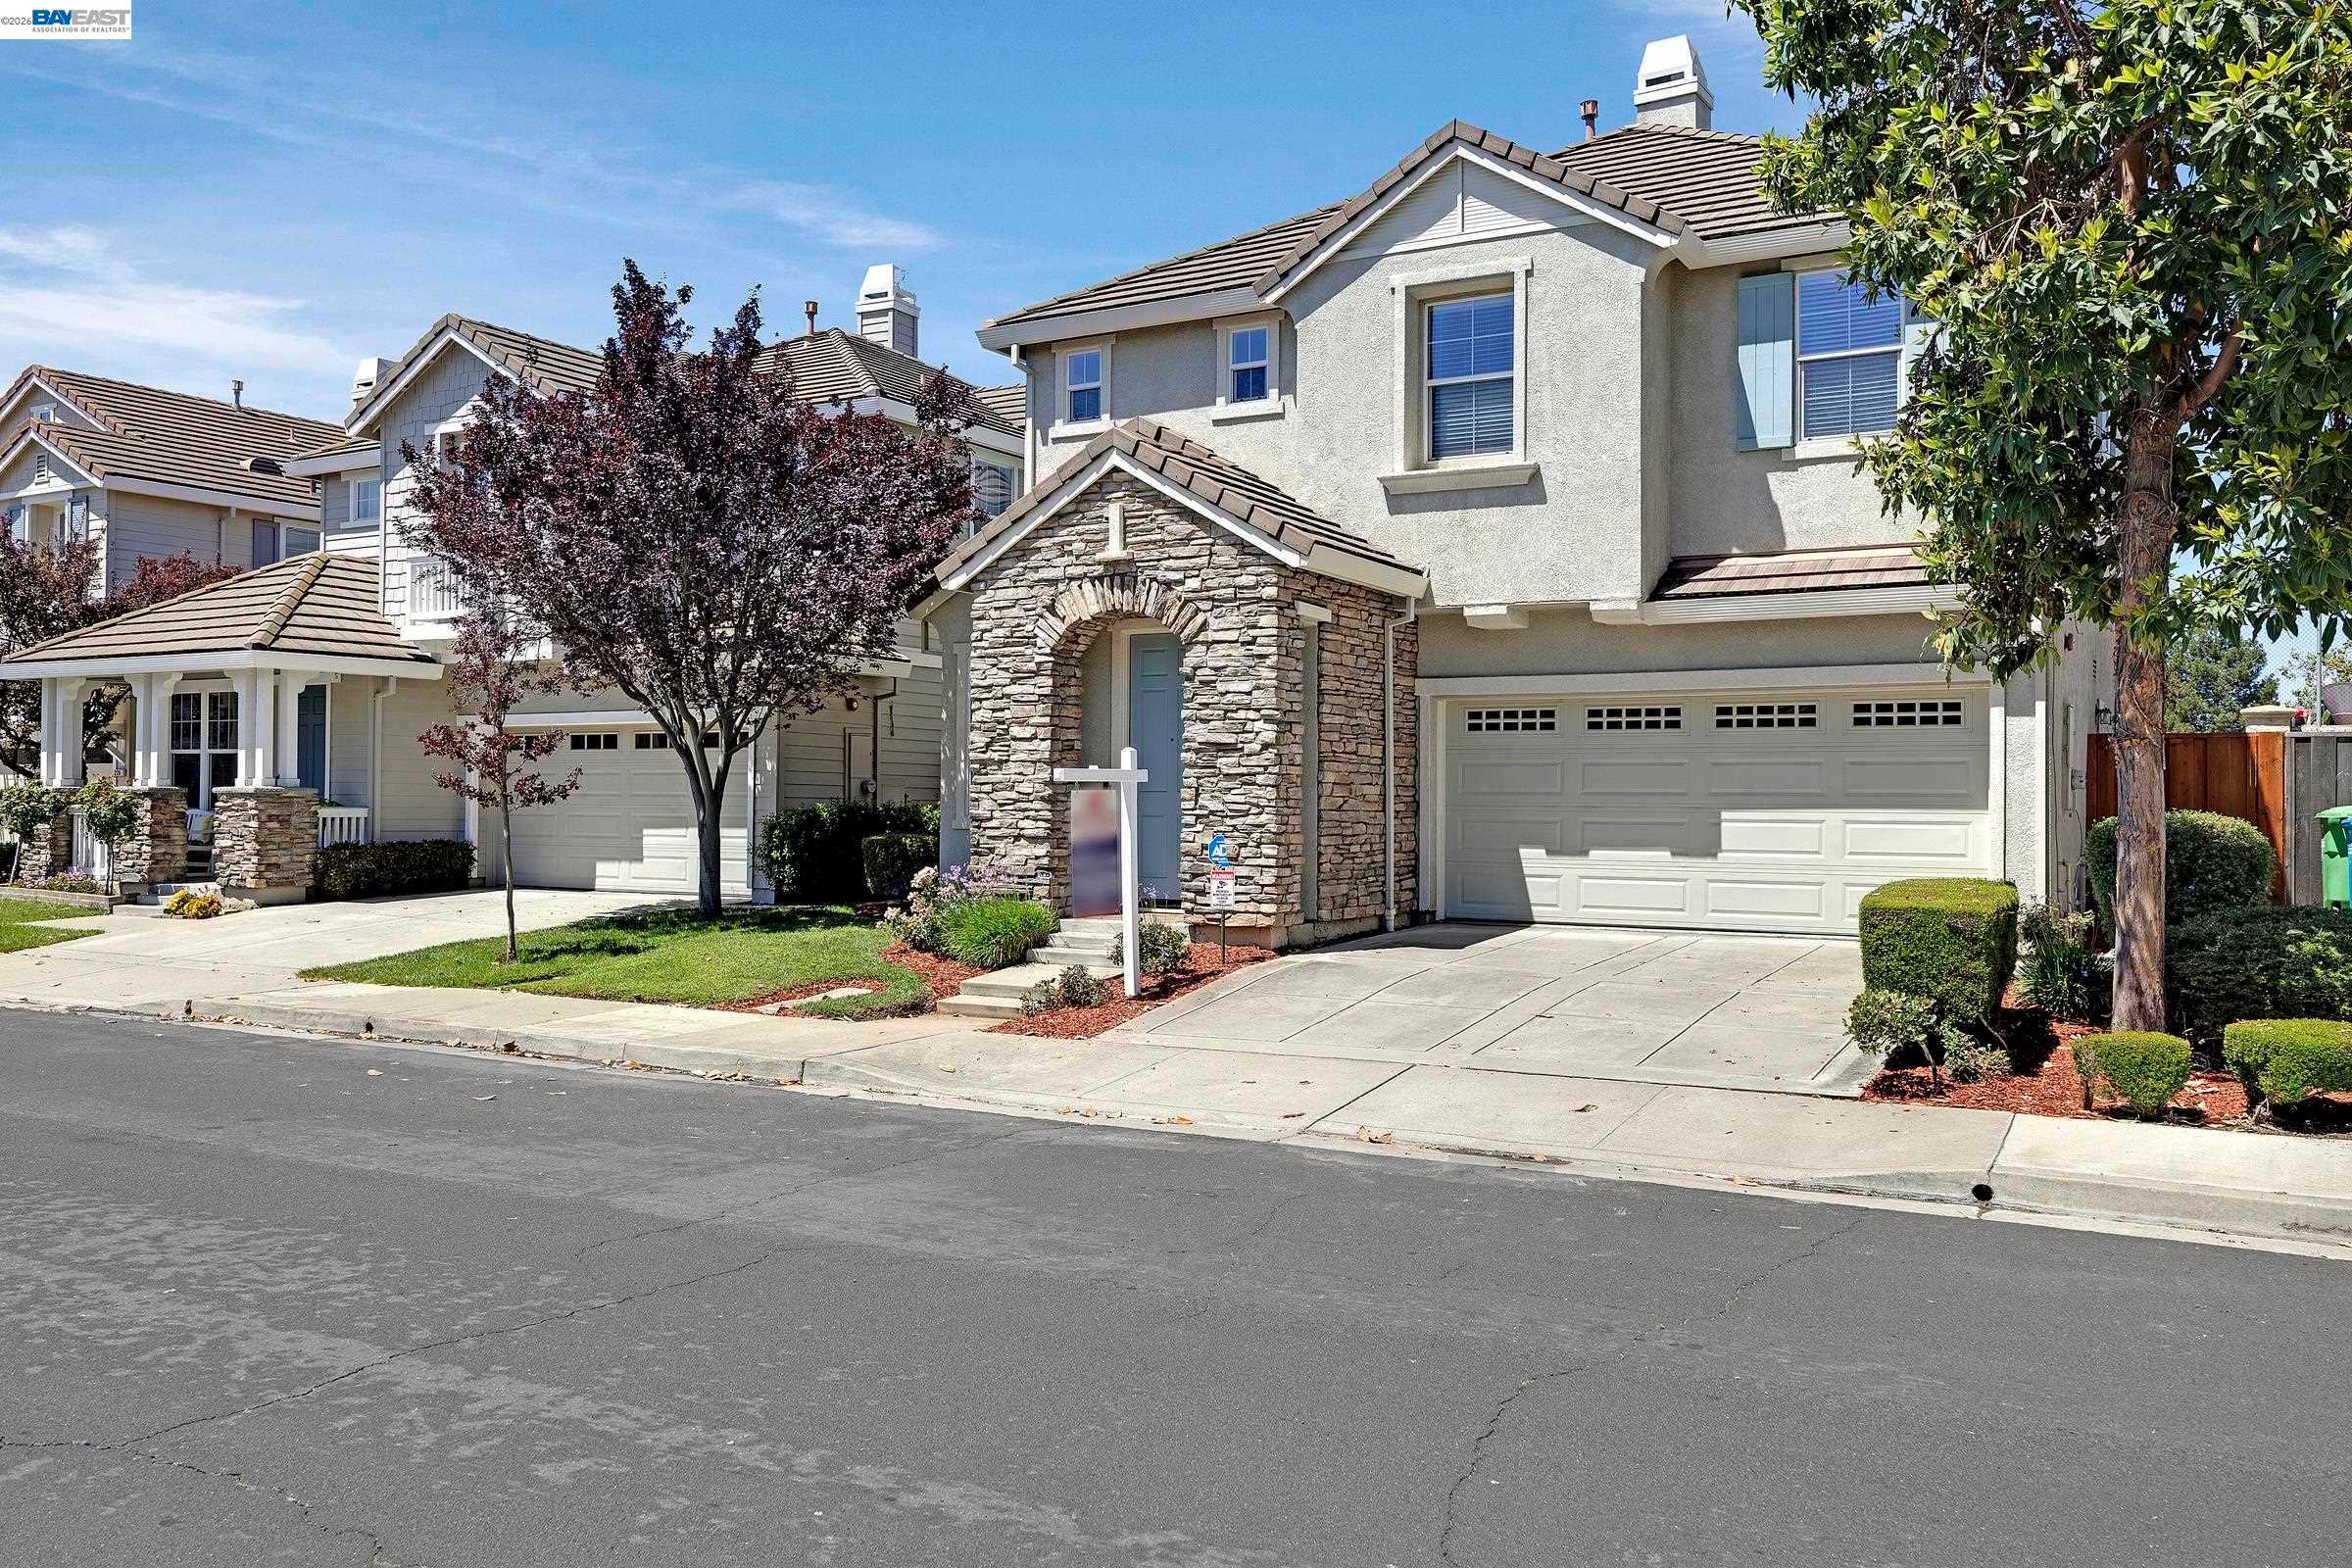
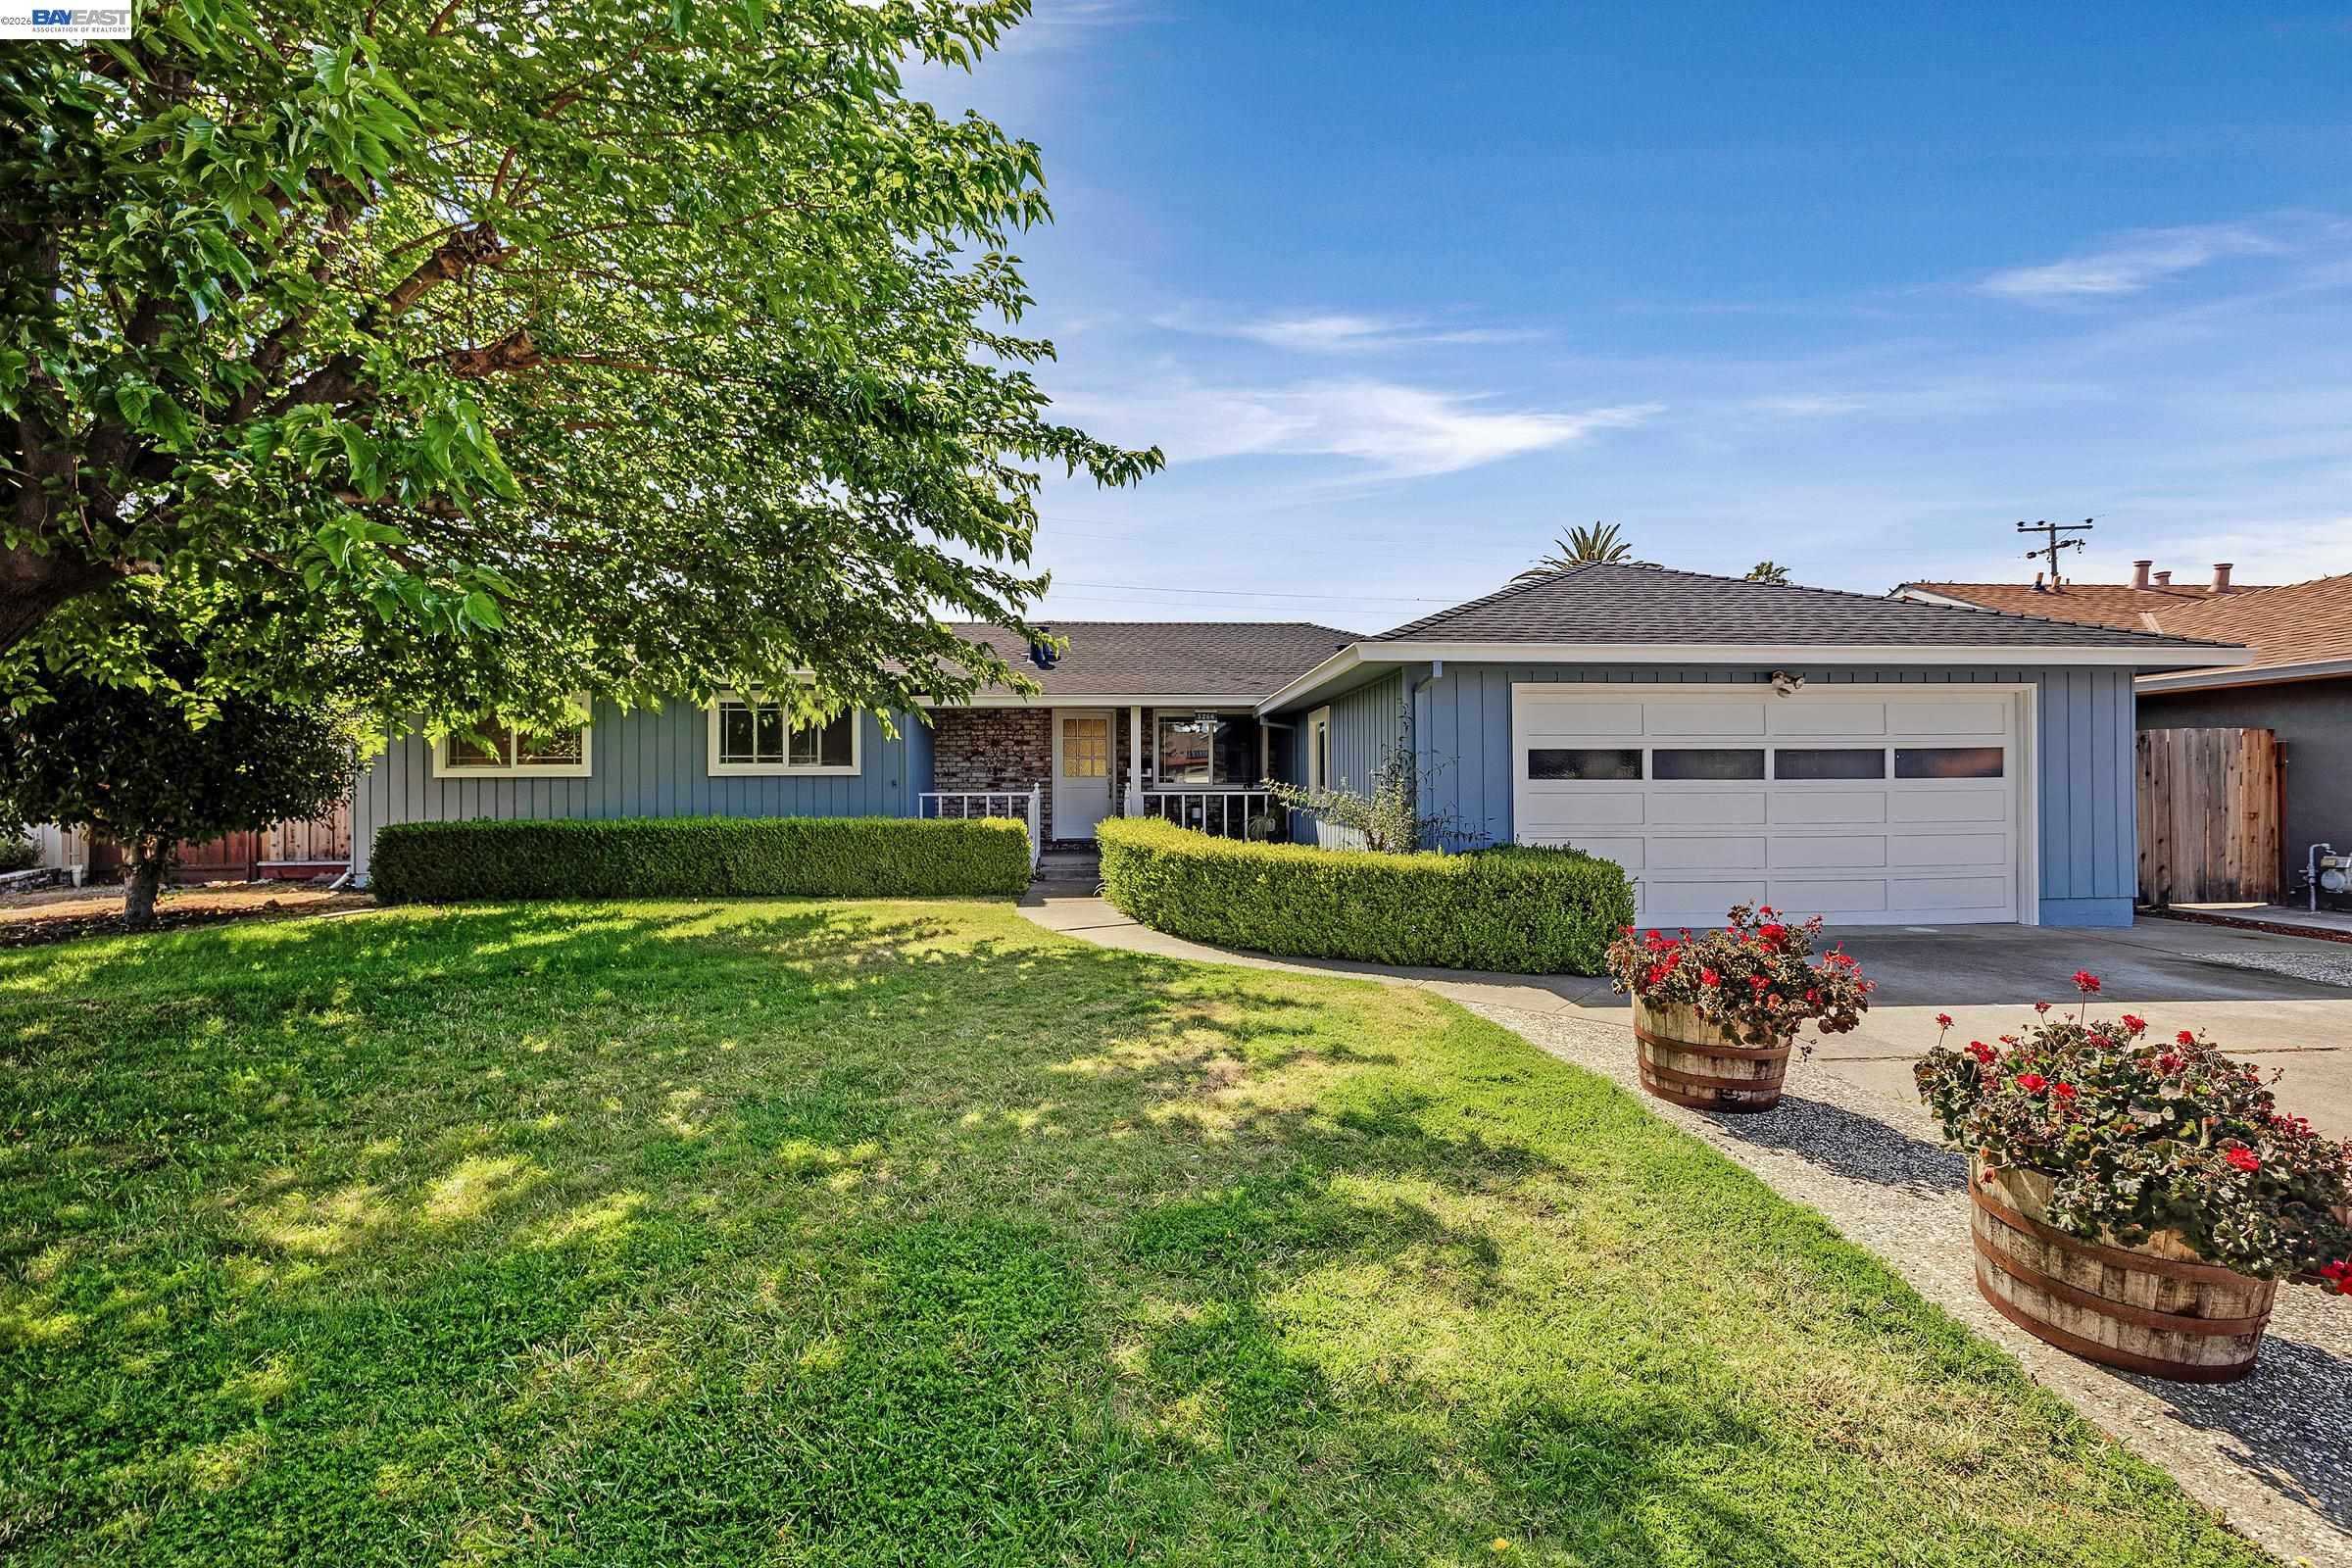
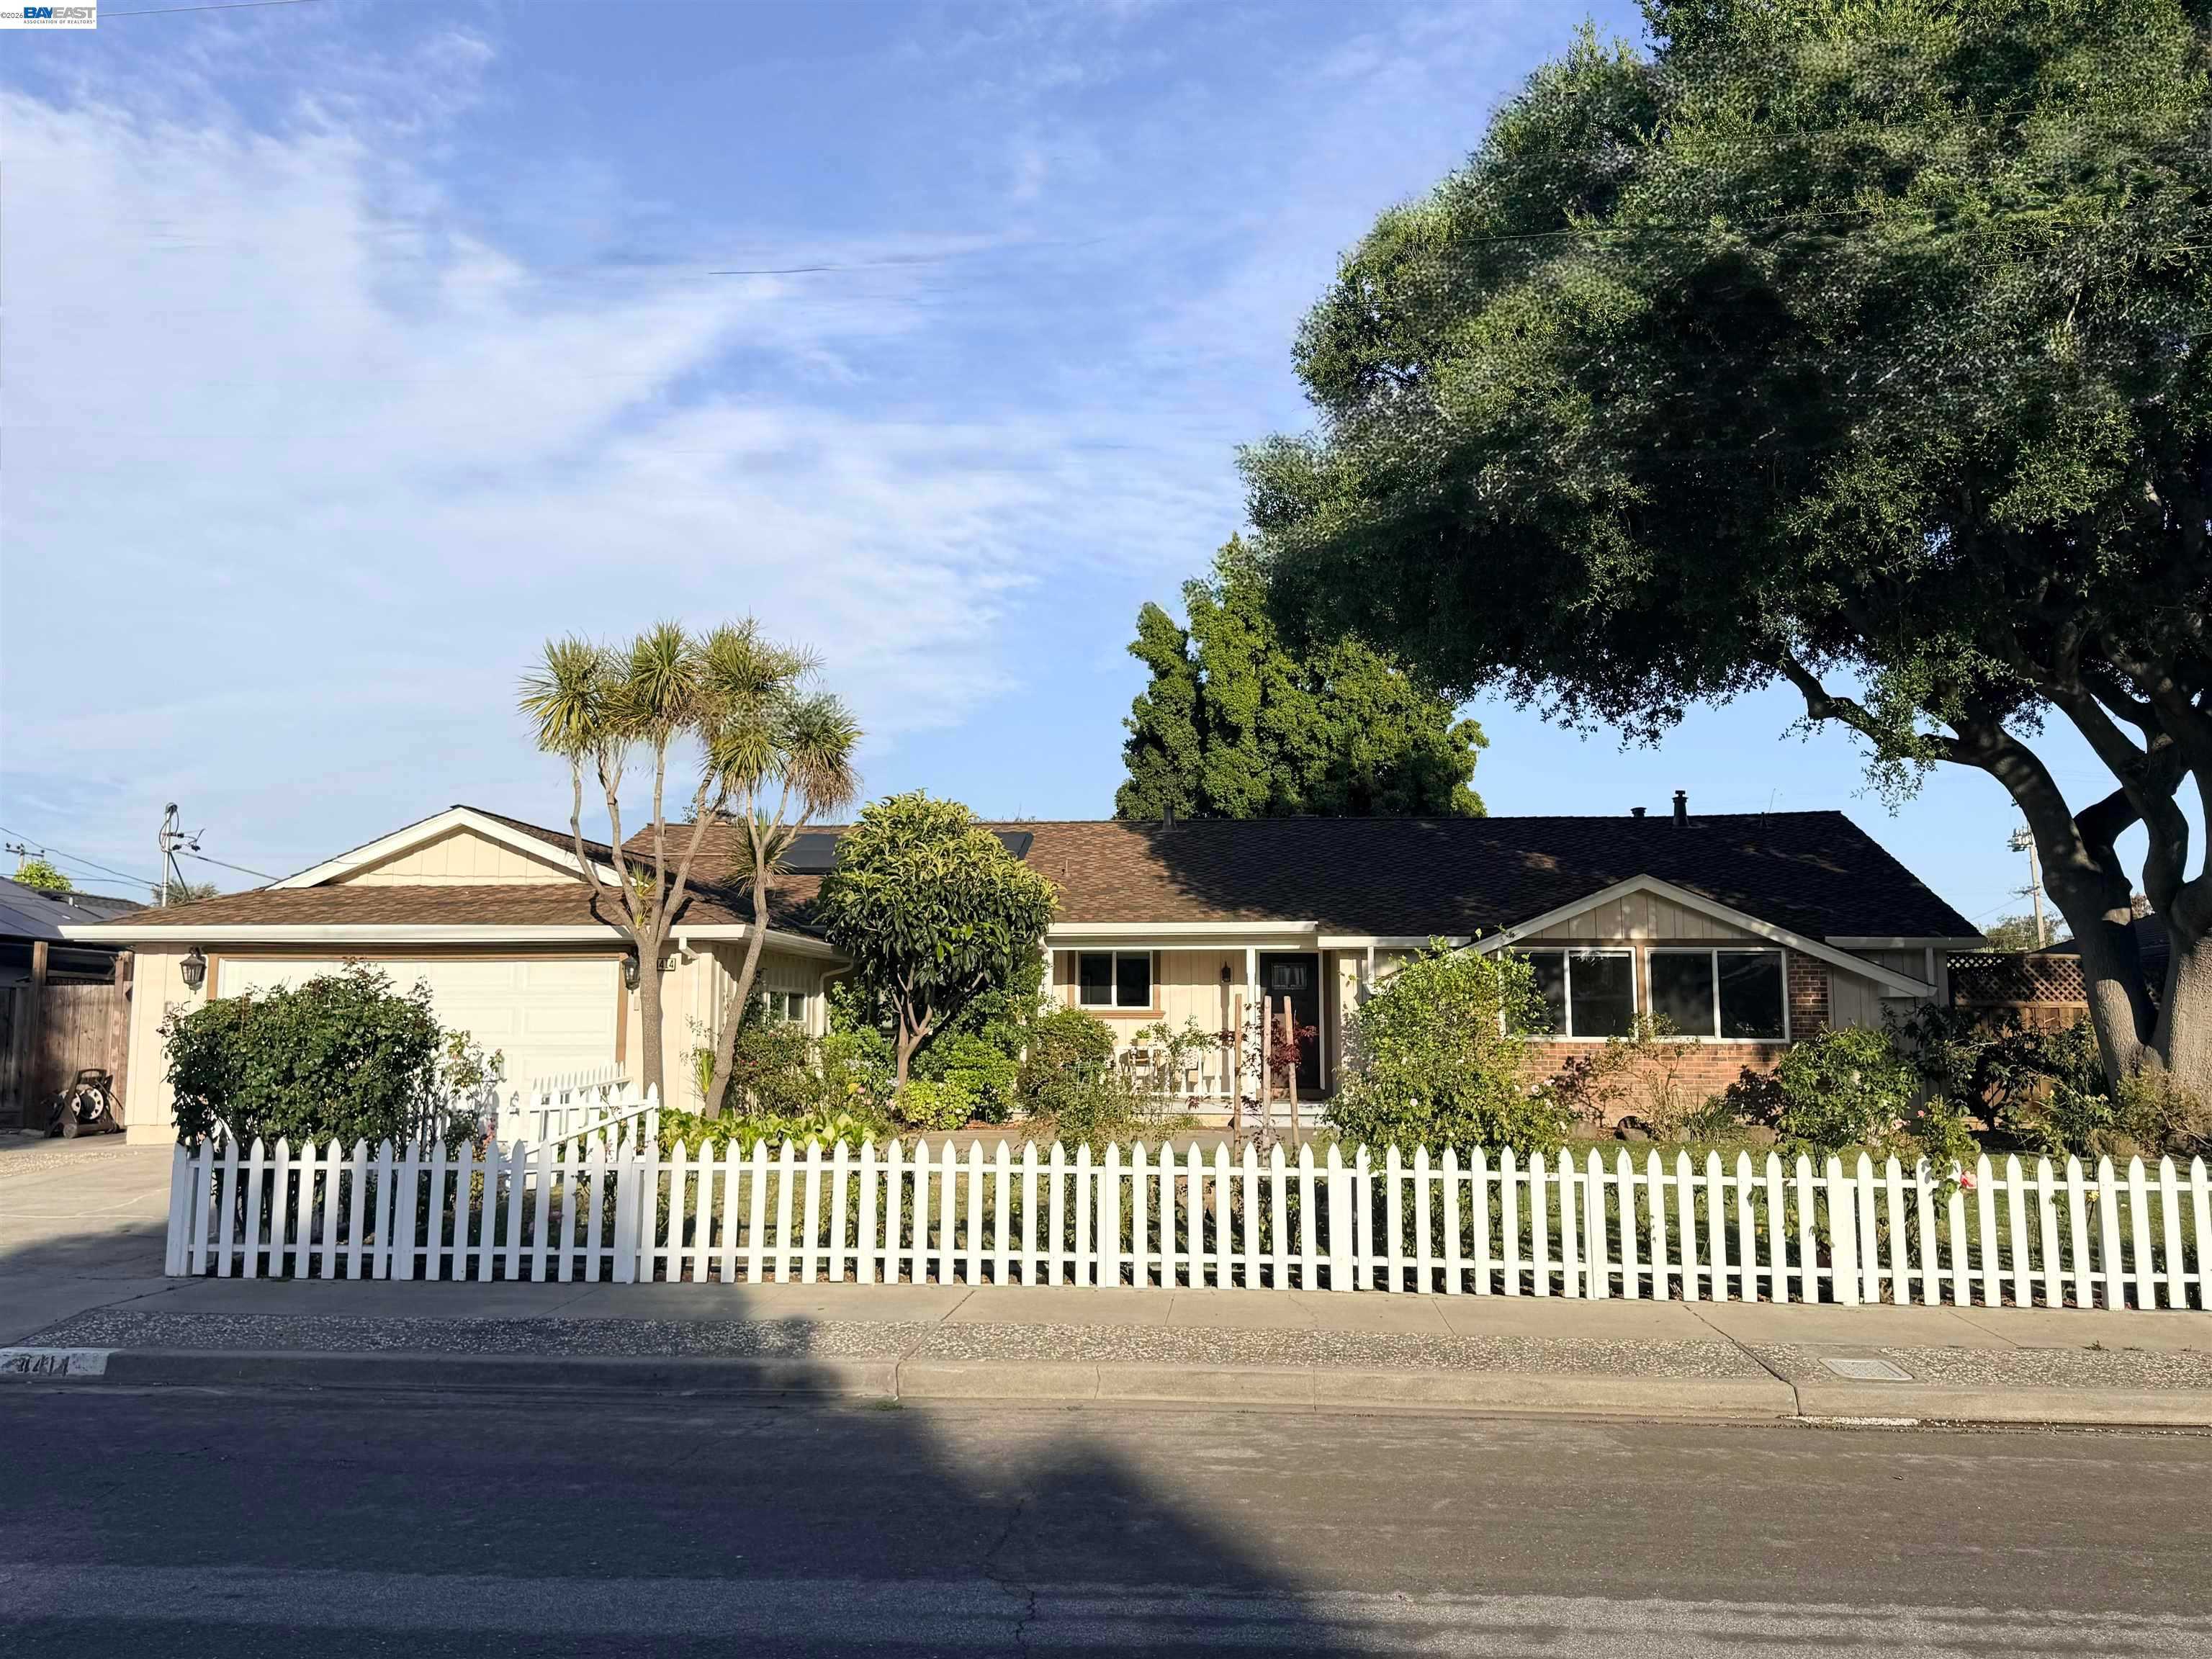
Behind these county totals: hundreds of homes still for sale in Fremont, Hayward, Union City, Newark and Milpitas, counted, priced and sorted every morning from the same MLS export, with a map search for the homes themselves.
30-Year Fixed: 7.37% +0.04 | 15-Year Fixed: 7.04% +0.06
Inflation spares one bill. Sunday's market newsletter looked at an old idea: inflation shrinks a debt, because the amount owed stays the same while paychecks grow. A fixed rate mortgage works the same way. The payment never changes, while incomes and rents rise around it.
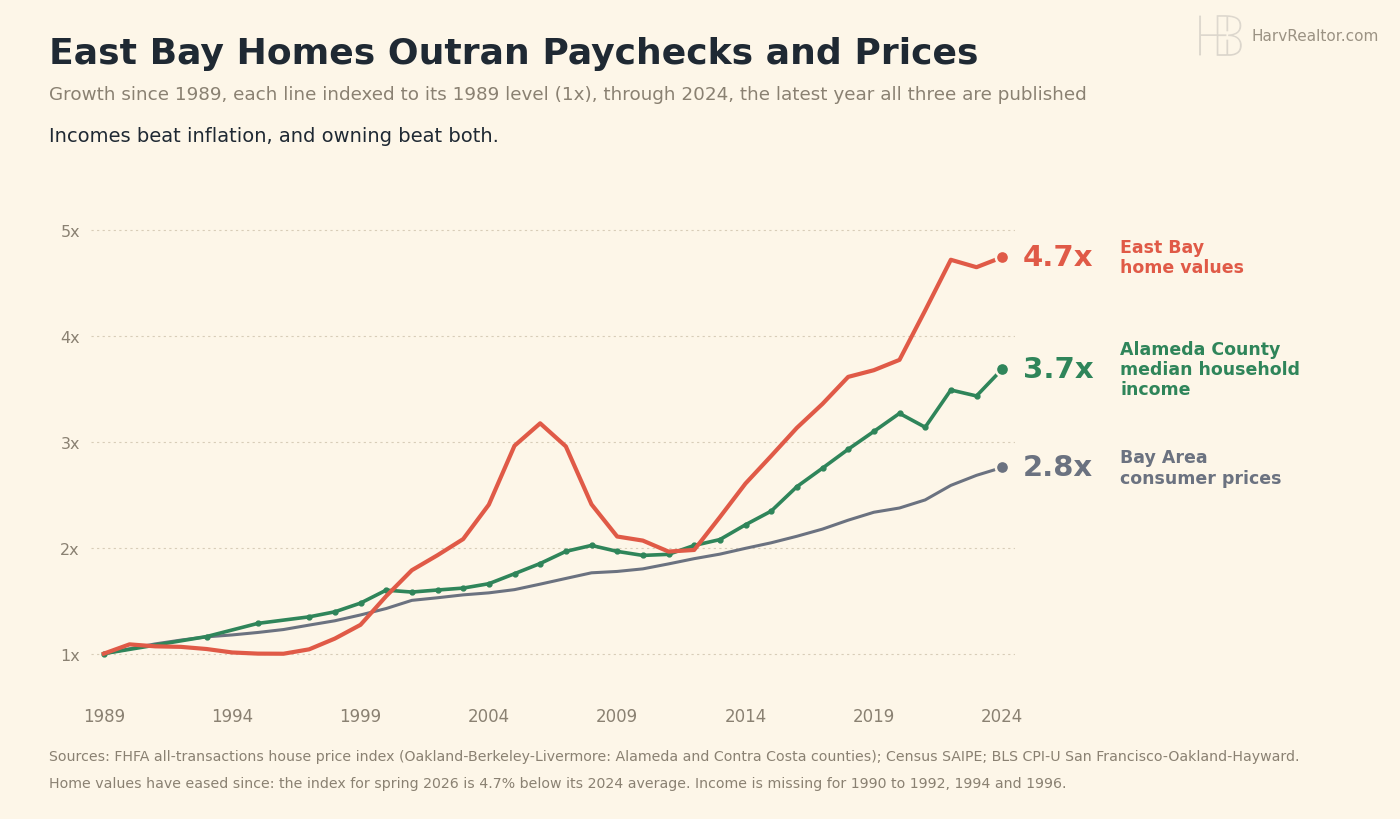
Owning has stayed ahead here. Since 1989, East Bay home values rose about 4.7 times, Alameda County's median household income 3.7 times, and Bay Area consumer prices 2.8 times. Values have cooled lately: this spring's index sits 4.7% below its 2024 average.
Rates are where the debt reaches your payment. Investors want more to hold long bonds, and the 30-year Treasury touched 5.67% on October 7, its highest since 2002. Mortgage News Daily's 30-year ended the week at 7.37% and the 15-year at 7.04%. On our five city median list price of $1,084,000 with 20% down, principal and interest run about $5,987 a month.
What it means for you. If you lock a fixed rate today, you lock the one housing cost inflation cannot raise, with a refinance available if rates fall. If you are selling, 171 homes across the five cities have sat 60 days or longer, so pricing to the comps still wins.
Today's count. Board wide: 2,662 listings across the 15 city table, counting active and in contract together, with 139 coming soon and 209 brand new. The five city ledger carries 679 live listings across Fremont, Hayward, Milpitas, Newark and Union City, 606 on the market and 73 coming soon, unchanged from yesterday.
Fremont holds 231 live listings: 183 active, 28 coming soon, 17 brand new and 3 back on market, with a median on market list price of $1,299,000 at $805 a square foot and a typical listing out 38 days. Hayward carries 188, Milpitas 102, Newark 93 and Union City 65. Across all five cities the median is $1,084,000 at $682 a square foot, 282 homes are priced under a million, and 171 have been sitting 60 days or longer.
S&P 500: 7,659.44 -1.09% | Dow: 52,002.41 -0.34% | Nasdaq: 26,140.03 -2.14%
The Dow's week. Markets are closed for the weekend; these are Friday's closes. The Dow edged higher for the week while selling in chip and AI shares pulled the Nasdaq down.
Owning as the hedge. Over decades, rising prices flow into company sales and earnings. Since the end of 1971 the S&P 500 is up about 75 times, before dividends, while consumer prices rose about 8 times. Never in a straight line, as this week showed.
10-Year Treasury: 5.09% -0.01 | Gold: $4,181.10 +0.26% | Silver: $57.31 +0.26% | Brent Crude: $109.86 +3.72%
Can inflation shrink the debt? Sunday's Market Briefs asked that about the $40 trillion federal debt. Interest on it is running about $1.28 trillion a year, and gross debt was 122.6% of the economy in early 2026, just above the 1946 peak of 119%. The newsletter said about 125%; the Fed's data says a little less.
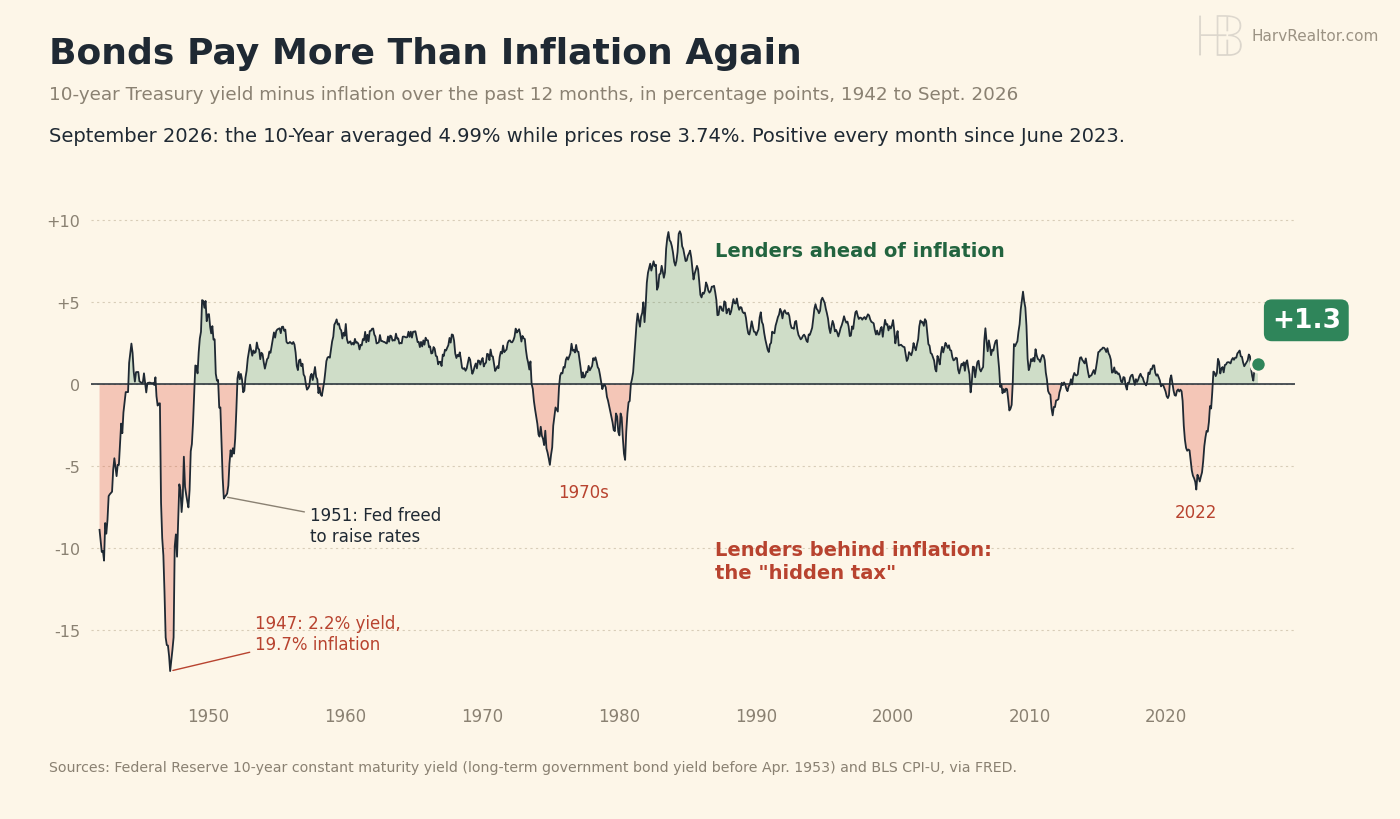
Not the 1940s. Back then long rates were held near 2.5% while inflation ran far higher, a quiet loss for lenders economists call financial repression. In September the 10-Year paid about 1.3 points more than inflation, positive every month since June 2023. The Fed decides next on October 28.
Bitcoin: $81,052 -0.51% | Ethereum: $2,362.51 -2.24% | XRP: $1.27 -1.80%
A soft Sunday. Bitcoin is down 0.51% over 24 hours near $81,050, Ether is down 2.24% and XRP is down 1.80%, live from CoinGecko at 11:28 AM PT. Bitcoin is often pitched as a hedge against a cheaper dollar; this weekend it mostly took the day off.
Sources
- Federal Reserve Bank of St. Louis, FRED (federal debt as a share of GDP, Q1 2026; federal interest payments, Q2 2026)
- FRED (10-year Treasury yield and CPI-U, through September 2026)
- FHFA house price index via FRED (Oakland, Berkeley and Livermore area, through Q2 2026)
- U.S. Census Bureau SAIPE via FRED (Alameda County median household income, 2024)
- BLS CPI database (San Francisco, Oakland and Hayward area, semiannual)
- Federal Reserve (2026 meeting calendar)
- Mortgage News Daily (30 year and 15 year index, October 16)
- U.S. Treasury (10-Year and 30-year daily yield curve, October 16)
- CoinGecko (live crypto, 11:28 AM PT October 18)
- REALTY EXPERTS® Live Inventory (five city ledger, October 18)
Disclaimer: The market data, rates, and information provided are for informational purposes only and should not be considered financial advice. Always verify rates and data with your lender or financial advisor before making any decisions.
Based on information from the Bay East Association of REALTORS® (Bay East MLS) as of October 18, 2026. All data, including all measurements and calculations of area, is obtained from various sources and has not been, and will not be, verified by broker or MLS. All information should be independently reviewed and verified for accuracy. Properties may or may not be listed by the office/agent presenting the information.