



"At a Glance" Local Housing STATS and News 10/11/26
October 11, 2026 · Alameda County Market Dashboard
TODAY'S LIVE INVENTORY
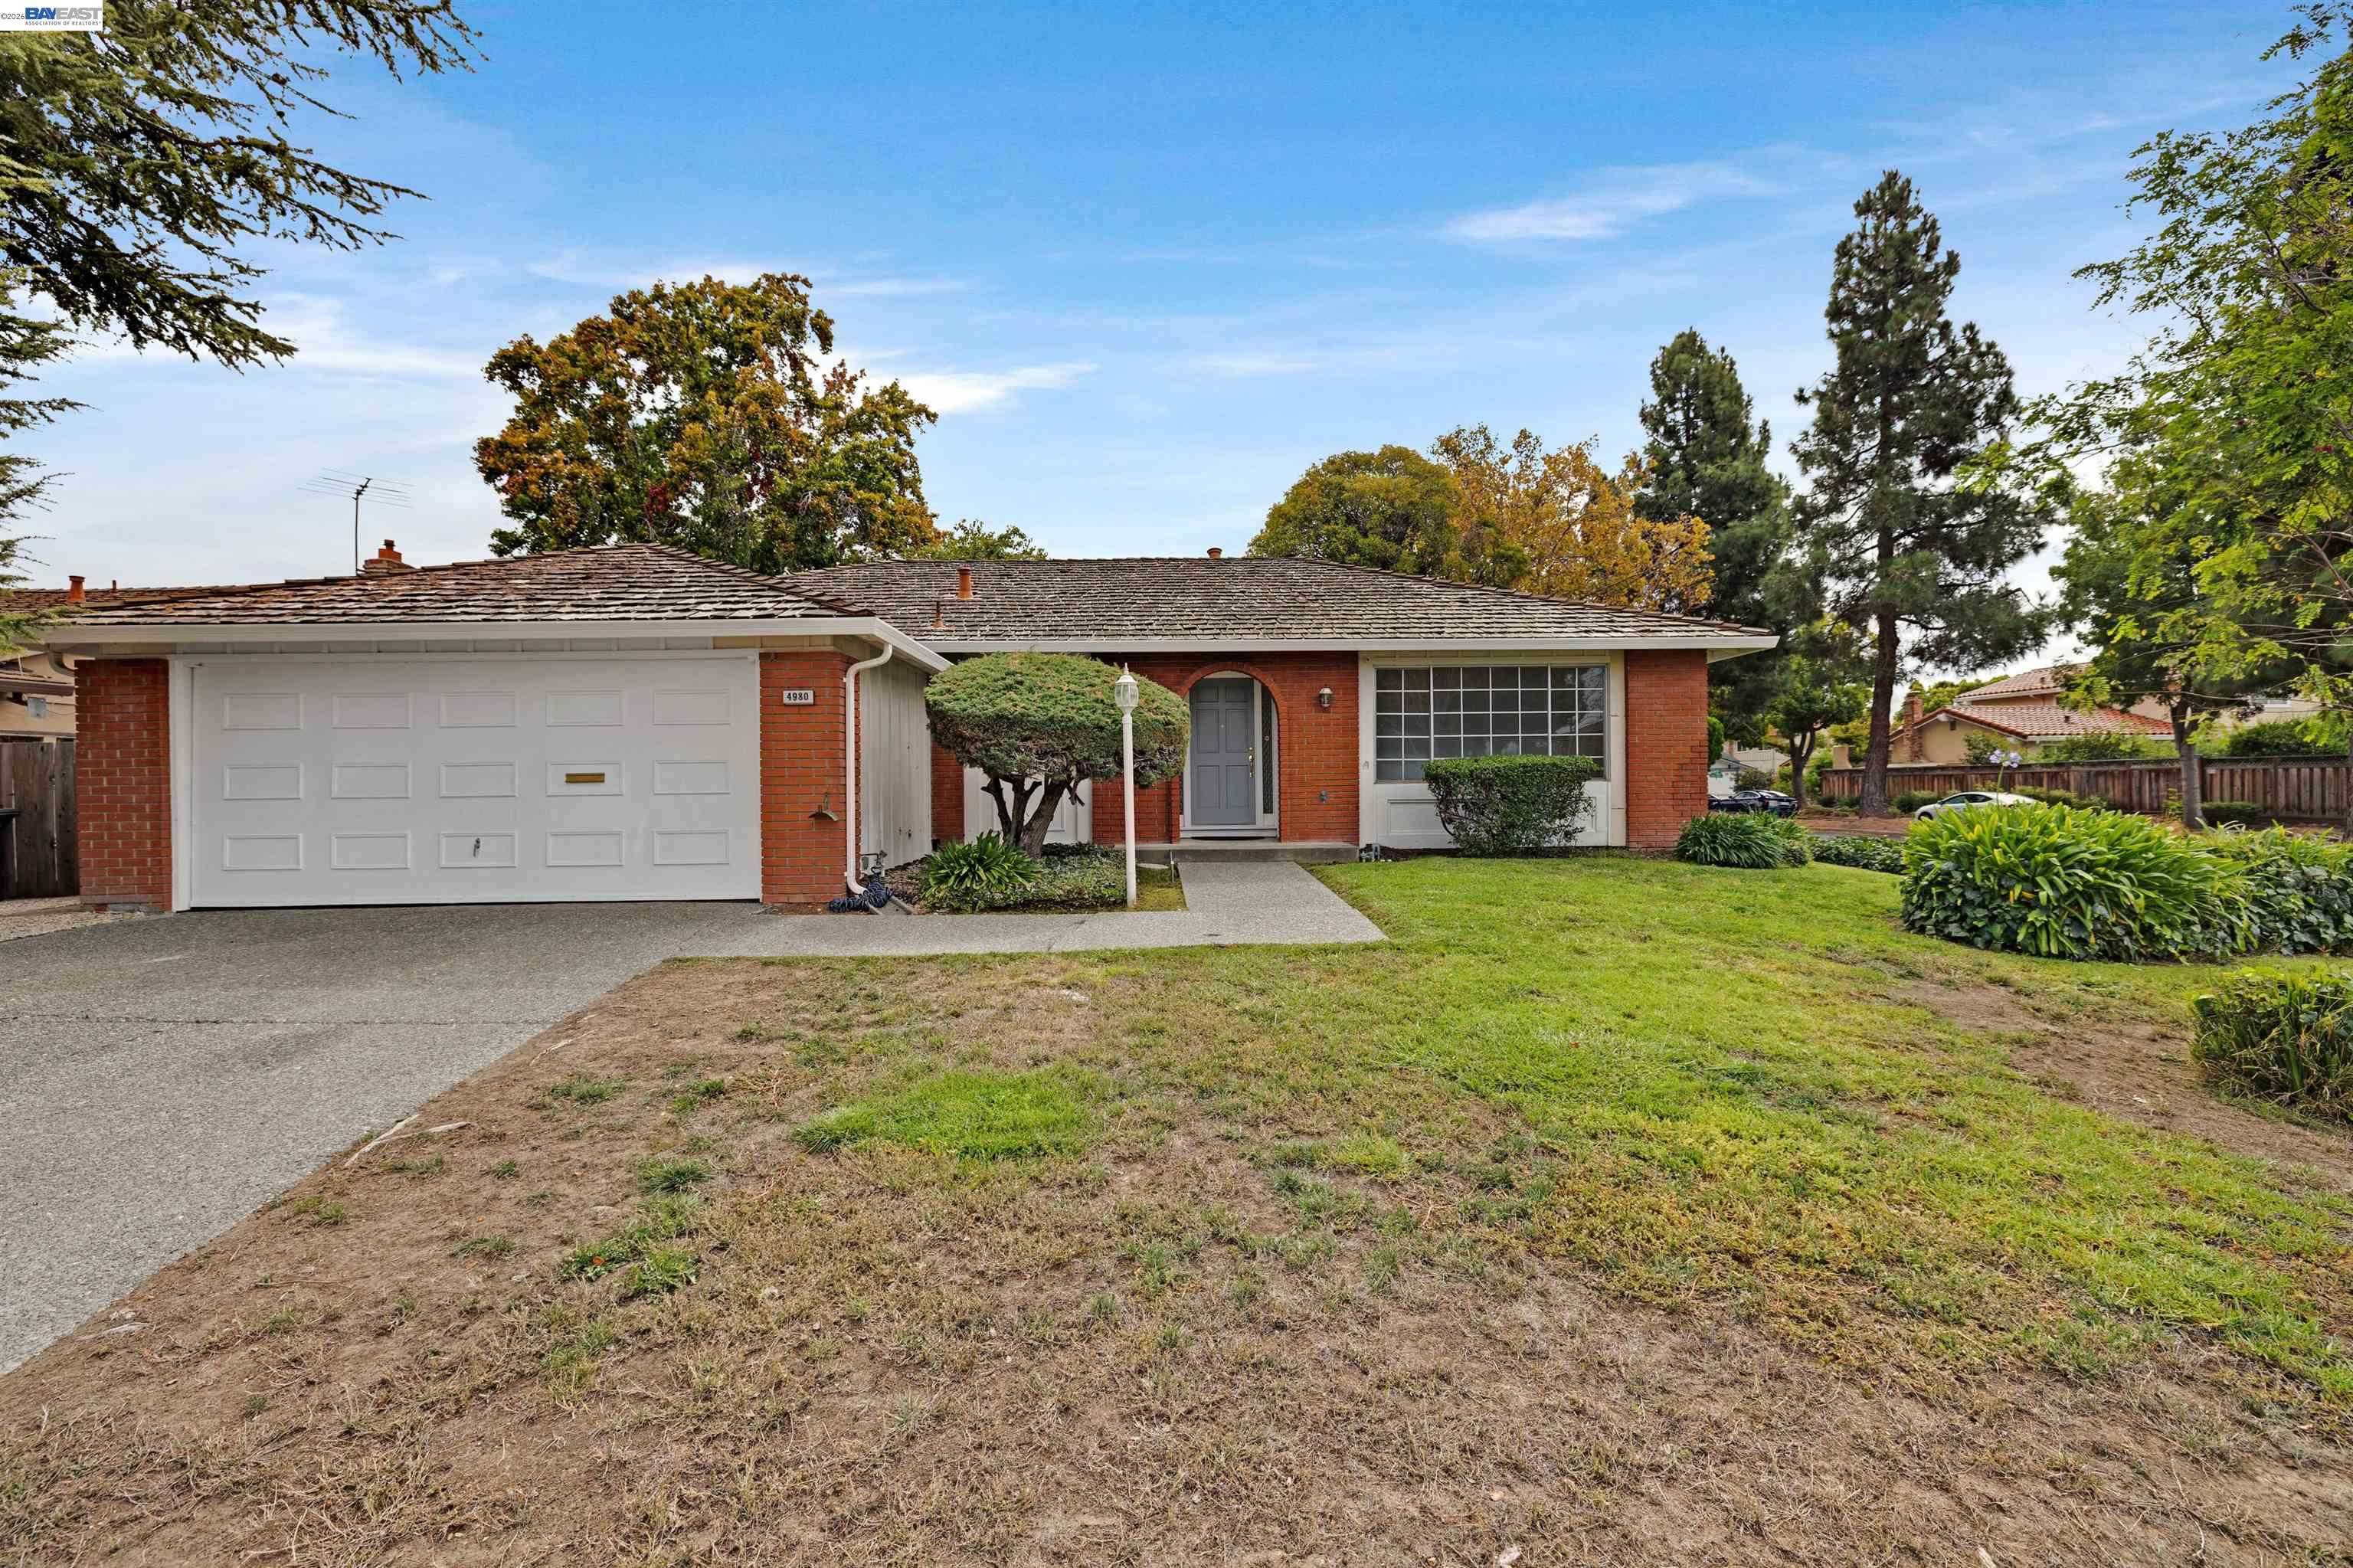
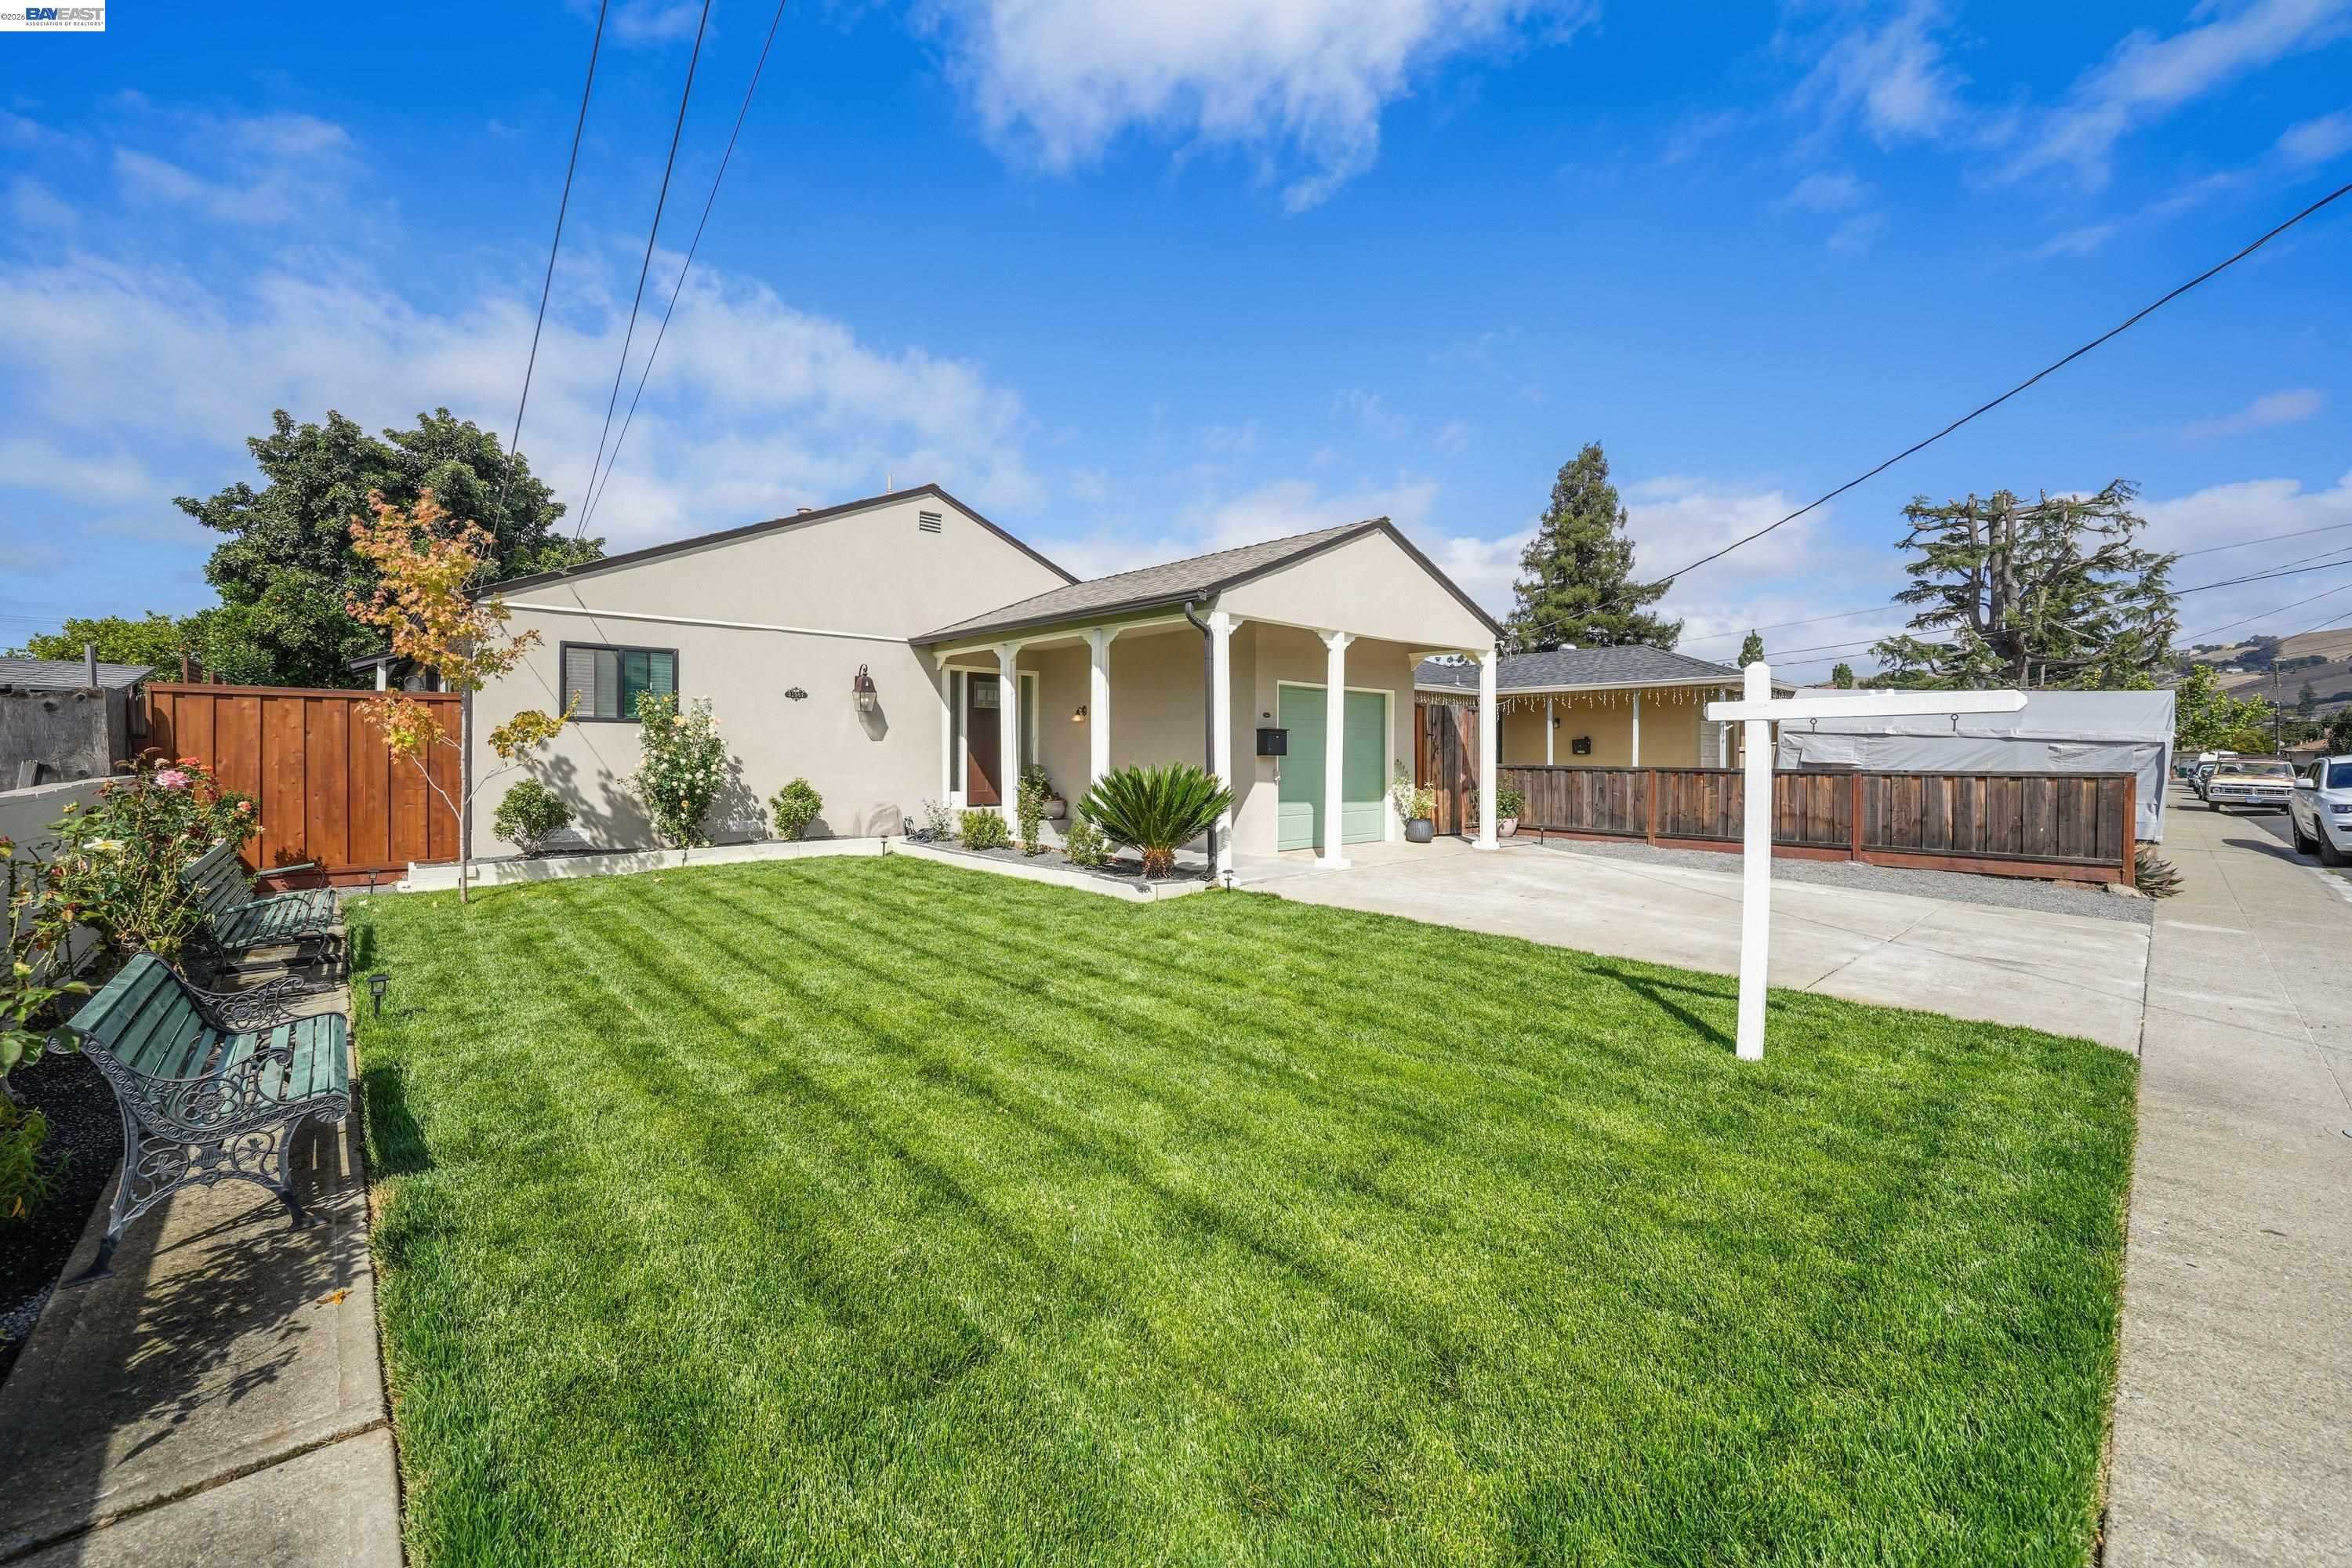
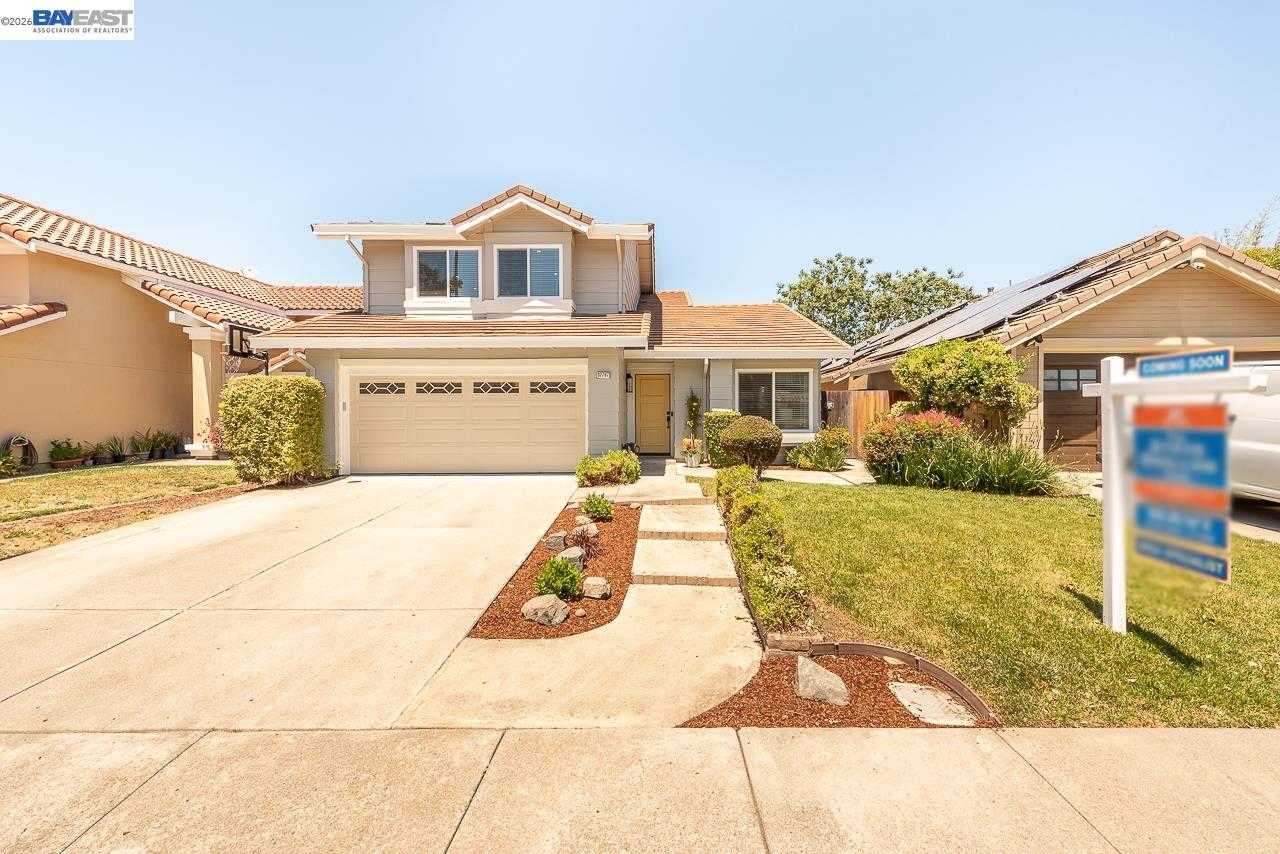
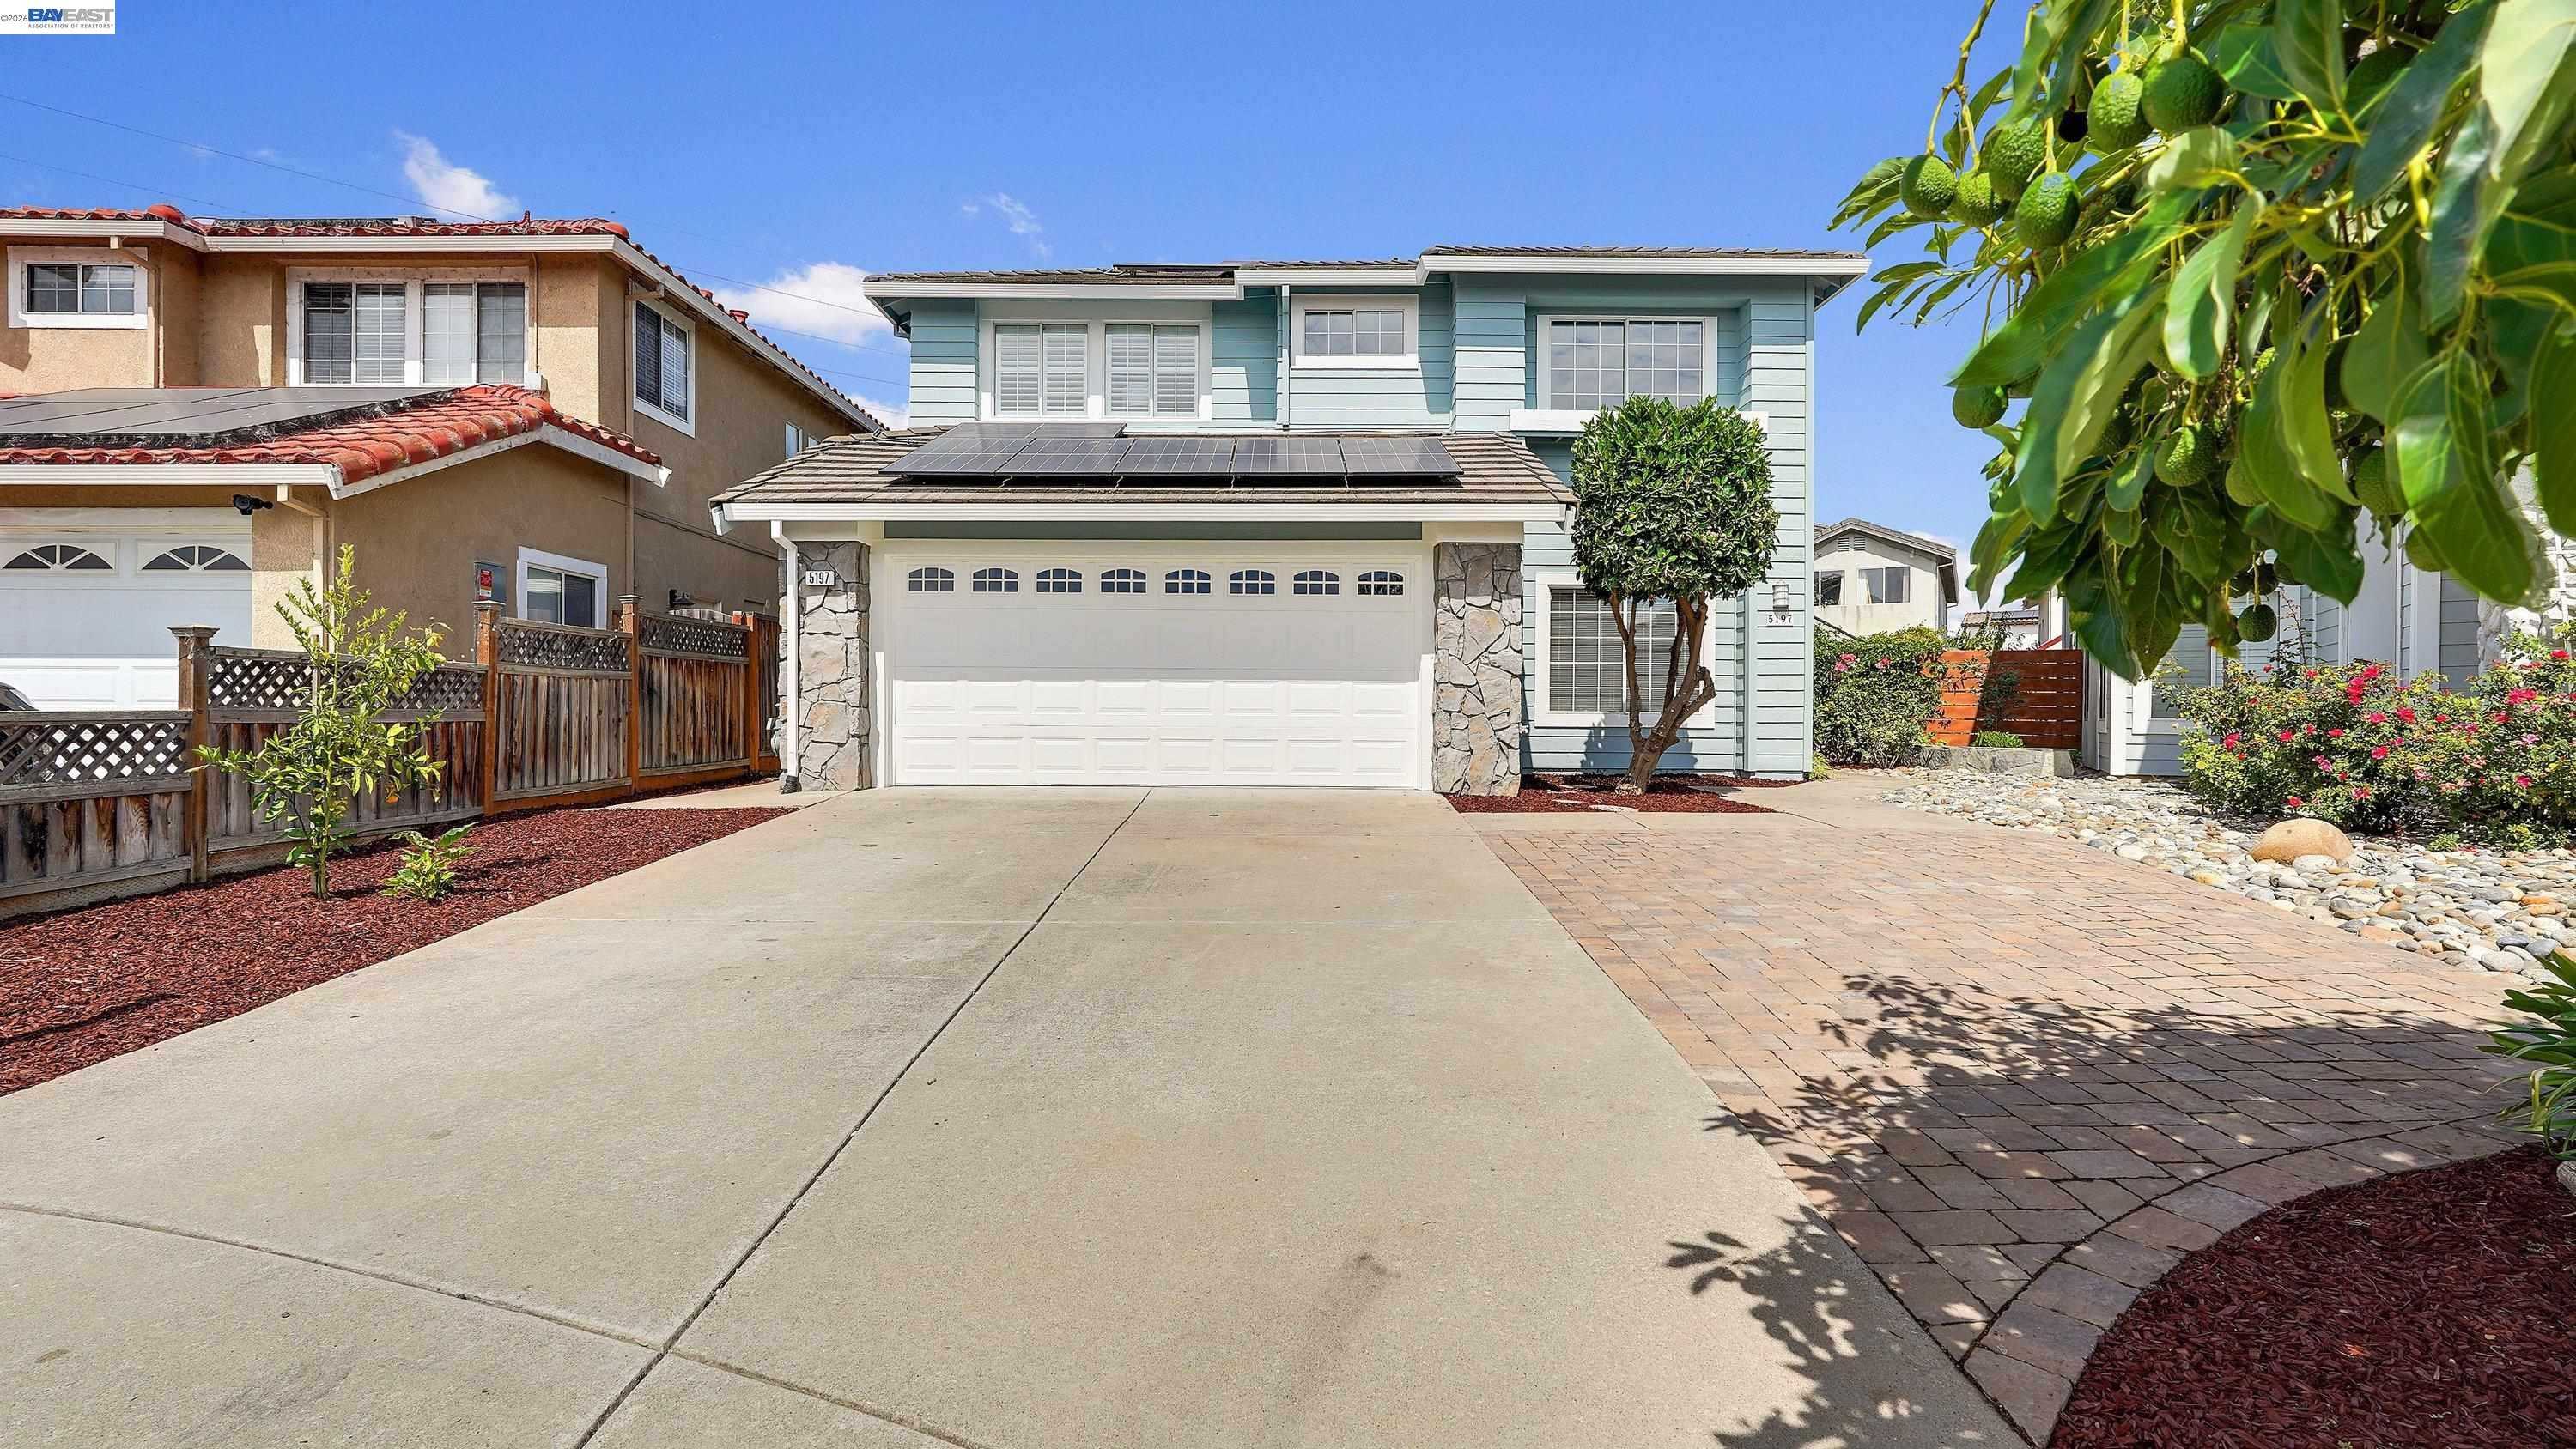
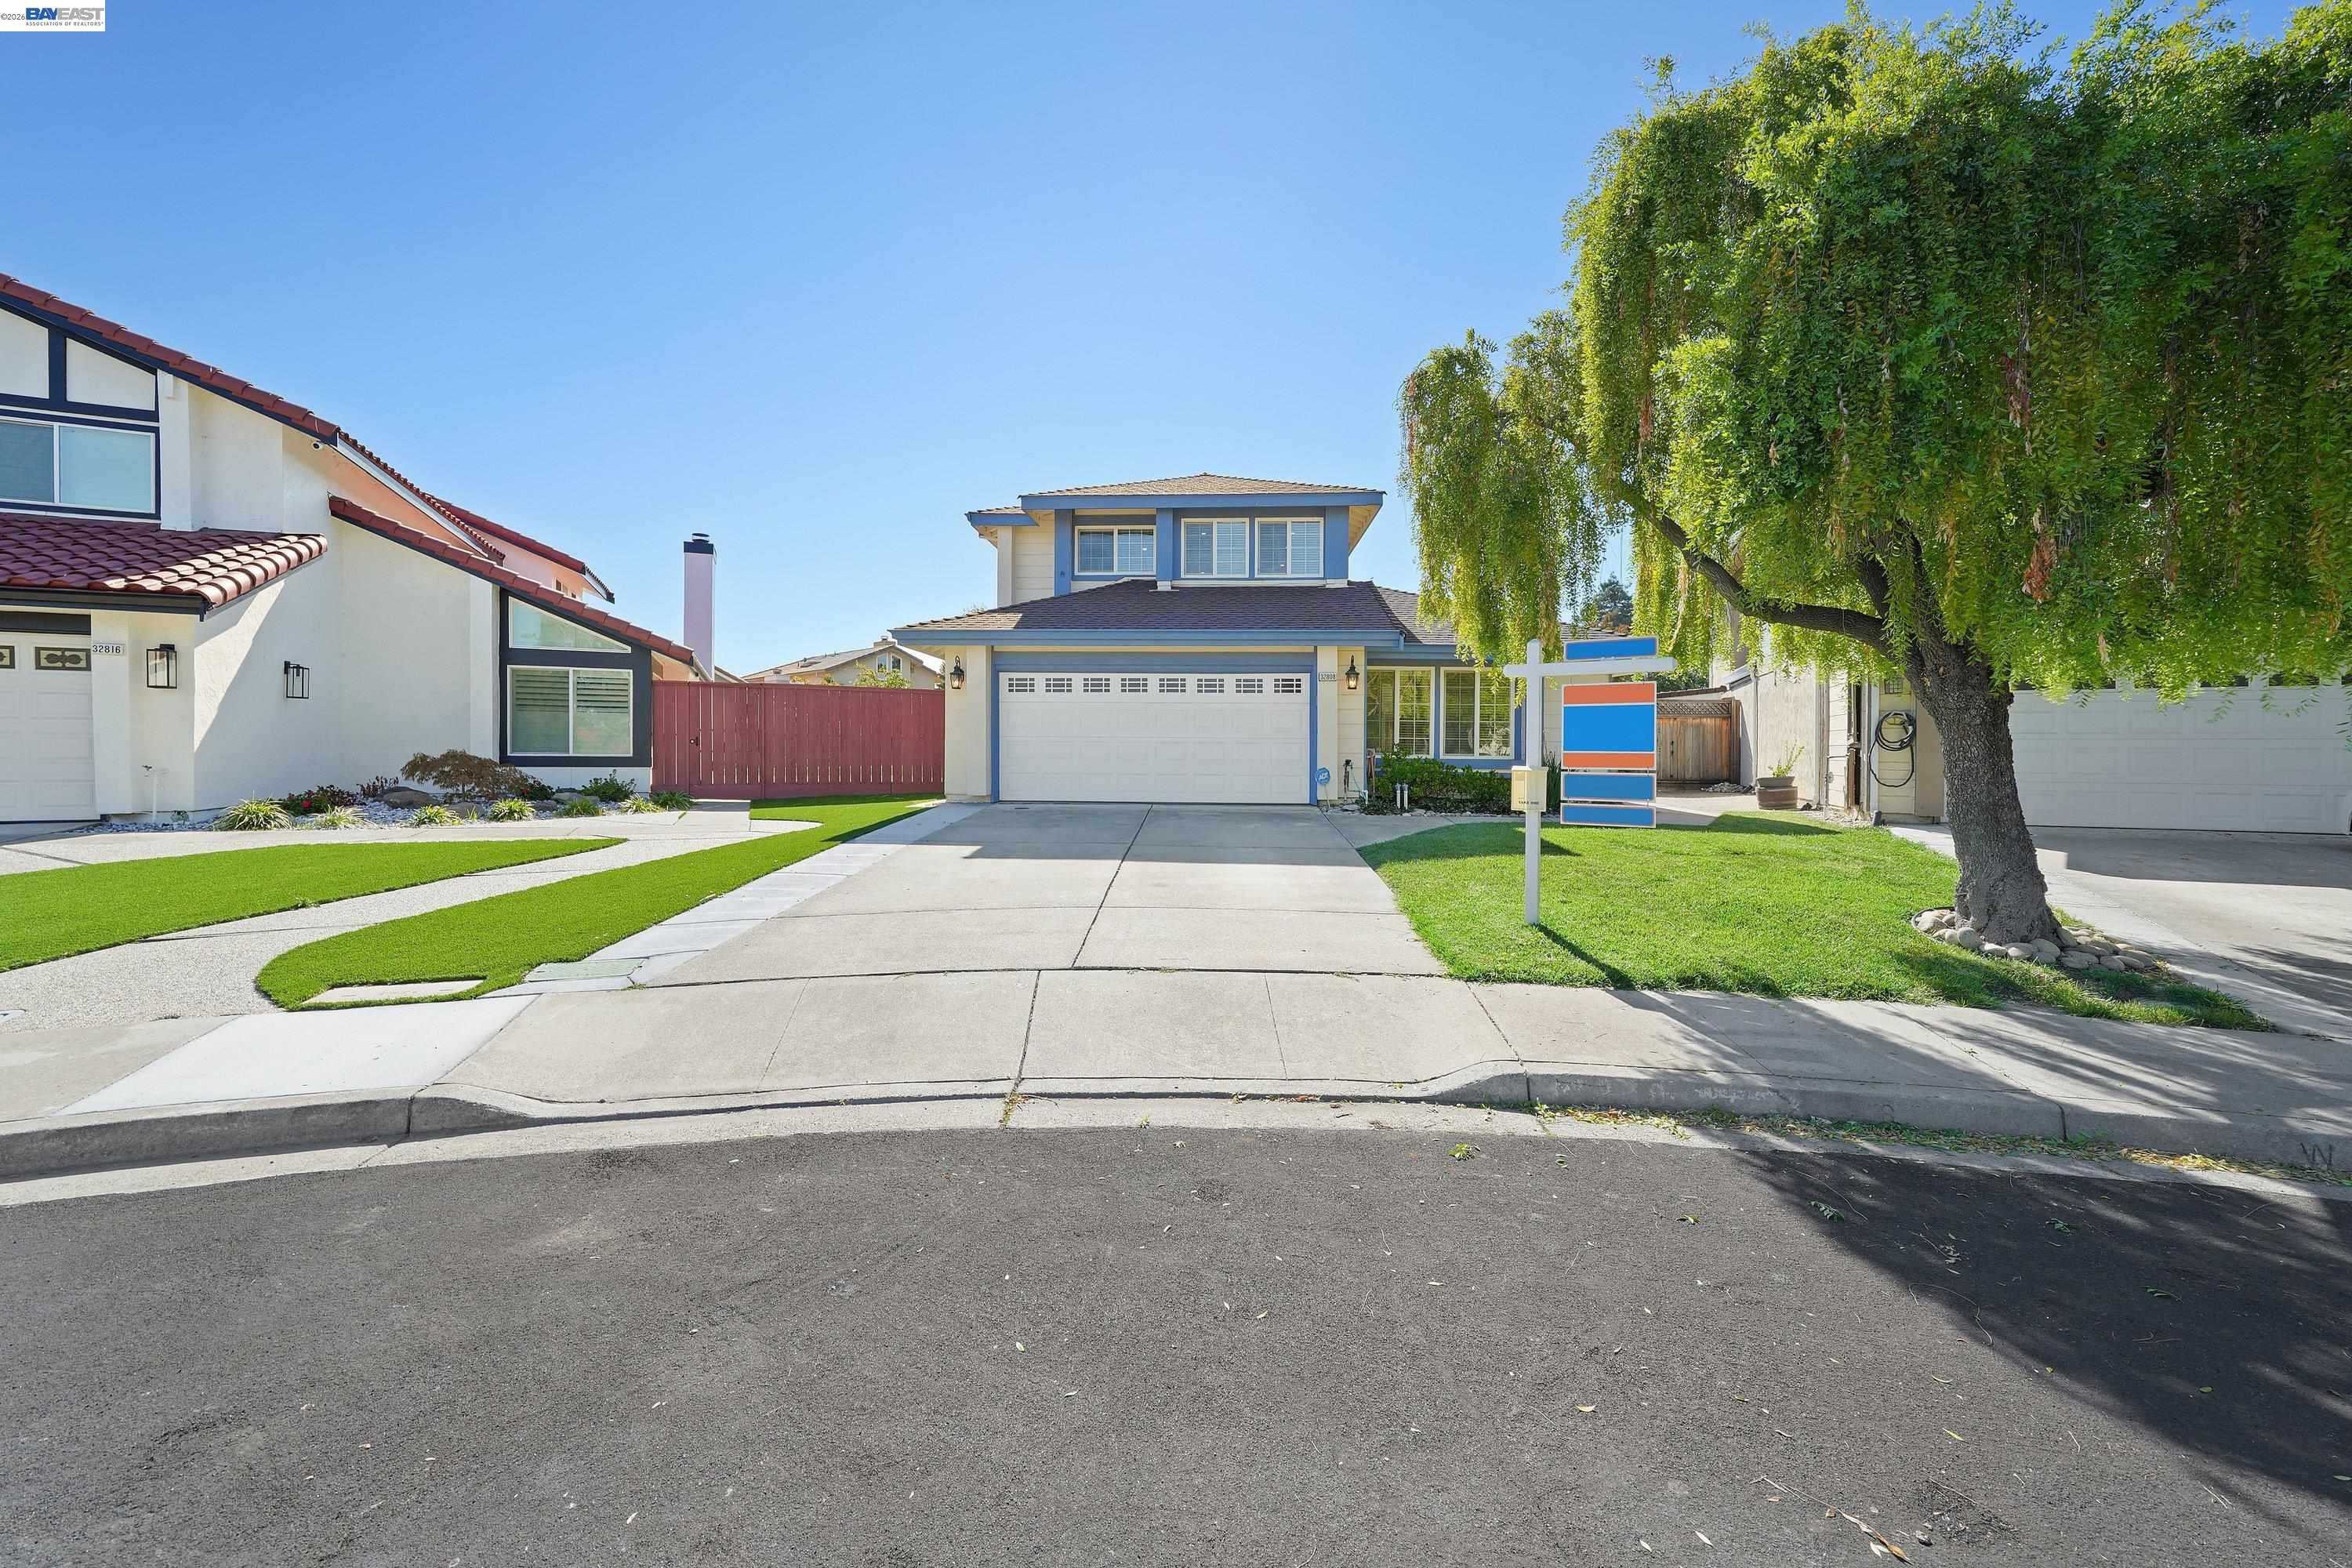
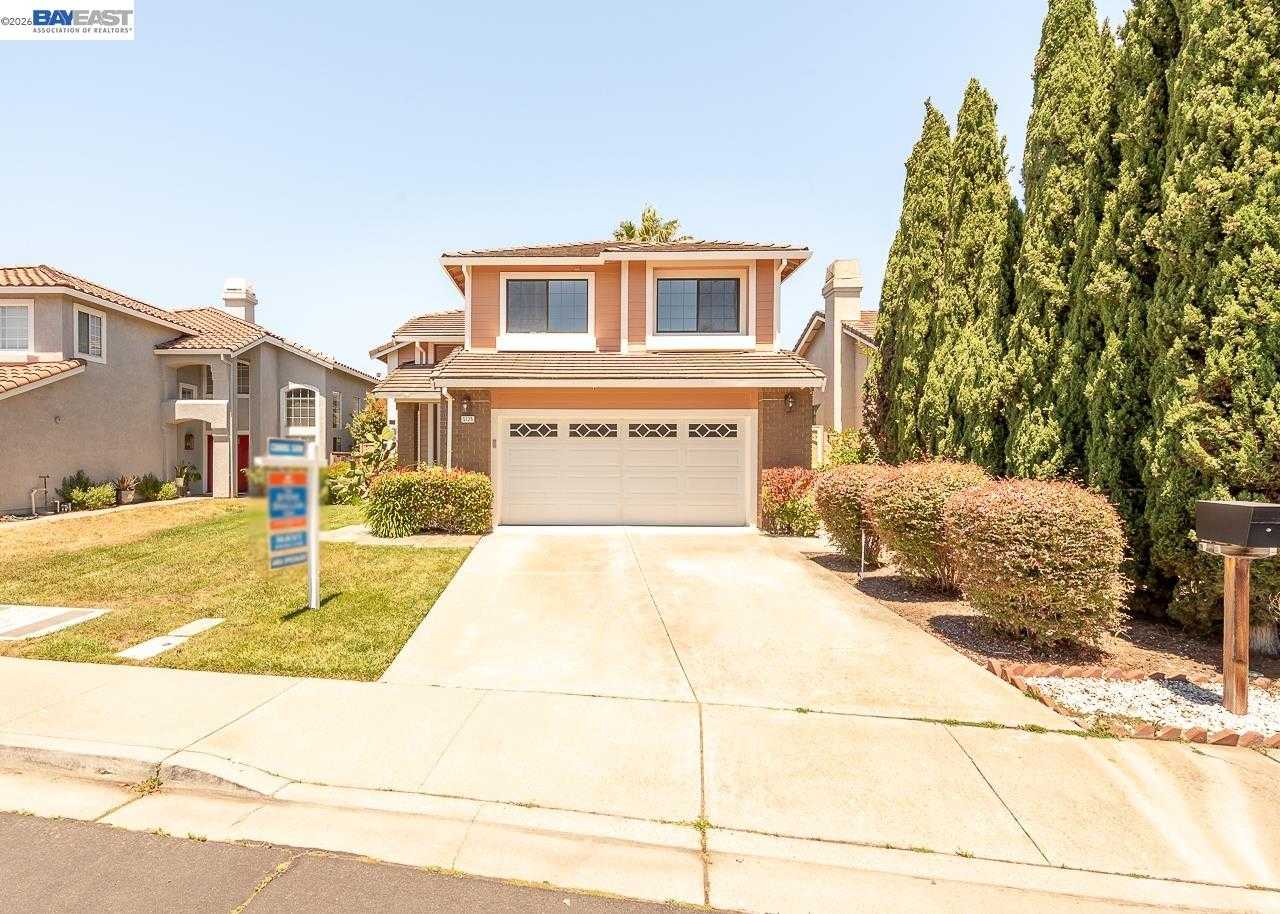
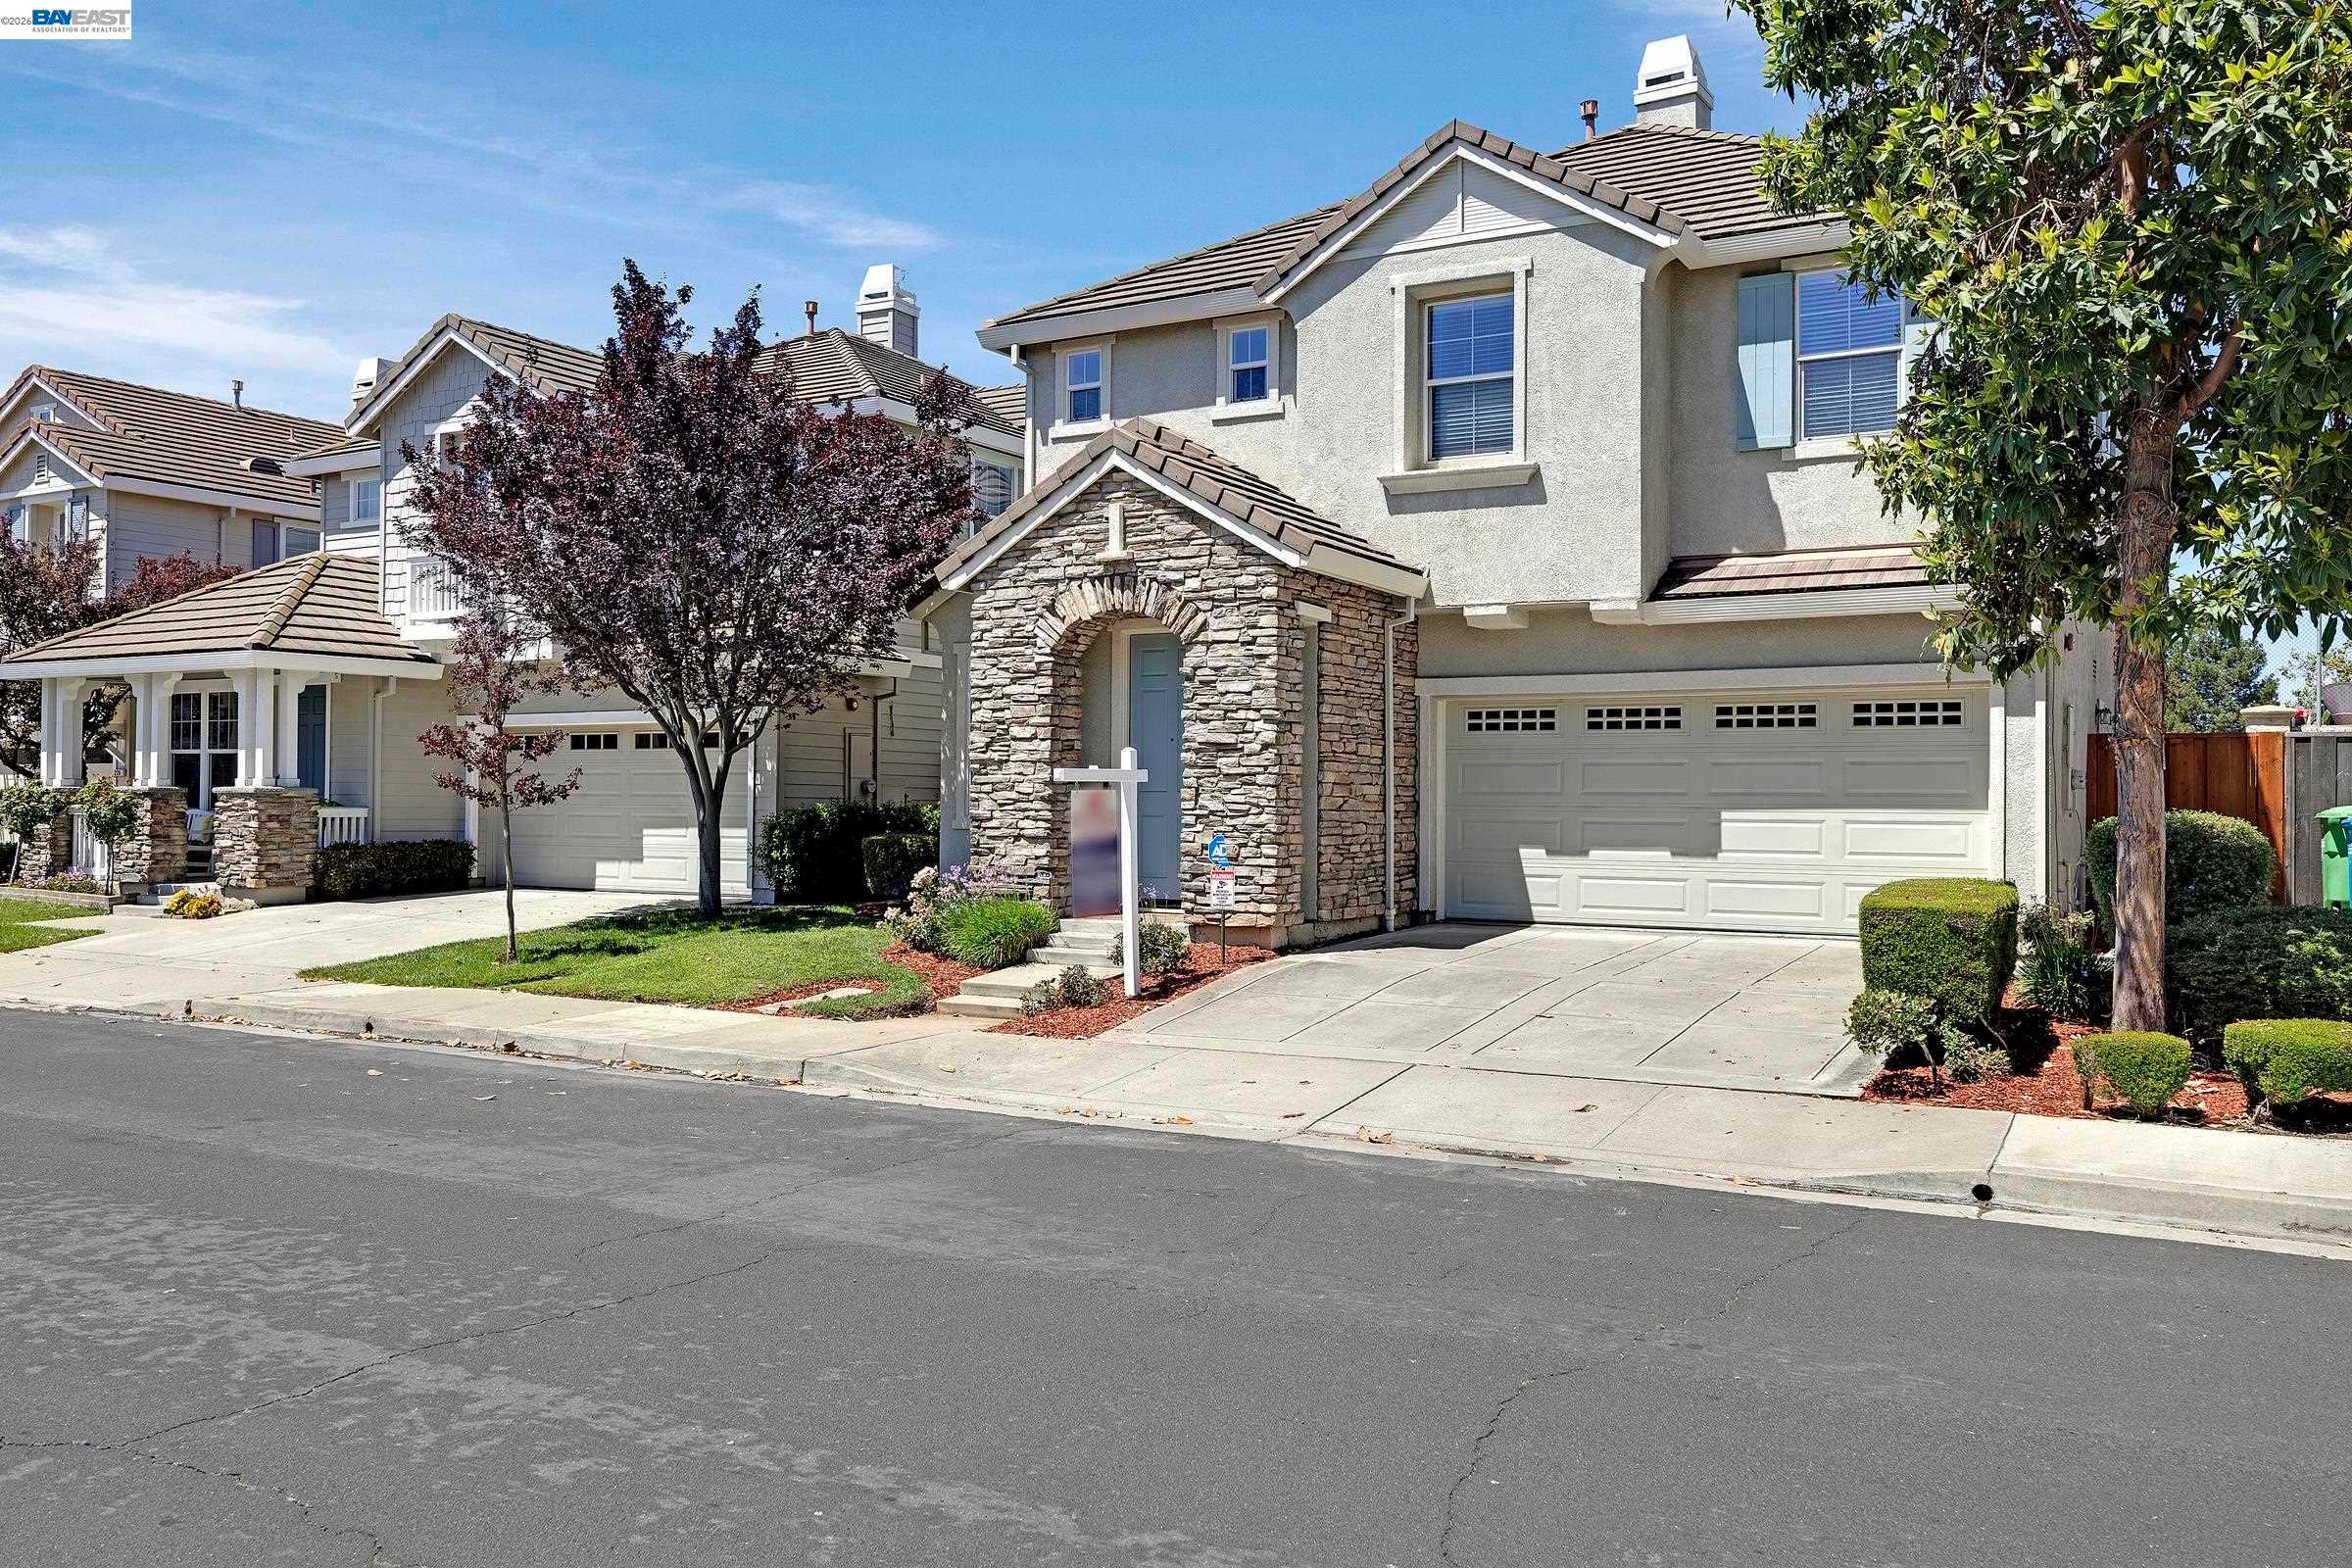
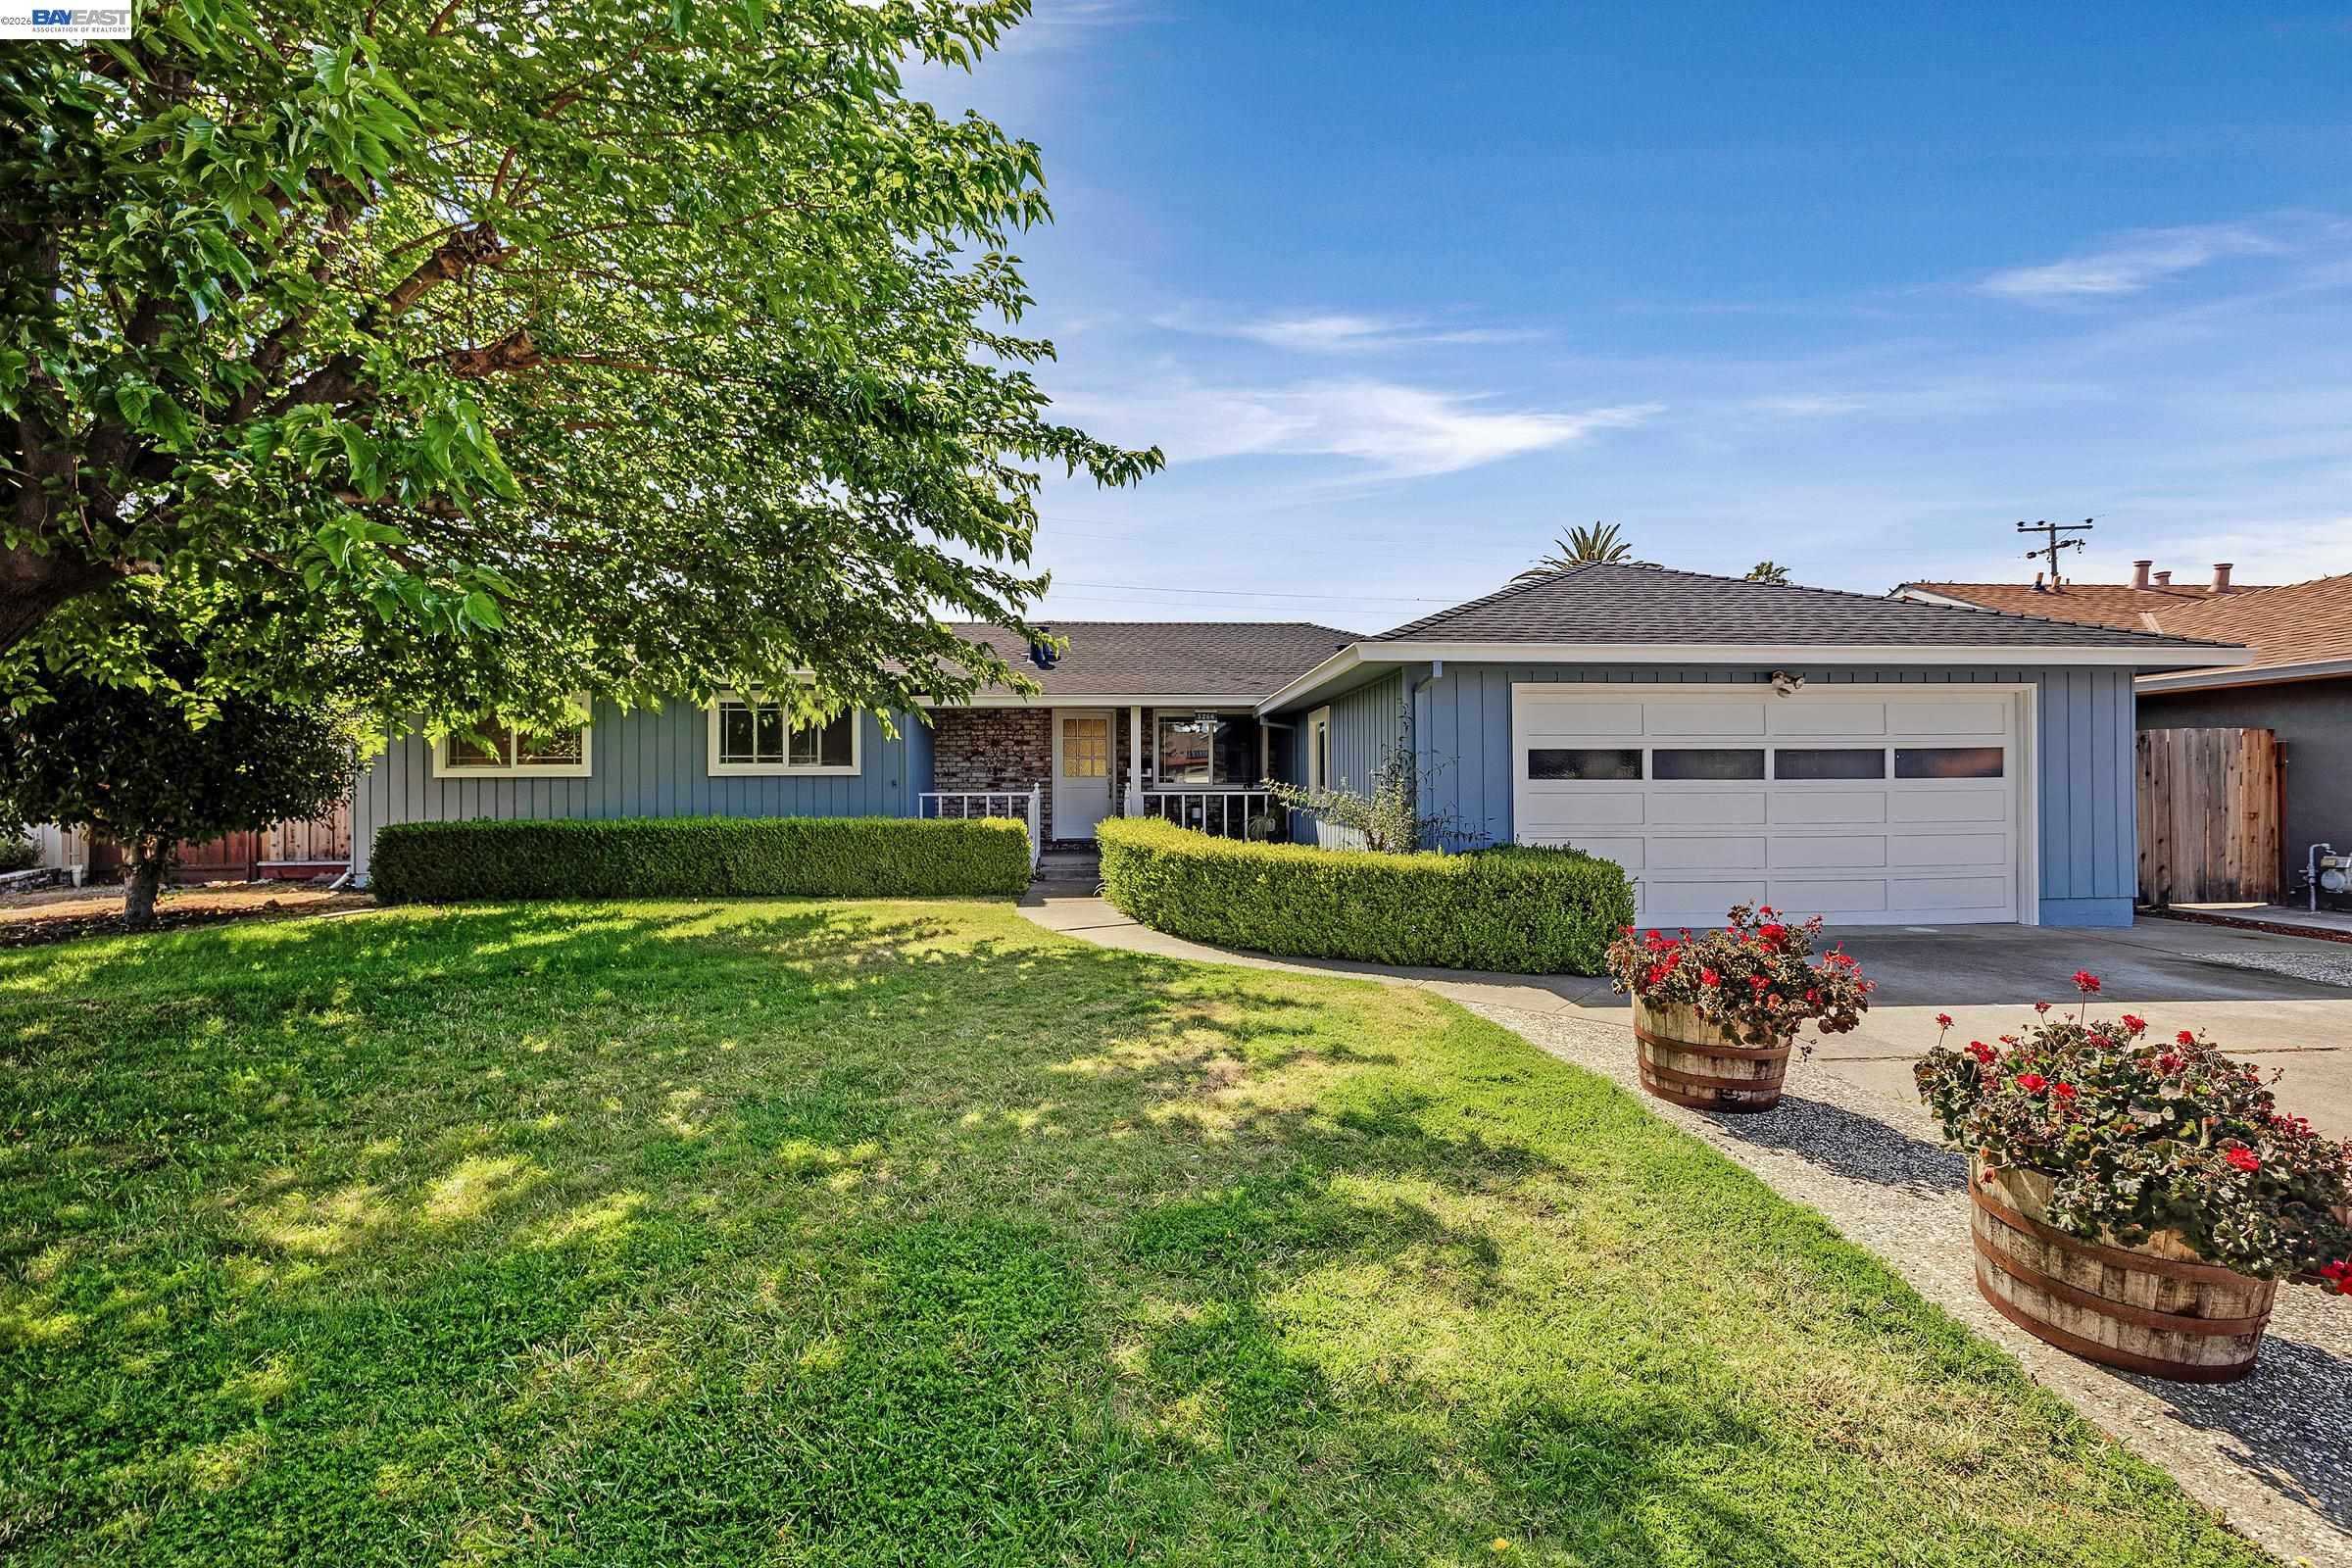
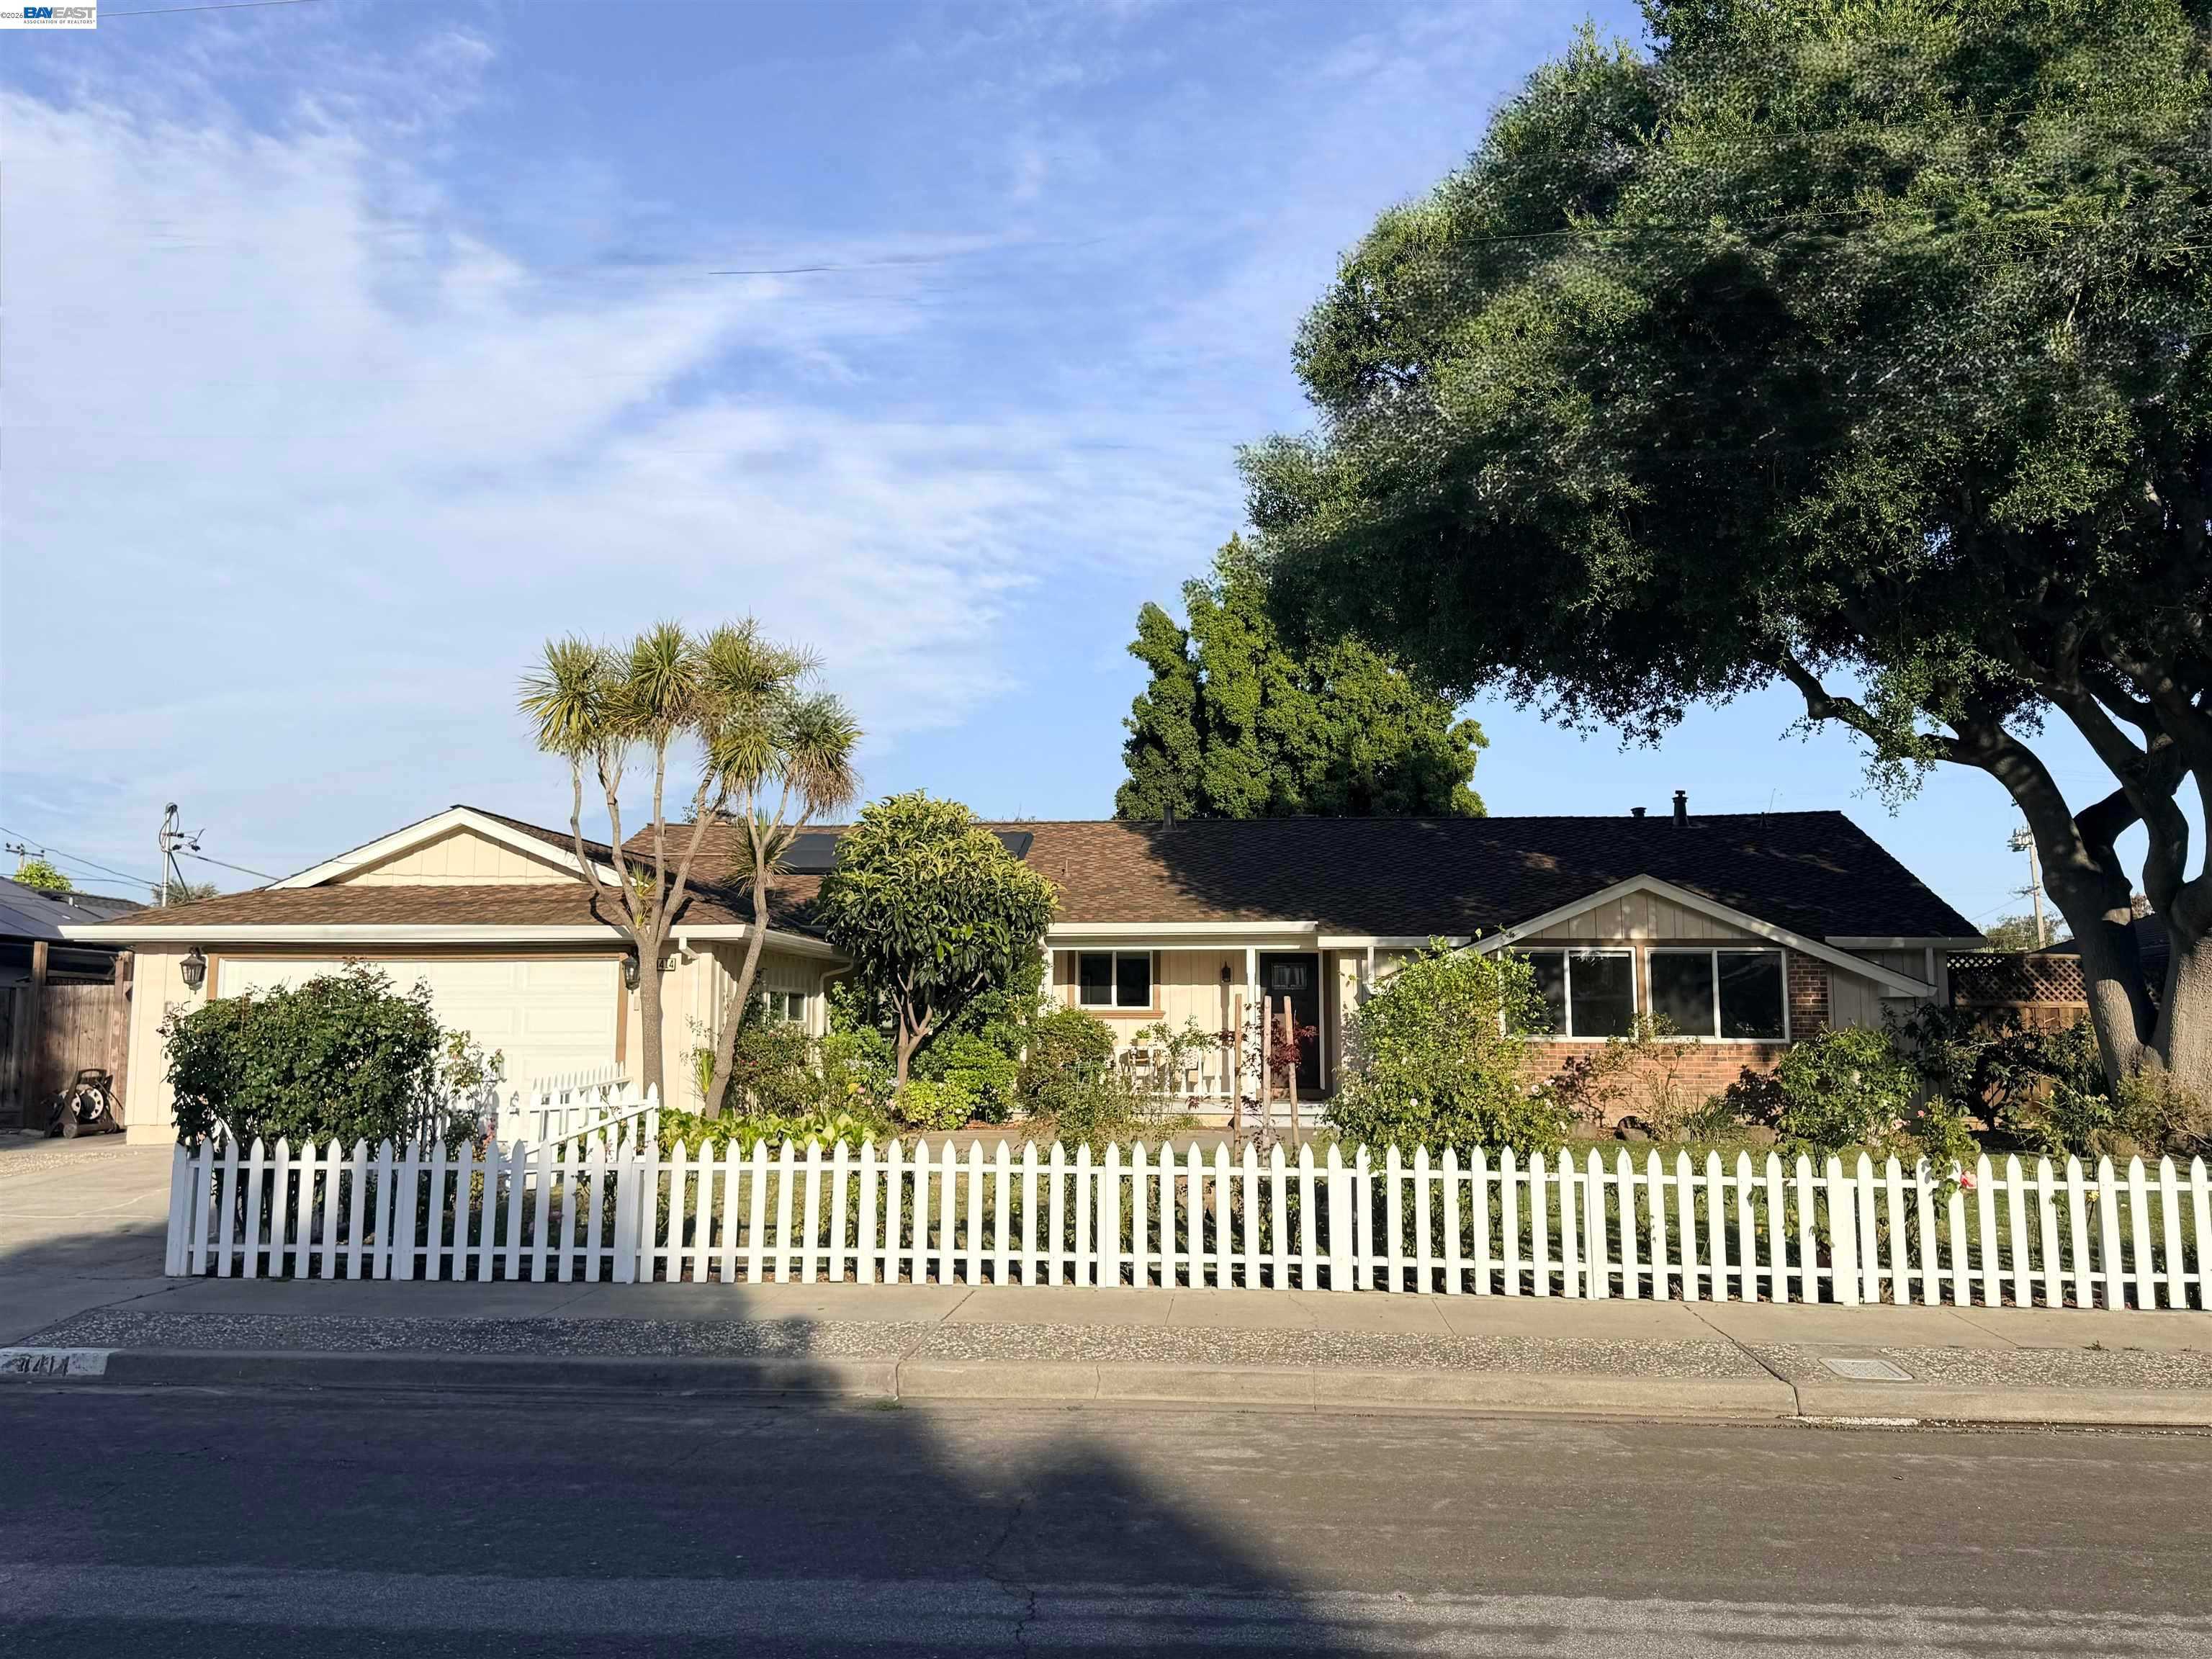
Behind these county totals: hundreds of homes still for sale in Fremont, Hayward, Union City, Newark and Milpitas, counted, priced and sorted every morning from the same MLS export, with a map search for the homes themselves.
30-Year Fixed: 7.48% -0.02 | 15-Year Fixed: 7.15% -0.02
Debt, and what it does to rates. This Sunday's big money story is Ray Dalio's warning about government and corporate debt. The federal debt passed $40 trillion on Aug. 18 and stood at $40.31 trillion on Oct. 8, per the Treasury. For a home buyer, the part that matters is the mortgage rate: Mortgage News Daily's 30-year fixed is 7.48% and the 15-year 7.15%, Friday's readings, with the 30-year up 1.10 points in a year.
The 3% math, done right. One widely read newsletter put the cost of a $400,000 loan at about $975 a month more than at 3%. The real gap is larger: $1,686 at 3% against $2,791 at today's 7.48%, or $1,105 more. Their figure is the gap at 7.00%.
On a local home. The median list price across Fremont, Hayward, Milpitas, Newark and Union City is $1,074,950. With 20% down, that is $3,626 a month at 3% and $6,001 today: $2,375 more, or about $28,500 a year. That gap is why so many owners with low rates stay put, which keeps listings thin.
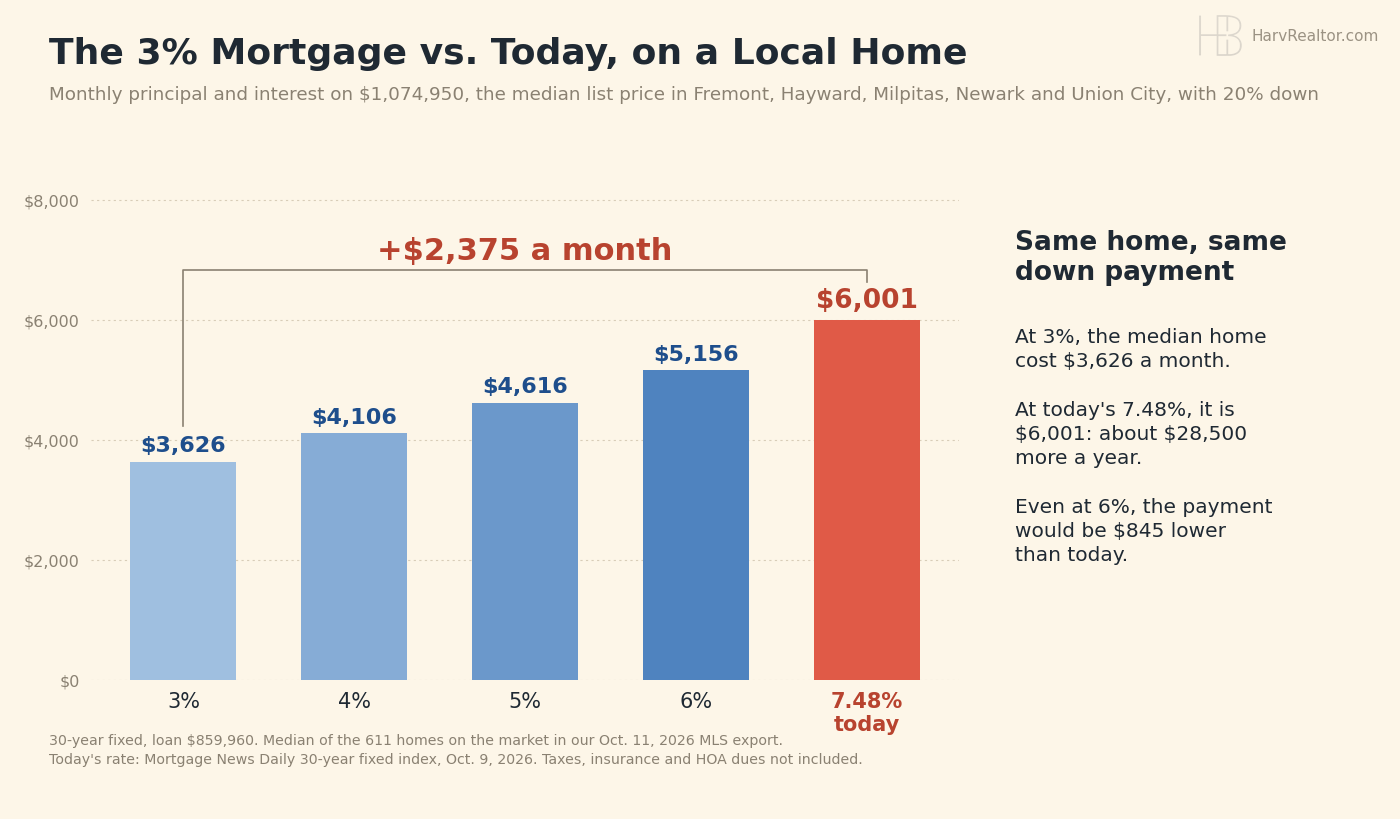
What it means for you. Waiting for 3% is a plan; it just isn't a schedule. Even at 6%, the median payment would be $845 lower than today, so if you are buying, a refinance later is a realistic hope, not a promise. If you are selling, price against today's payment, not last spring's.
Today's count. Board wide: 2,662 listings across the 15 city table, counting active and in contract together, with 154 coming soon and 236 brand new. The five city ledger carries 684 live listings across Fremont, Hayward, Milpitas, Newark and Union City, 611 on the market and 73 coming soon, down from 688.
Fremont holds 239 live listings: 195 active, 26 coming soon and 18 brand new, with a median on market list price of $1,275,000 at $797 a square foot and a typical listing out 33 days. Hayward carries 192, Milpitas 100, Newark 91 and Union City 62. Across all five cities the median is $1,074,950 at $676 a square foot, 288 homes are priced under a million, and 148 have been sitting 60 days or longer.
S&P 500: 7,811.54 +0.59% | Dow: 51,654.95 +0.83% | Nasdaq: 27,366.17 +0.64%
Closed for the weekend. The numbers above are Friday's close, when all three averages rose and finished the week higher. The S&P 500 is up 14.1% this year and the Nasdaq 17.7%. Monday is Columbus Day: stocks trade, the bond market does not. Earnings season starts Tuesday with JPMorgan, Wells Fargo, Citigroup and Johnson & Johnson.
10-Year Treasury: 5.24% +0.02 | Gold: $4,216.30 +1.43% | Silver: $61.05 +2.73% | Brent Crude: $104.72 +0.42%
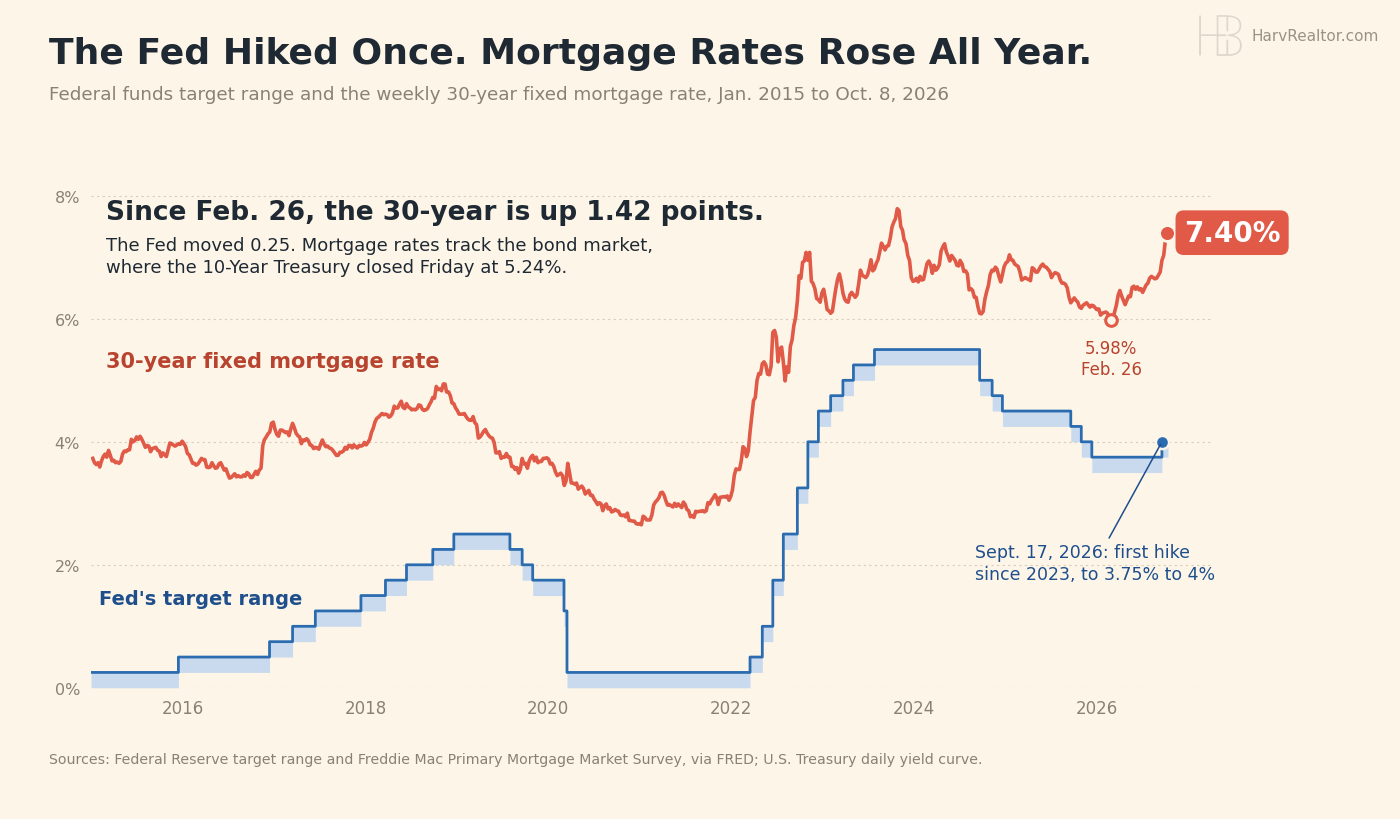
The Fed moved once. The Fed raised its target range to 3.75% to 4% on Sept. 17, its first hike since July 2023, with inflation at 3.4% in August. Mortgage rates did not wait: Freddie Mac's weekly 30-year rose from 5.98% on Feb. 26 to 7.40% on Oct. 8, while the Fed moved a quarter point. Mortgages follow the 10-Year Treasury, which closed Friday at 5.24%. The Fed gets the headlines; the bond market sends the bill.
Metals. Gold settled Friday at $4,216.30, up 1.43%, silver at $61.05, up 2.73%, and Brent at $104.72, up 0.42%.
Bitcoin: $83,793 +1.01% | Ethereum: $2,538.48 +1.22% | XRP: $1.41 +0.80%
The weekend shift. Bitcoin is up 1.01% over 24 hours near $83,800, Ether up 1.22% and XRP up 0.80%, live from CoinGecko at 11:33 AM PT. Crypto trades all weekend, so these are the only live numbers on this page.
Sources
- Our daily MLS export of October 11, 2026 (median list price of 611 homes on the market in five cities)
- Mortgage News Daily (30 year and 15 year index, October 9)
- U.S. Treasury (10-Year daily yield curve, October 9) and Debt to the Penny (October 8)
- Federal Reserve target range and Freddie Mac 30-year, via FRED
- Bureau of Labor Statistics (CPI, August)
- CNBC quotes (index closes, COMEX and ICE settlements, October 9)
- CoinGecko (live crypto, 11:33 AM PT October 11)
- REALTY EXPERTS® Live Inventory (five city ledger, October 11)
Disclaimer: The market data, rates, and information provided are for informational purposes only and should not be considered financial advice. Always verify rates and data with your lender or financial advisor before making any decisions.
Based on information from the Bay East Association of REALTORS® (Bay East MLS) as of October 11, 2026. All data, including all measurements and calculations of area, is obtained from various sources and has not been, and will not be, verified by broker or MLS. All information should be independently reviewed and verified for accuracy. Properties may or may not be listed by the office/agent presenting the information.