



"At a Glance" Local Housing STATS and News 10/10/26
October 10, 2026 · Alameda County Market Dashboard
TODAY'S LIVE INVENTORY
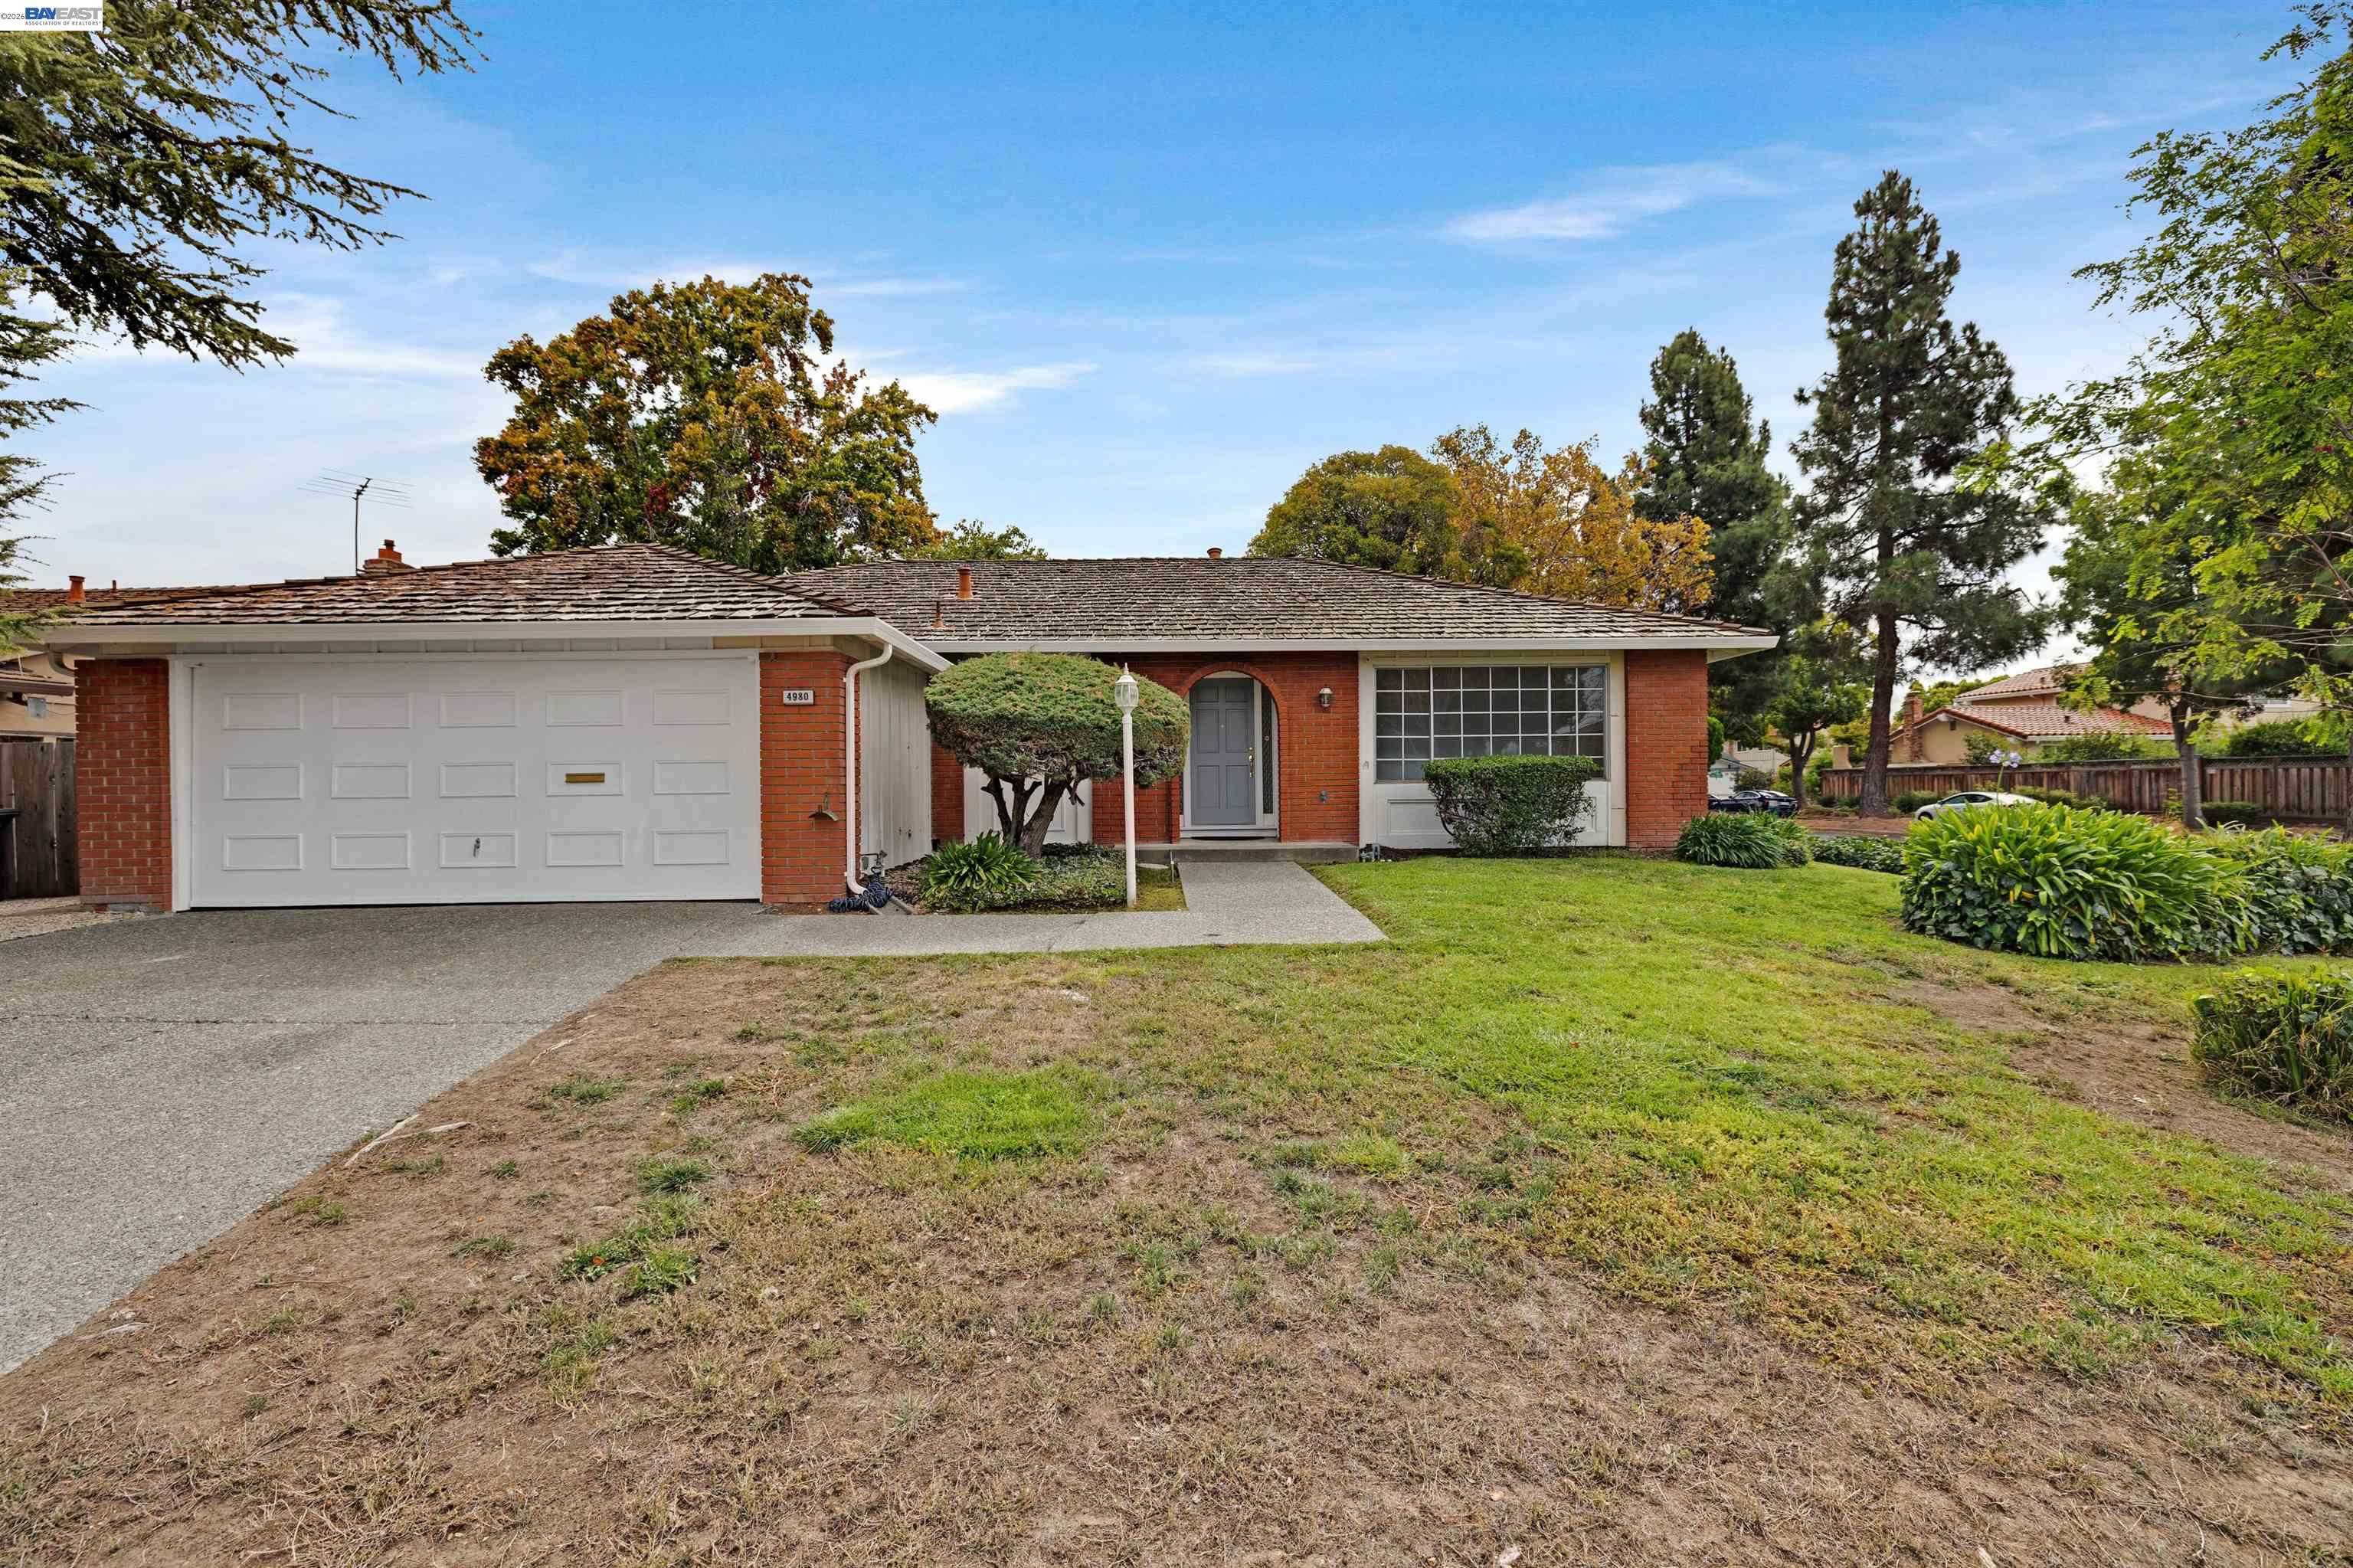
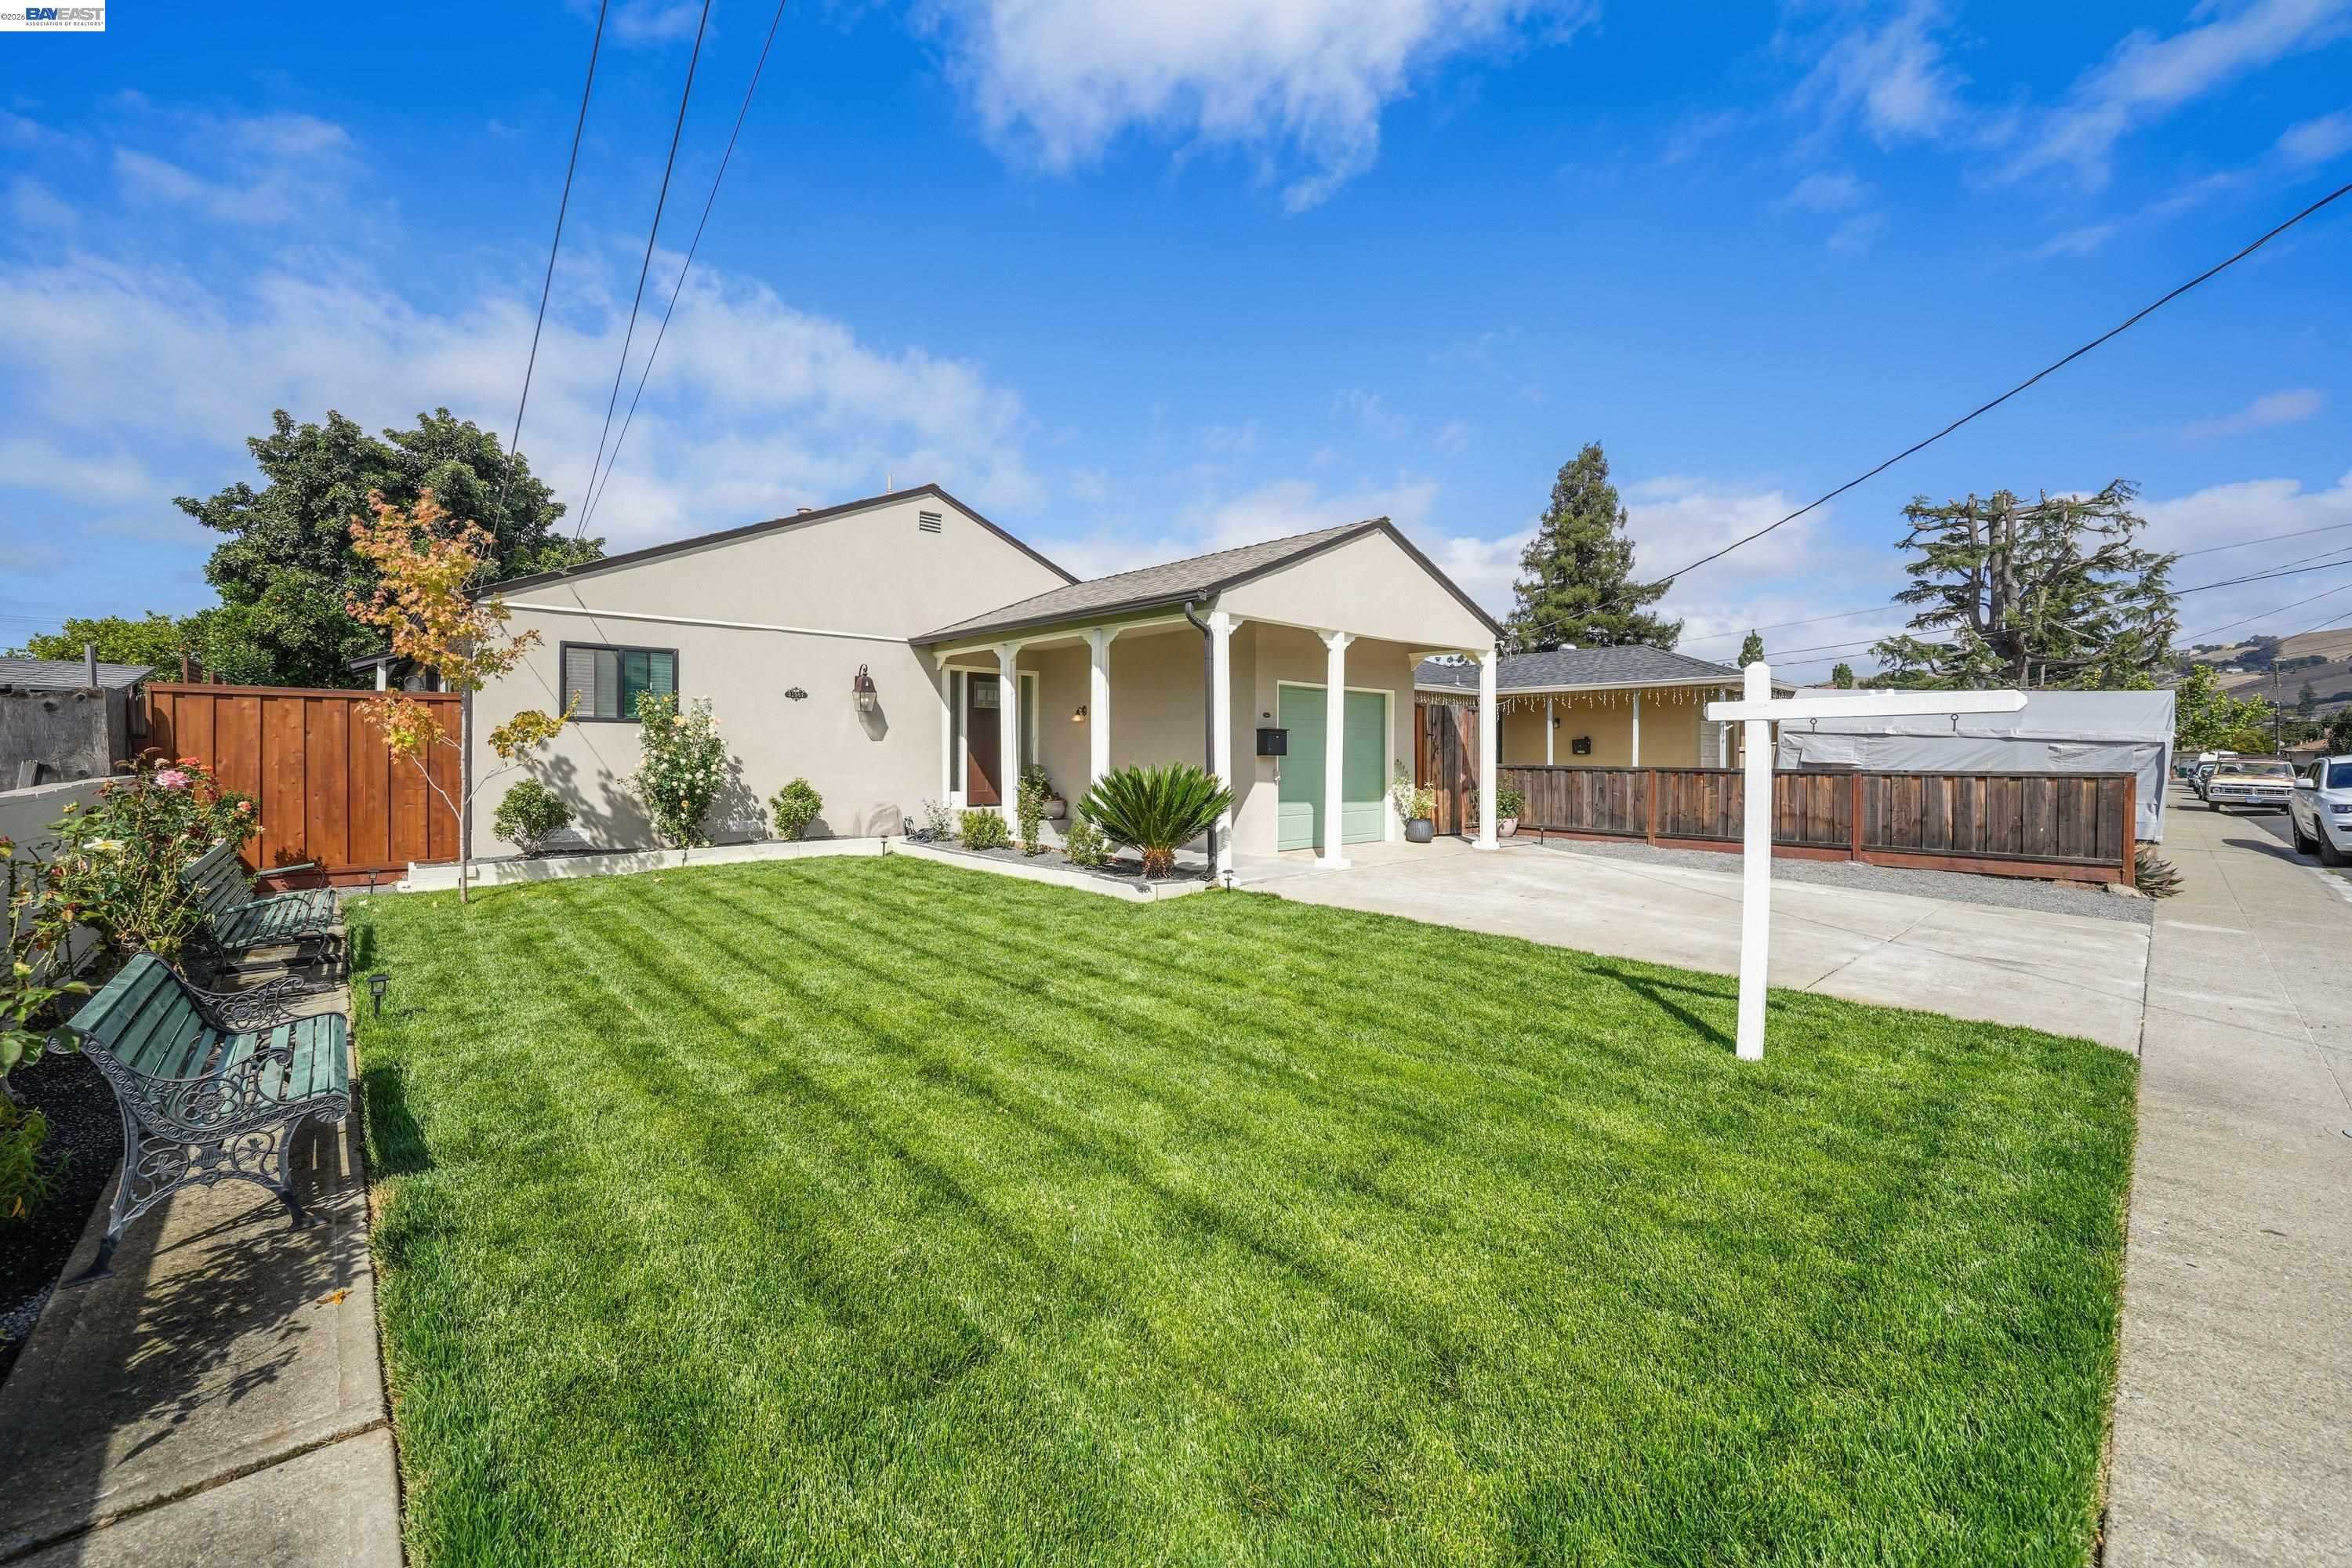
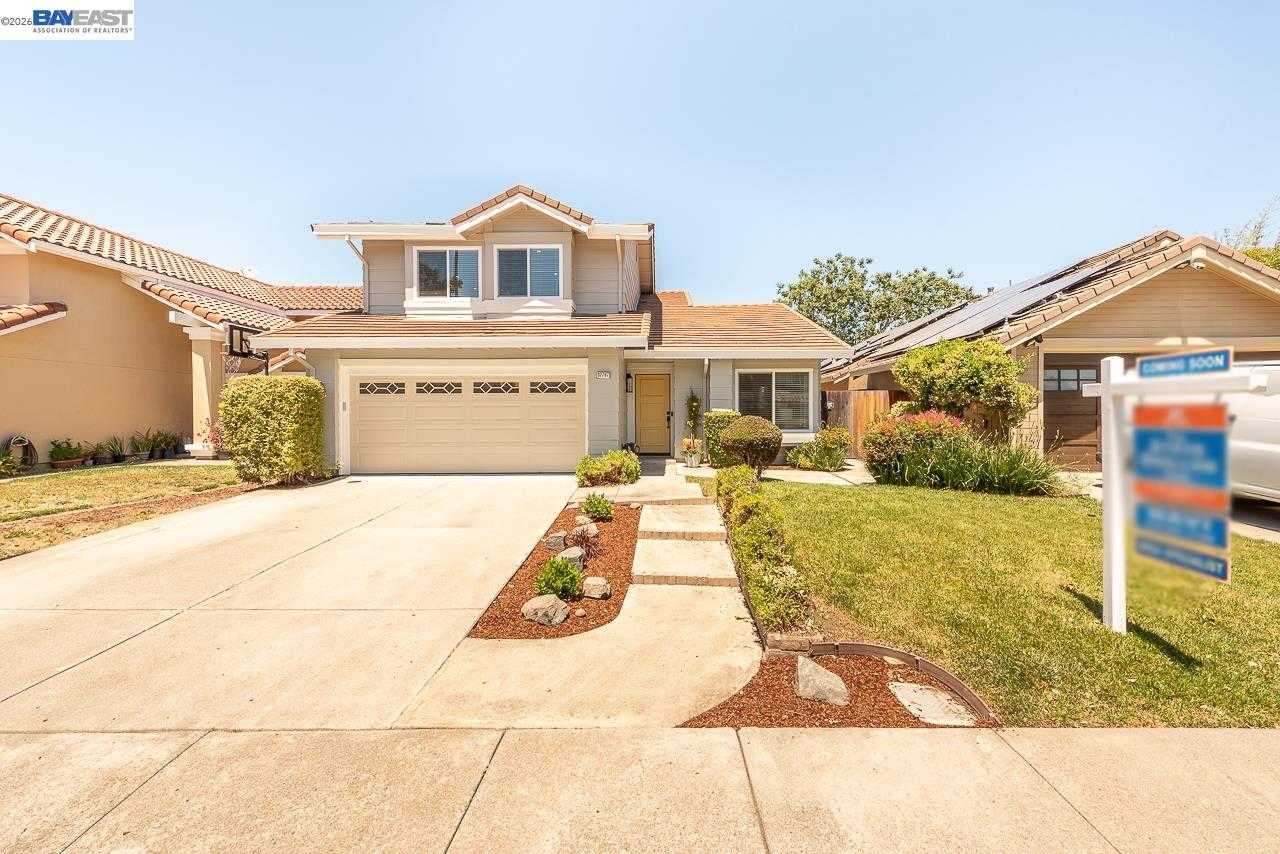
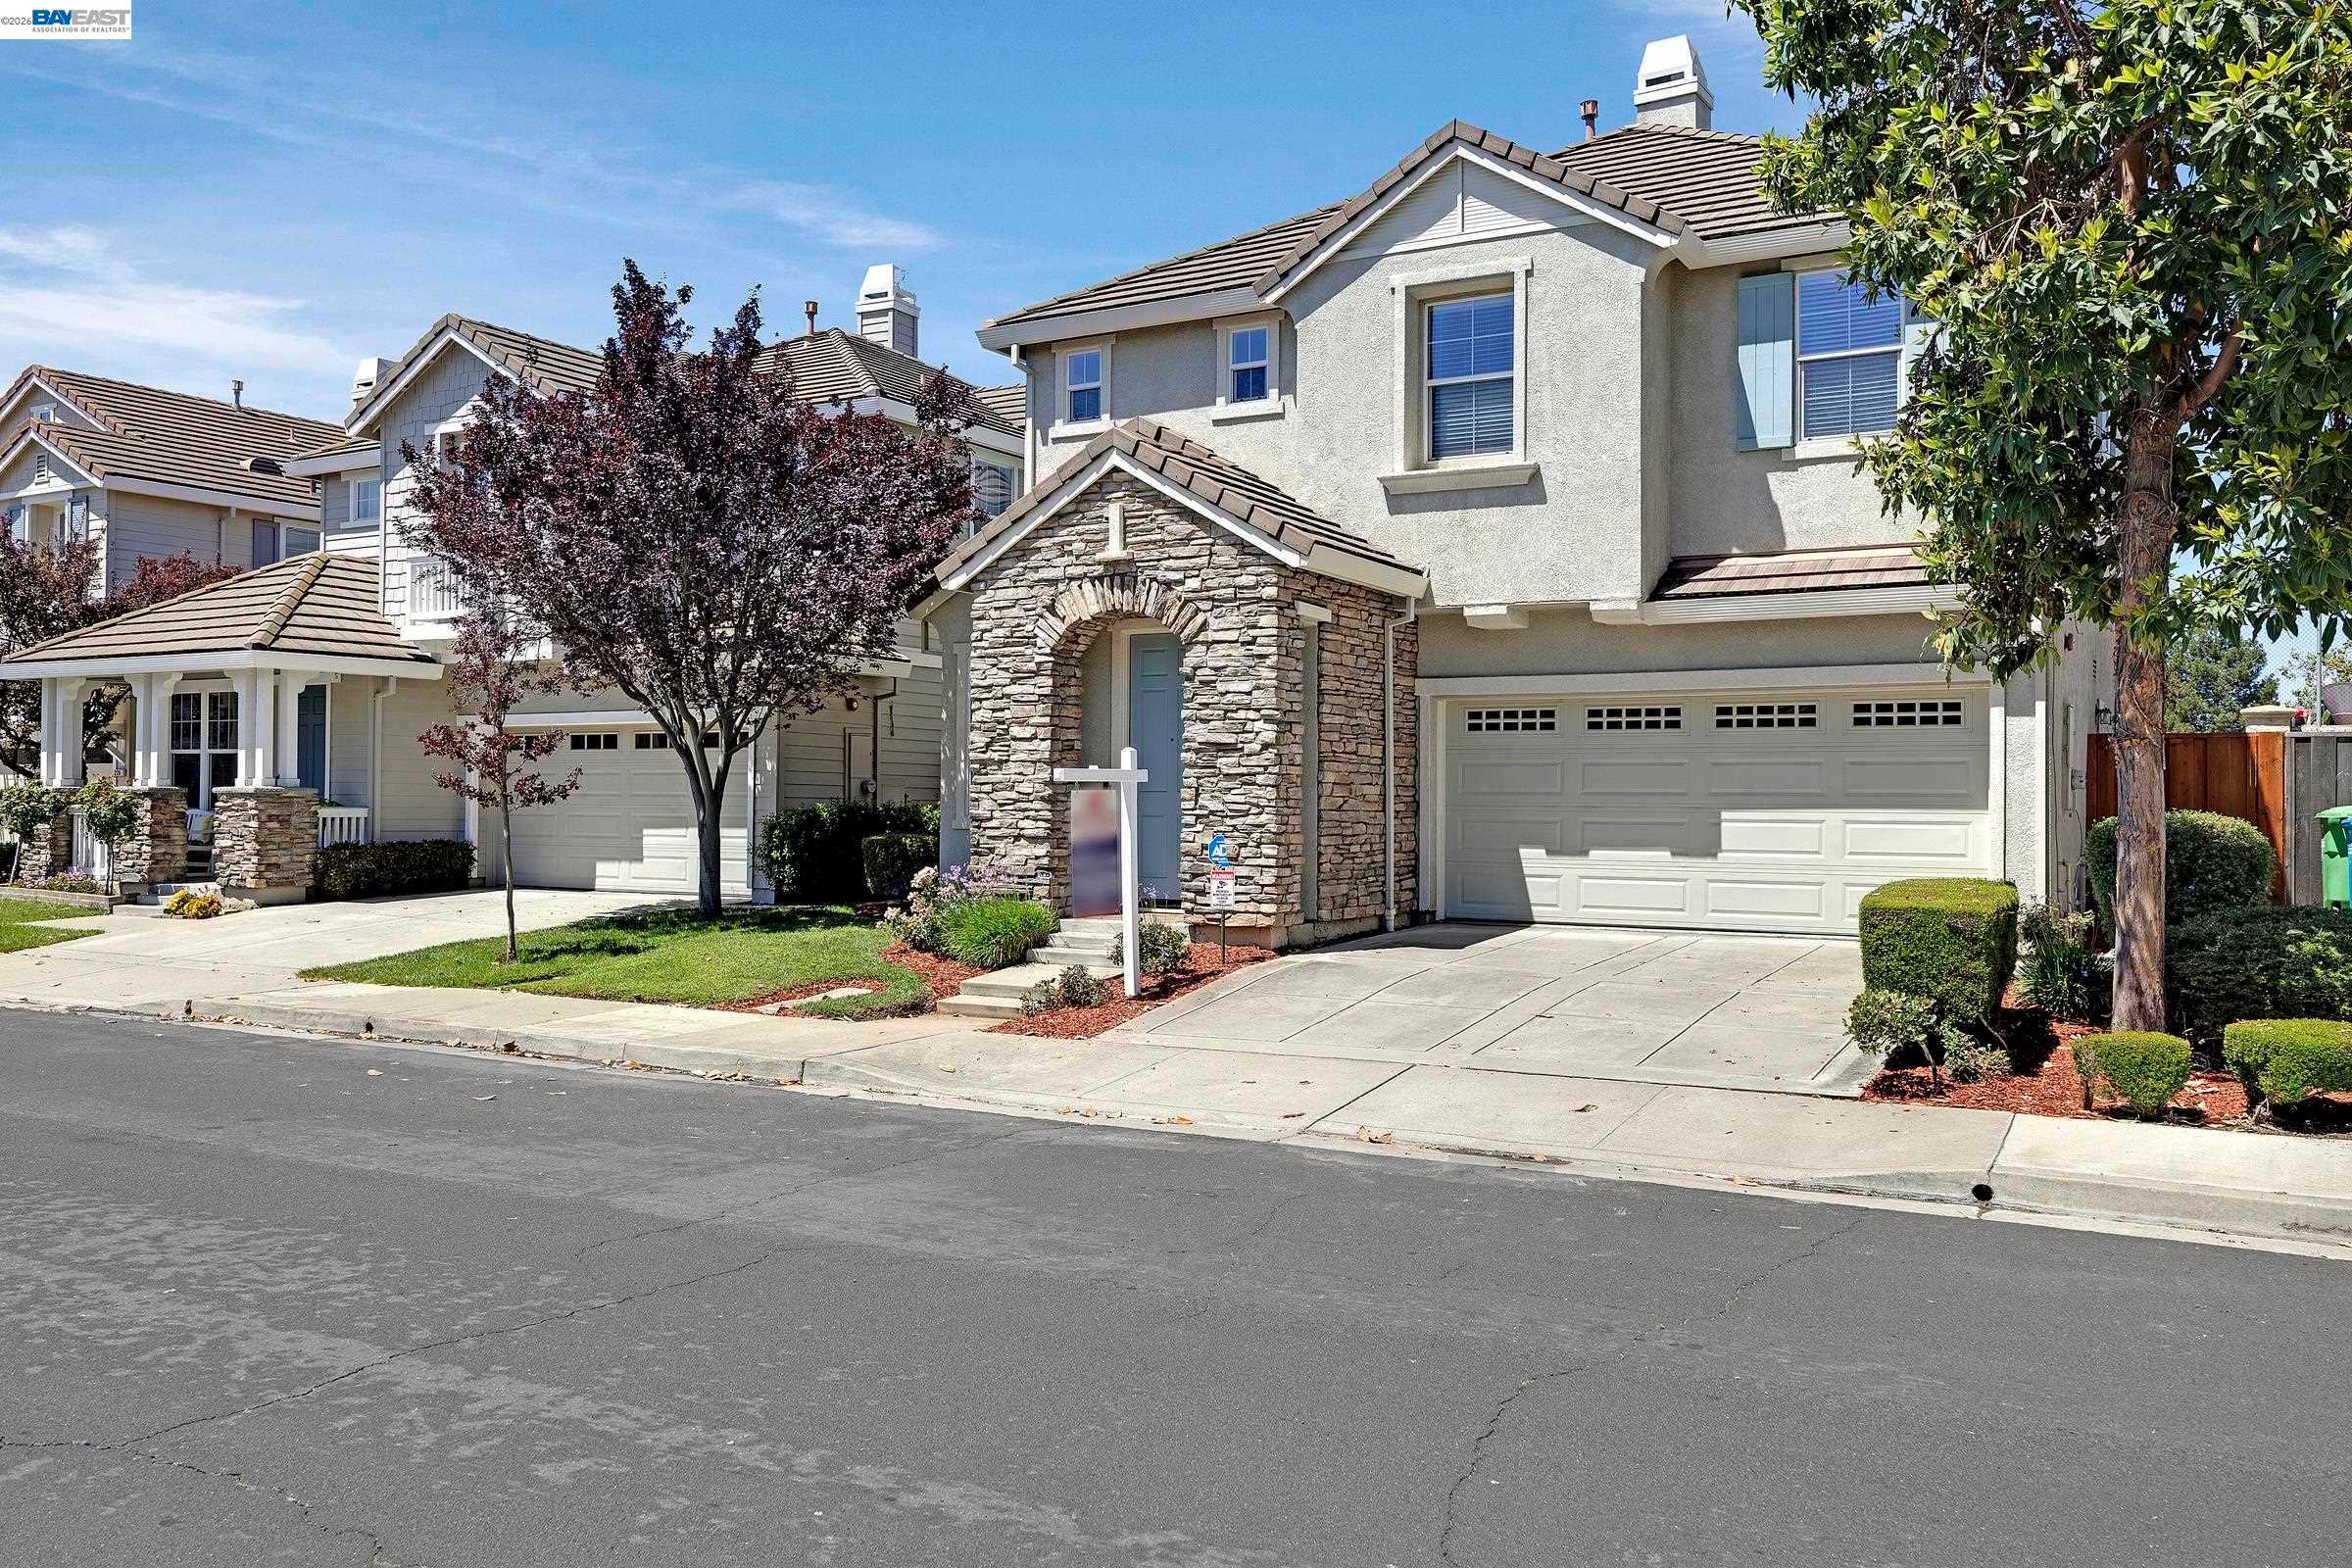
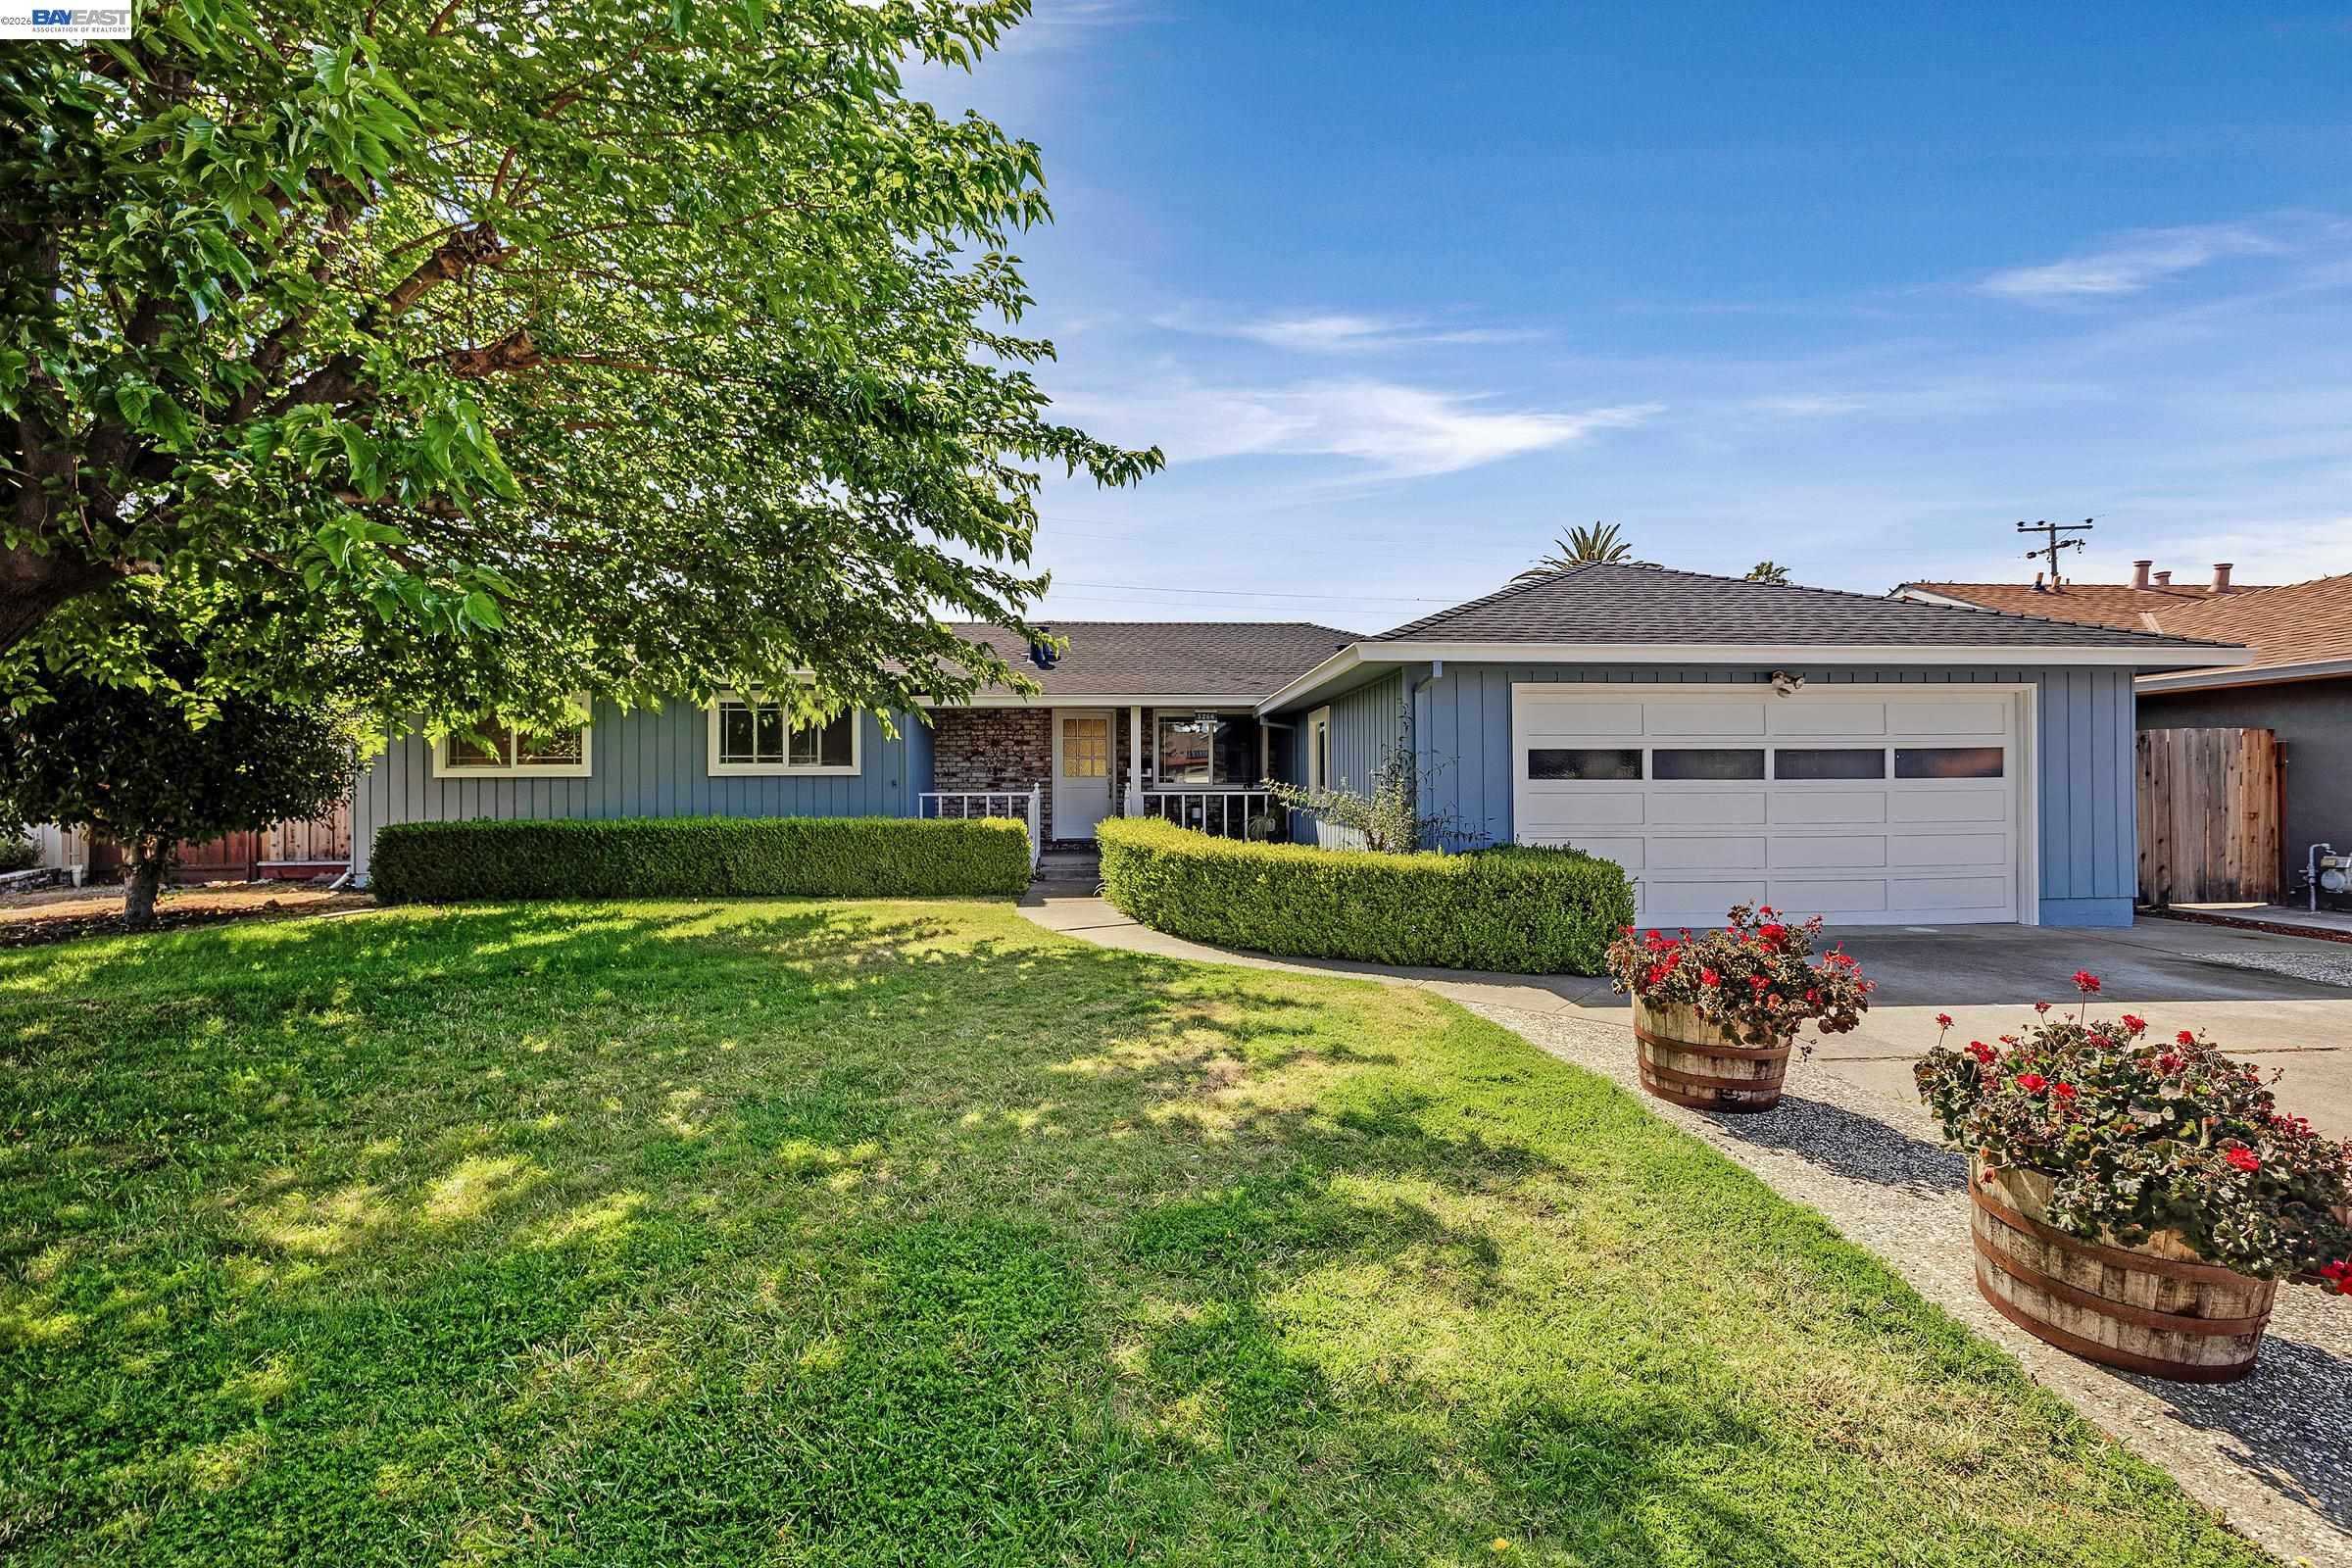
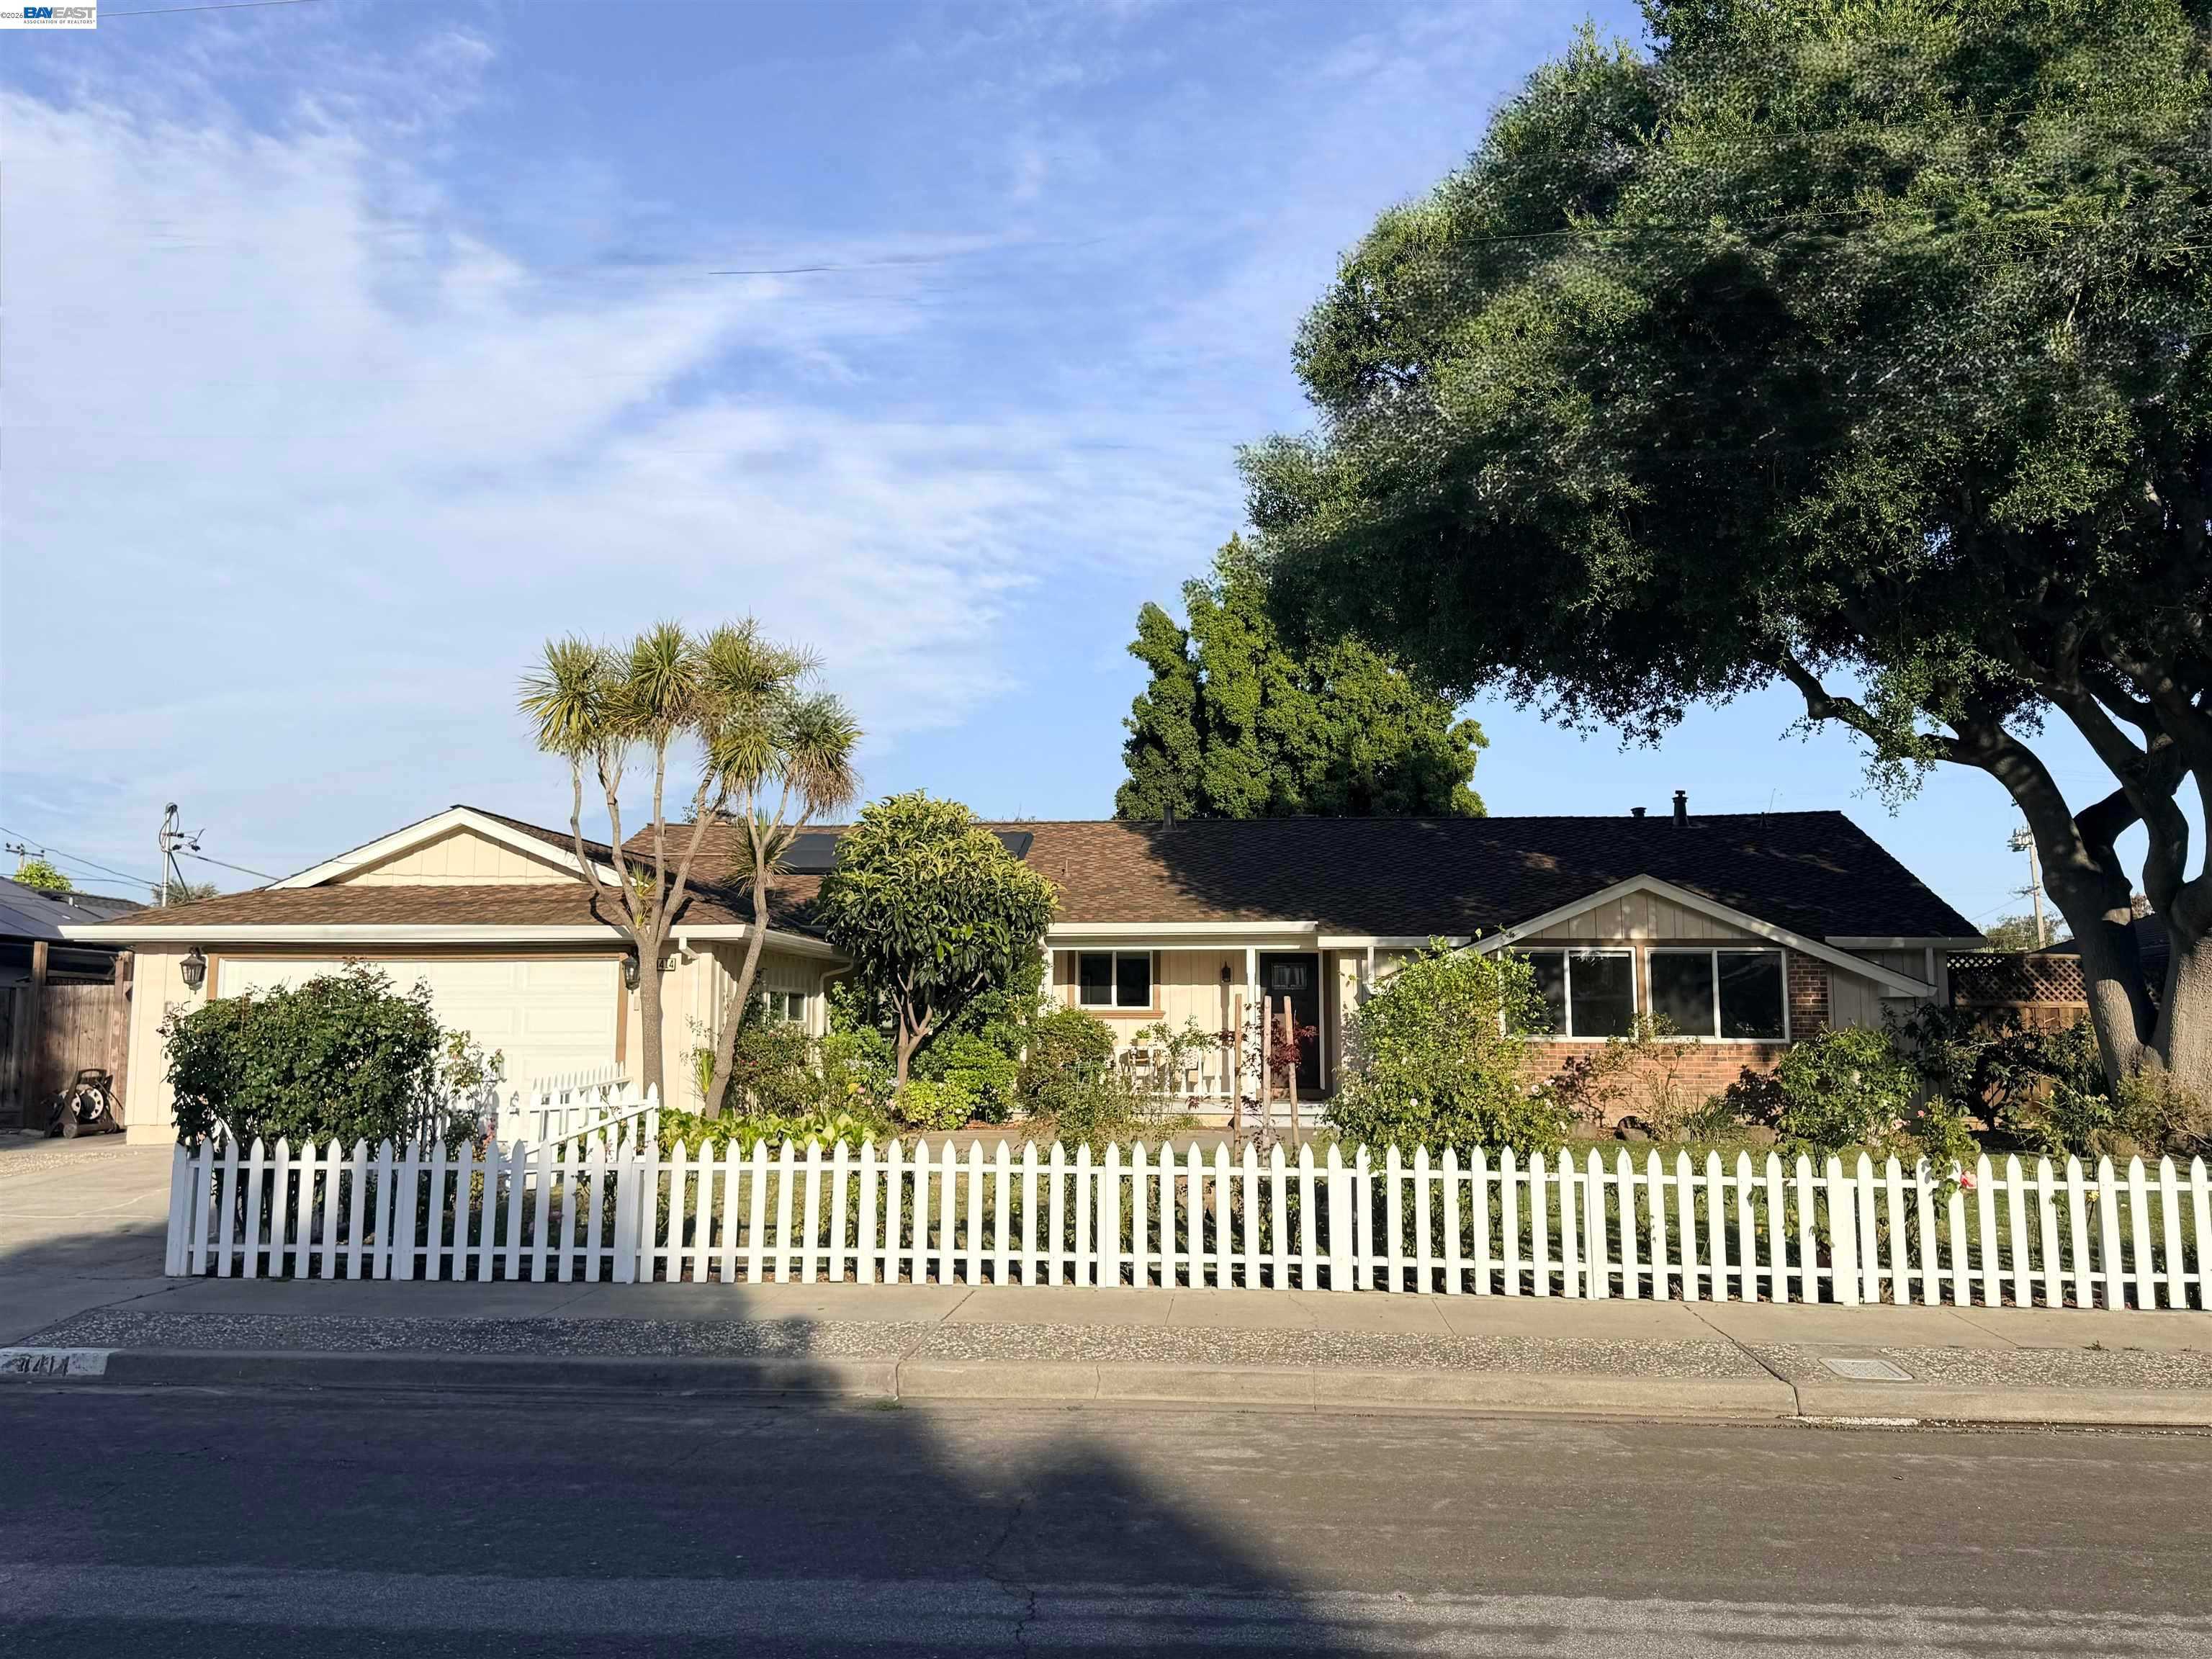
Behind these county totals: hundreds of homes still for sale in Fremont, Hayward, Union City, Newark and Milpitas, counted, priced and sorted every morning from the same MLS export, with a map search for the homes themselves.
30-Year Fixed: 7.48% -0.02 | 15-Year Fixed: 7.15% -0.02
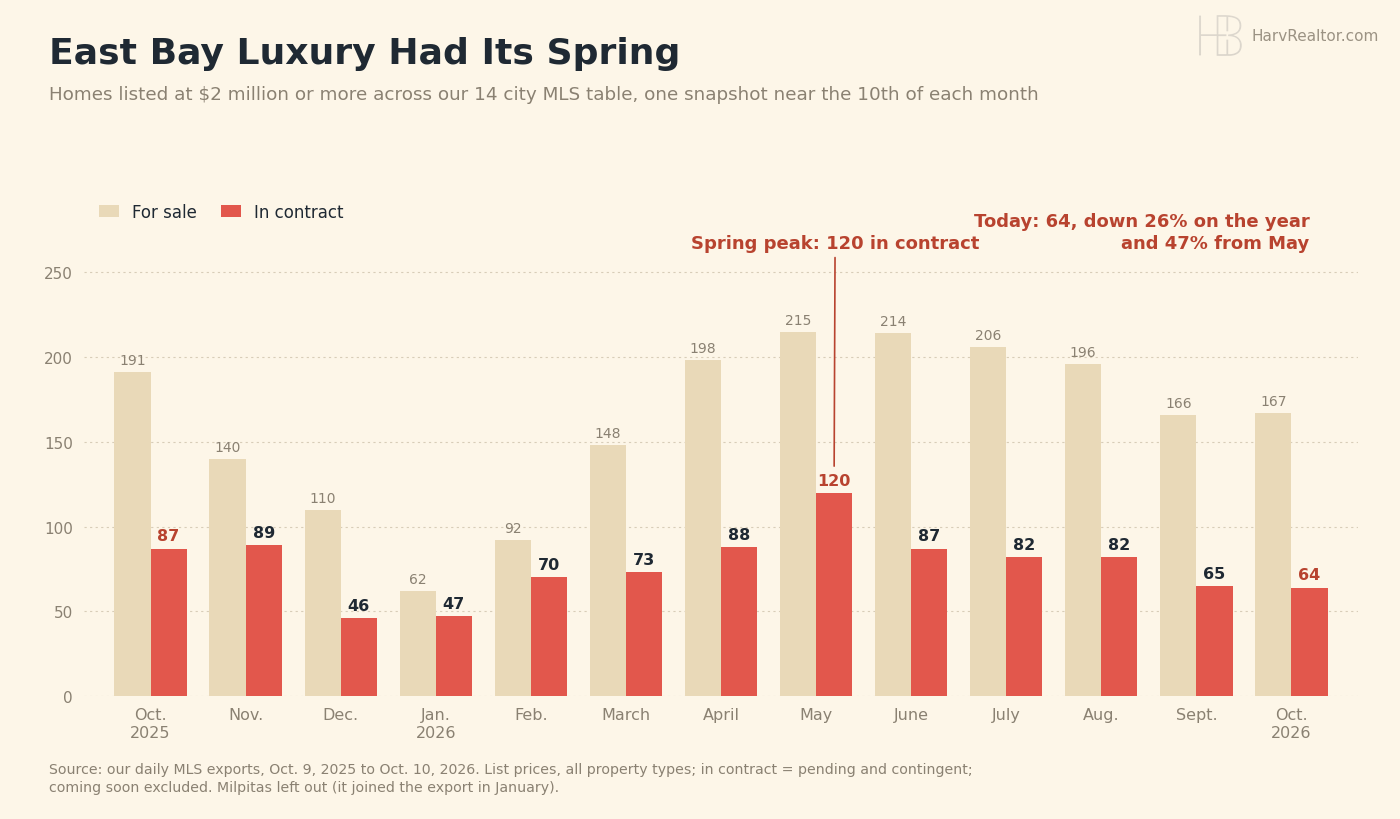
Is luxury booming here? It did this spring. Across our 14 city MLS table, homes listed at $2 million or more that were in contract peaked at 120 in May, 38% above last October's 87. Since then that count has fallen to 64, down 26% from a year ago and 47% from May.
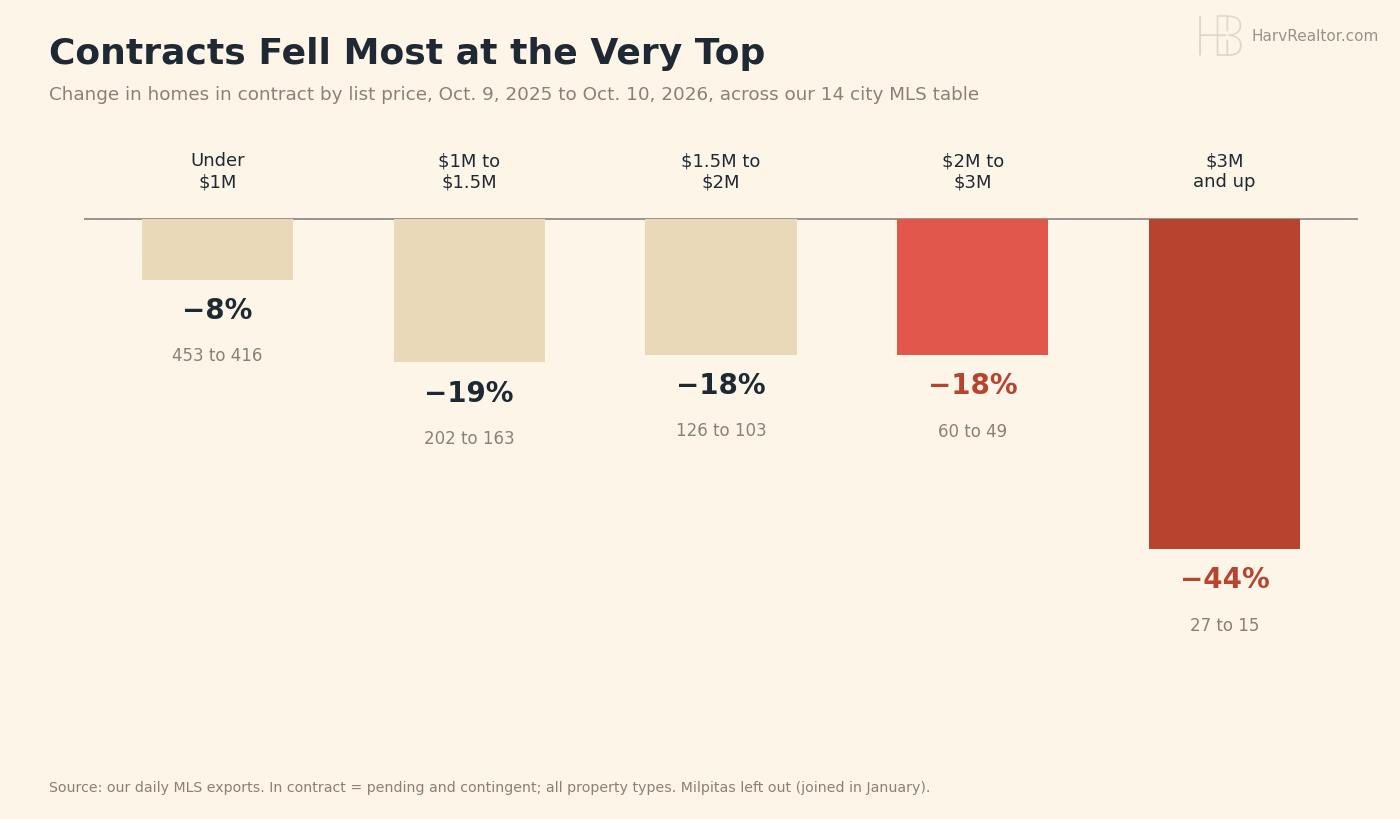
Coolest at the very top. Homes in contract at $3 million and up fell to 15 from 27 a year ago, down 44%, while those under $1 million slipped 8%, to 416 from 453. A year ago, $2 million homes went into contract faster than homes under $1 million, 46 in contract for every 100 for sale against 39. Today it is the other way around, 38 against 42.
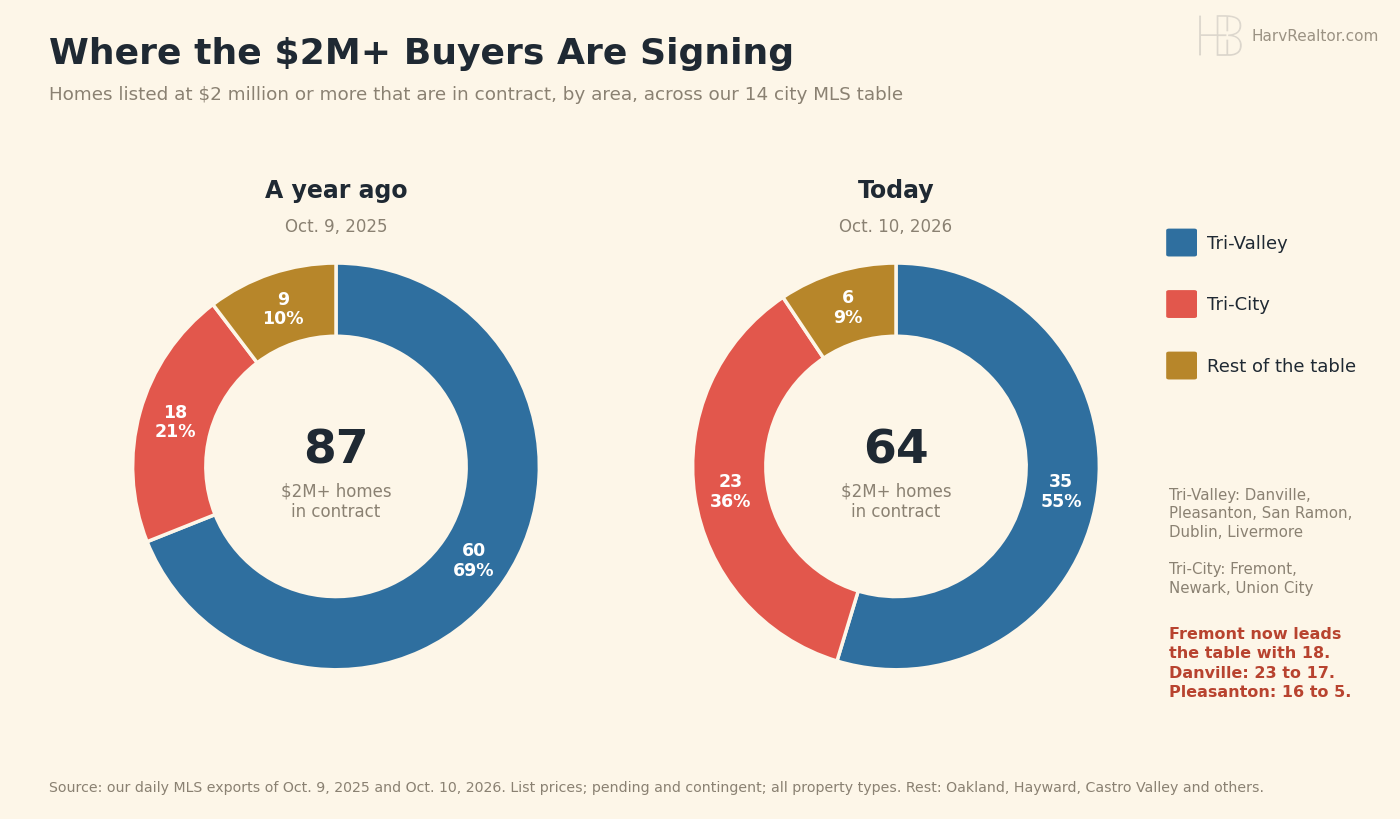
Fremont held up. Fremont has 18 homes of $2 million or more in contract, about where it stood a year ago and now the most of any city in our table. Danville fell to 17 from 23 and Pleasanton to 5 from 16, so the Tri-Valley's share of these contracts dropped to 55% from 69%.
The jumbo payment. Any loan above Alameda County's $1,249,125 conforming limit is a jumbo loan, and Mortgage News Daily's 30-year jumbo rate is 7.63%, up 1.34 points in a year. On a $2 million home with 20% down, that is $11,330 a month in principal and interest, $1,437 more than a year ago, even with the S&P 500 up 14.1% this year.
What it means for you. If you are selling above $2 million, you are pricing for a smaller pool of buyers than in May, so price against today's jumbo payment. If you are buying above $2 million, you have 174 homes to choose from across our 15 city table, and fewer are going into contract than a year ago, which can mean more room to negotiate.
Today's count. Board wide: 2,667 listings across the 15 city table, counting active and in contract together, with 154 coming soon and 236 brand new. The five city ledger carries 688 live listings across Fremont, Hayward, Milpitas, Newark and Union City, 614 on the market and 74 coming soon, up from 687; 34 of those on the market are listed at $2 million or more.
Fremont holds 241 live listings: 196 active, 27 coming soon and 18 brand new, with a median on market list price of $1,262,444 at $789 a square foot and a typical listing out 32 days. Hayward carries 192, Milpitas 101, Newark 92 and Union City 62. Across all five cities the median is $1,074,975 at $676 a square foot, 289 homes are priced under a million, and 144 have been sitting 60 days or longer.
S&P 500: 7,811.54 +0.59% | Dow: 51,654.95 +0.83% | Nasdaq: 27,366.17 +0.64%
A winning week. Stocks bounced Friday, led by tech, after Thursday's AI selloff, and all three averages finished the week higher: the S&P 500 up 1.15%, the Dow 0.93% and the Nasdaq 0.64%. For the year the S&P 500 is up 14.1% and the Nasdaq 17.7%. Bank earnings start next week.
10-Year Treasury: 5.24% +0.02 | Gold: $4,216.30 +1.43% | Silver: $61.05 +2.73% | Brent Crude: $104.72 +0.42%
Metals shine. Gold settled Friday at $4,216.30, up 1.43%, and silver at $61.05, up 2.73%. The 10-Year Treasury edged up to 5.24%, and Brent settled at $104.72, up 0.42%.
Bitcoin: $83,060 +0.54% | Ethereum: $2,506.17 +0.91% | XRP: $1.40 +1.21%
Steady Saturday. Bitcoin is up 0.54% over 24 hours near $83,100, Ether up 0.91% and XRP up 1.21%, live from CoinGecko at 10:49 AM PT. On Coinbase, Bitcoin rose 1.04% Friday after Thursday's 1.90% drop.
Sources
- Our daily MLS exports (luxury charts: dated exports of October 9, 2025 through October 10, 2026, 14 cities, list prices, pending and contingent counted as in contract)
- Mortgage News Daily (30 year, 15 year and 30 year jumbo index, October 9)
- U.S. Treasury (10-Year daily yield curve, October 9)
- CNBC (market close and week, October 9)
- Yahoo Finance (index closes for the year to date math)
- CNBC quotes (COMEX and ICE settlements)
- CoinGecko (live crypto, 10:49 AM PT October 10) and Coinbase (Bitcoin daily candle)
- REALTY EXPERTS® Live Inventory (five city ledger, October 10)
Disclaimer: The market data, rates, and information provided are for informational purposes only and should not be considered financial advice. Always verify rates and data with your lender or financial advisor before making any decisions.
Based on information from the Bay East Association of REALTORS® (Bay East MLS) as of October 10, 2026. All data, including all measurements and calculations of area, is obtained from various sources and has not been, and will not be, verified by broker or MLS. All information should be independently reviewed and verified for accuracy. Properties may or may not be listed by the office/agent presenting the information.