



"At a Glance" Local Housing STATS and News 10/09/26
October 9, 2026 · Alameda County Market Dashboard
TODAY'S LIVE INVENTORY
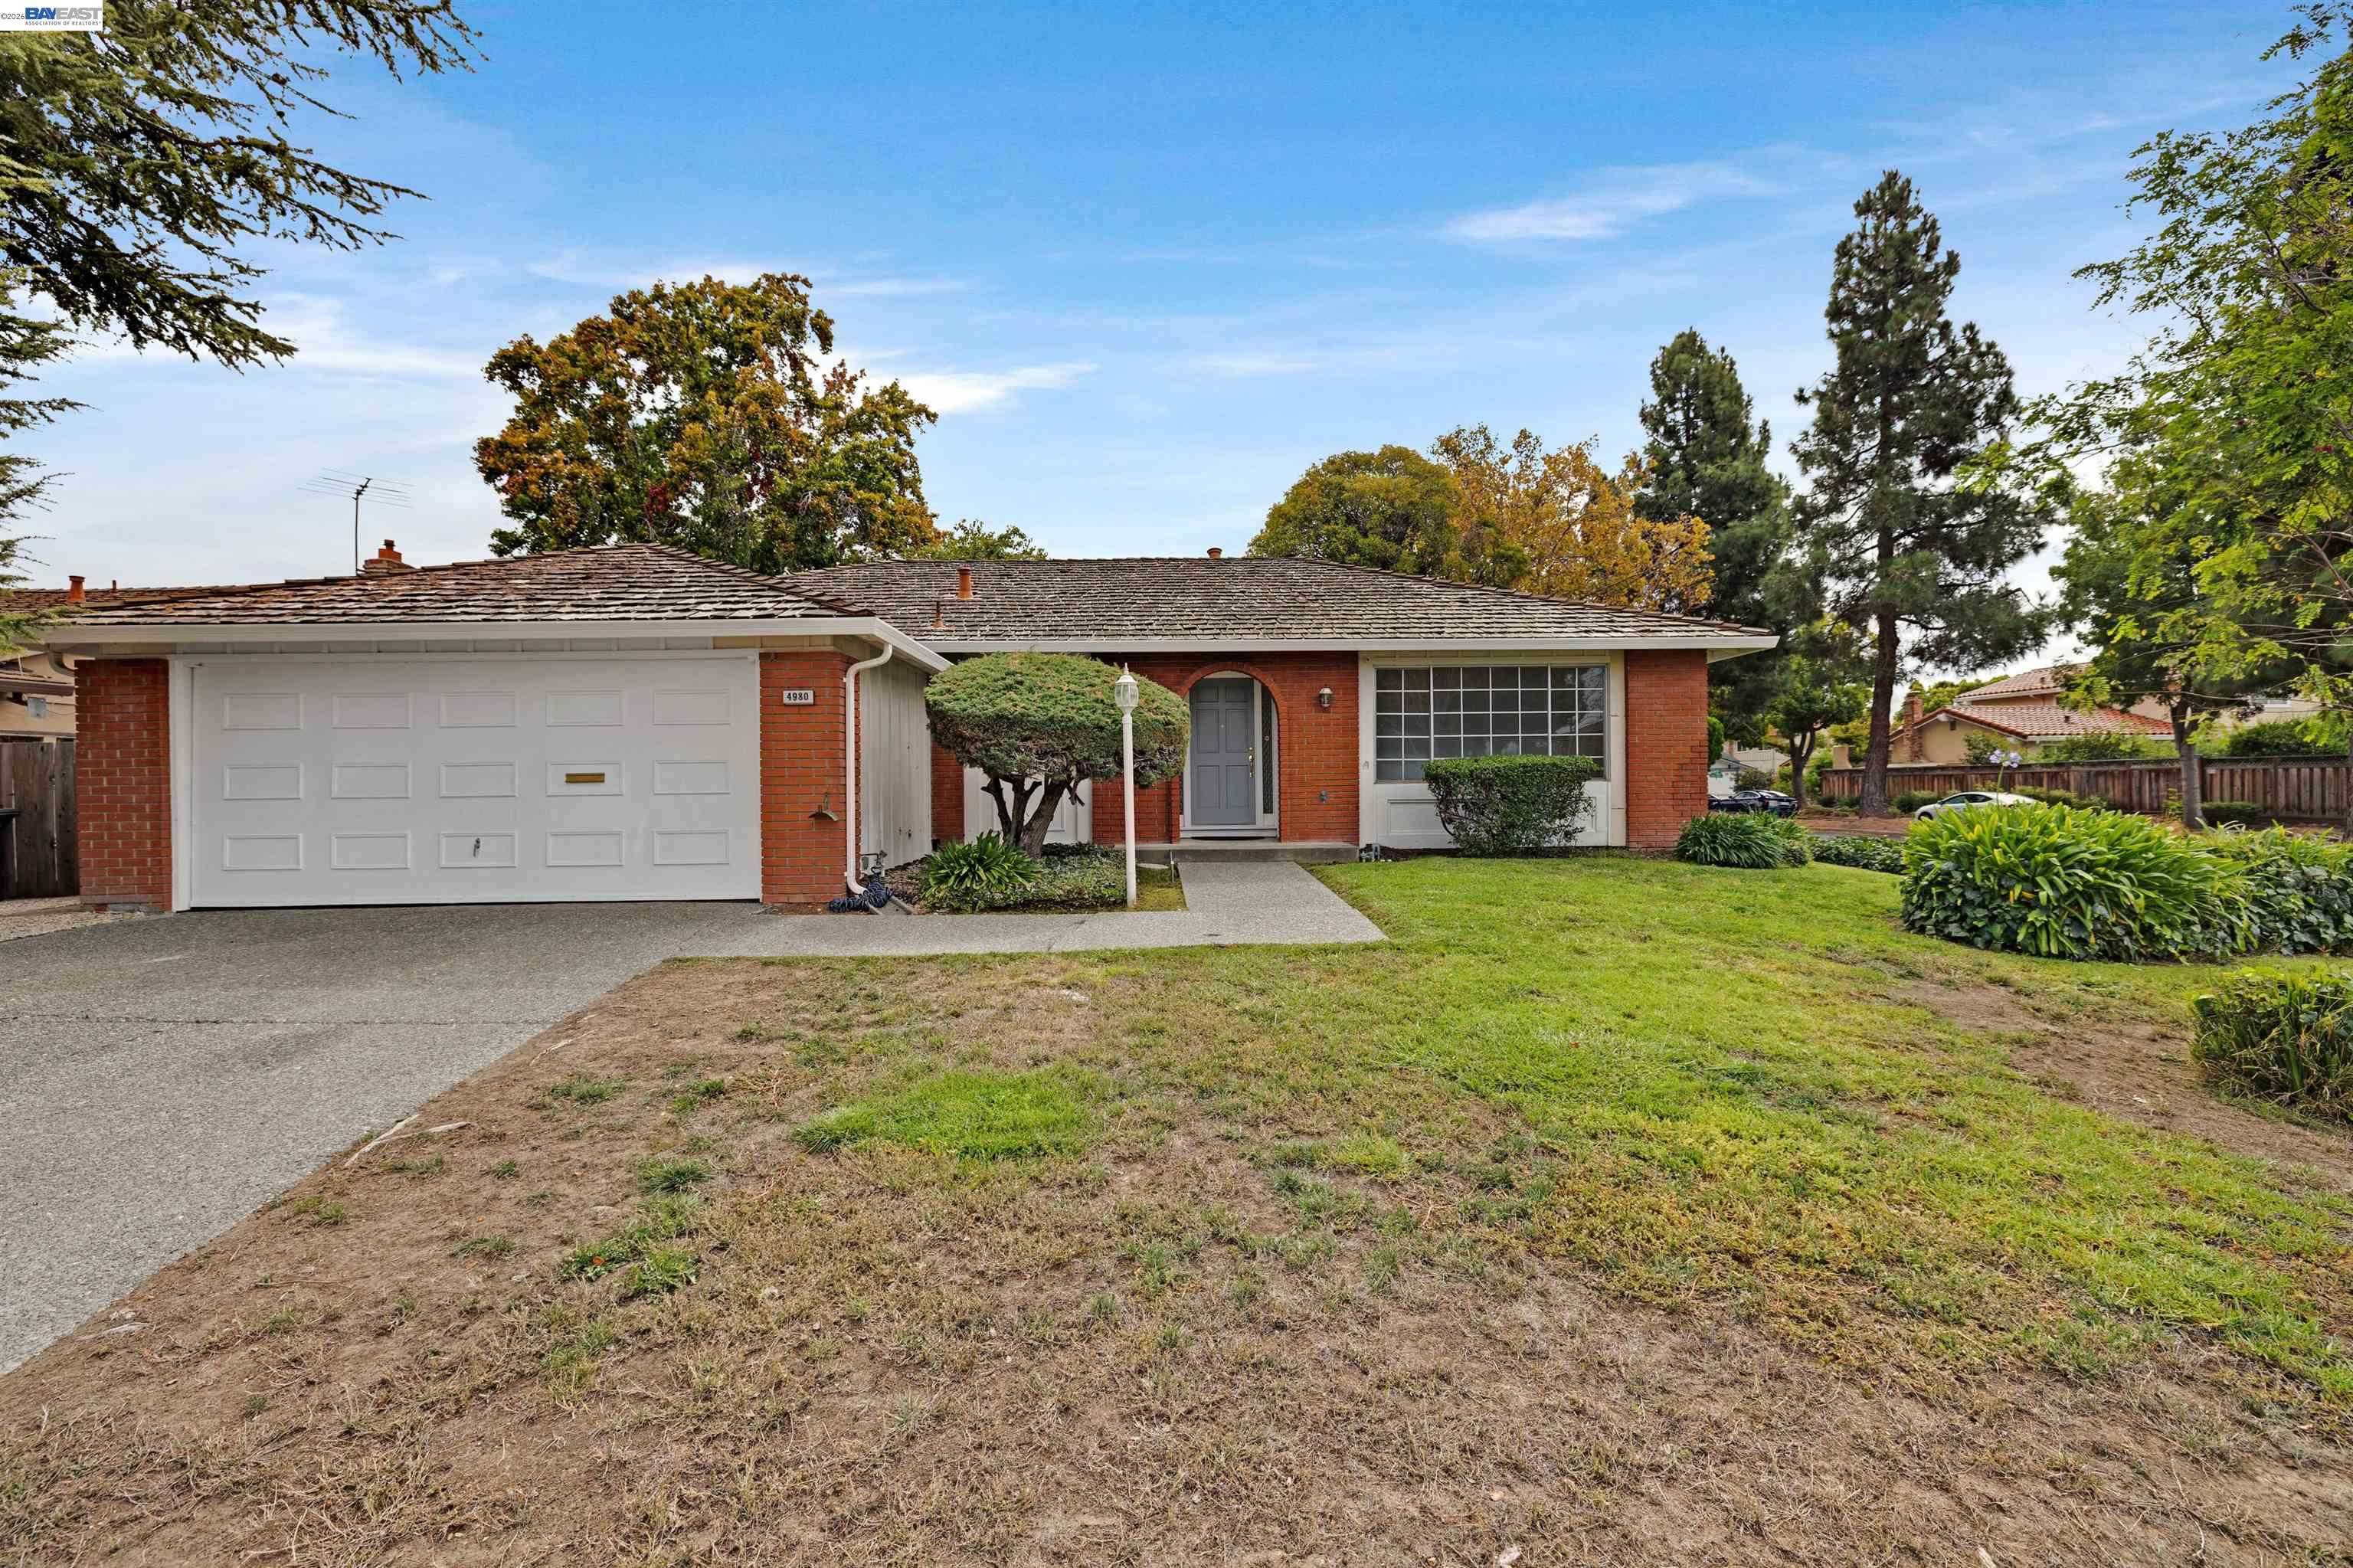
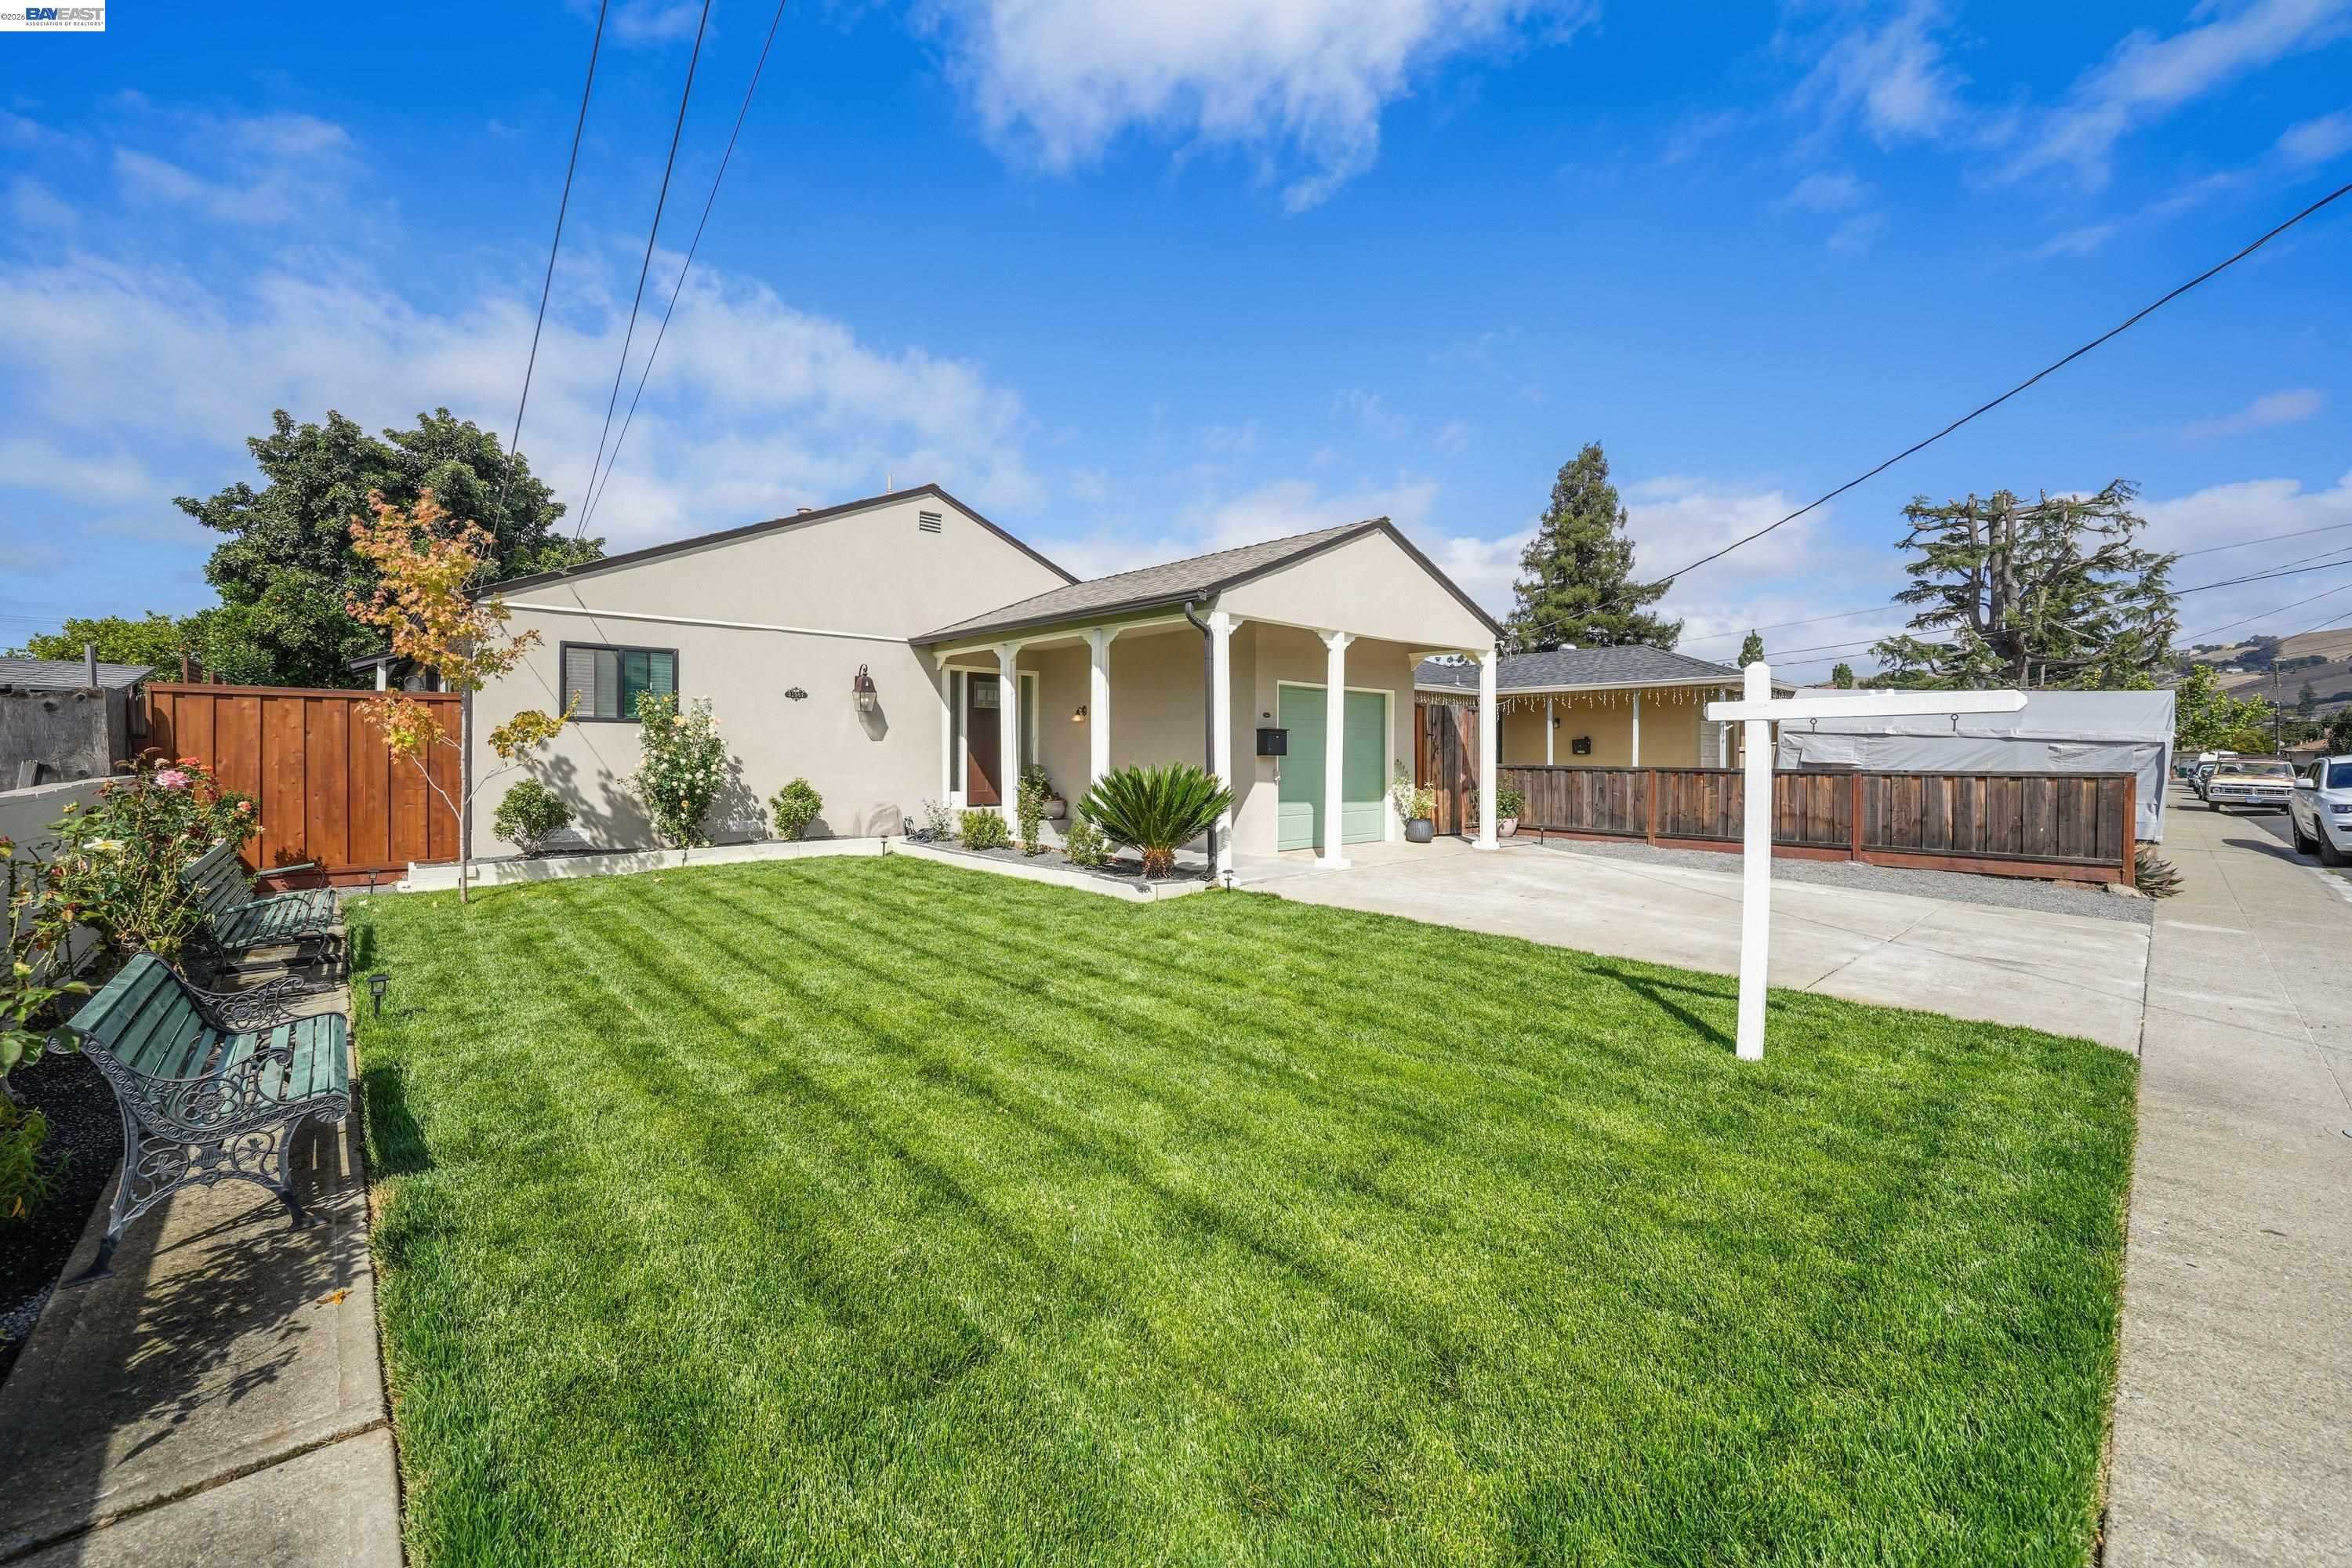
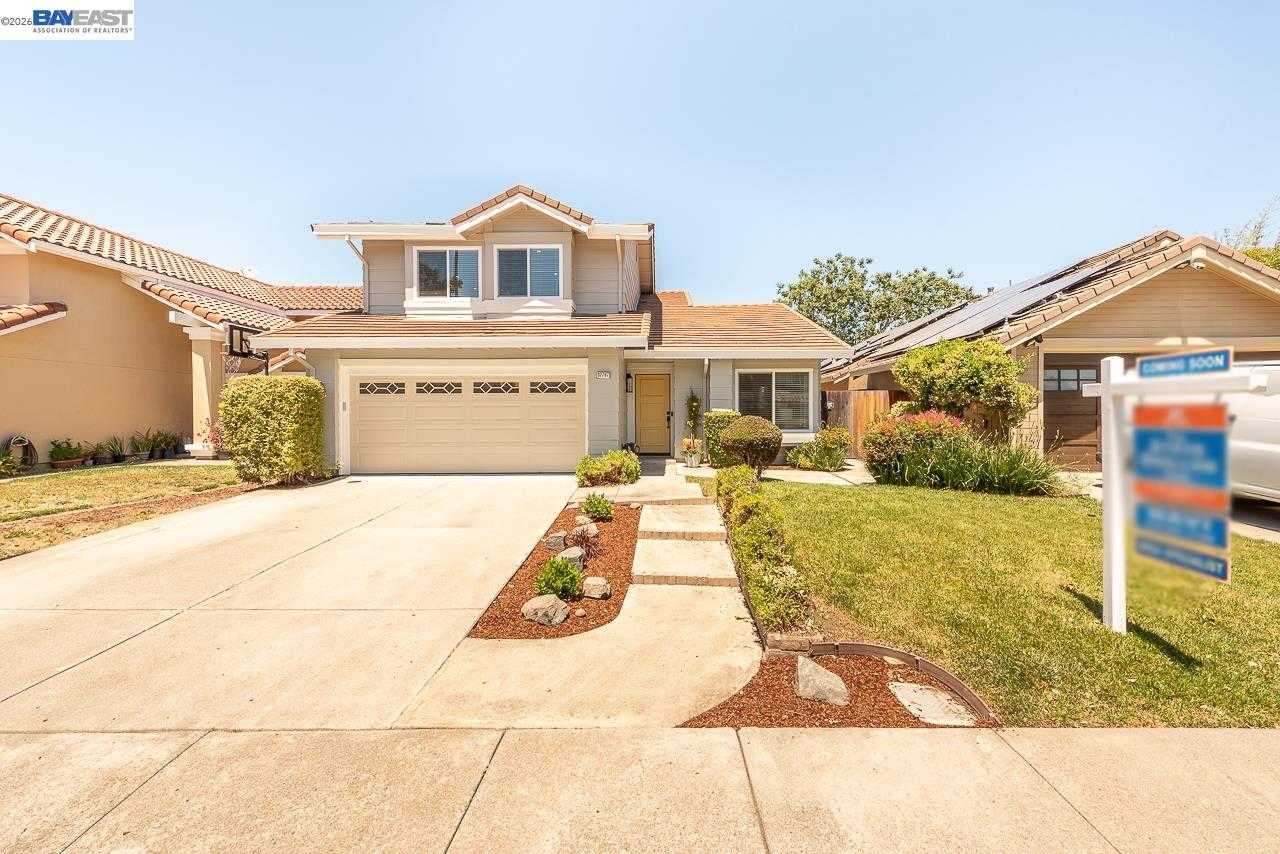
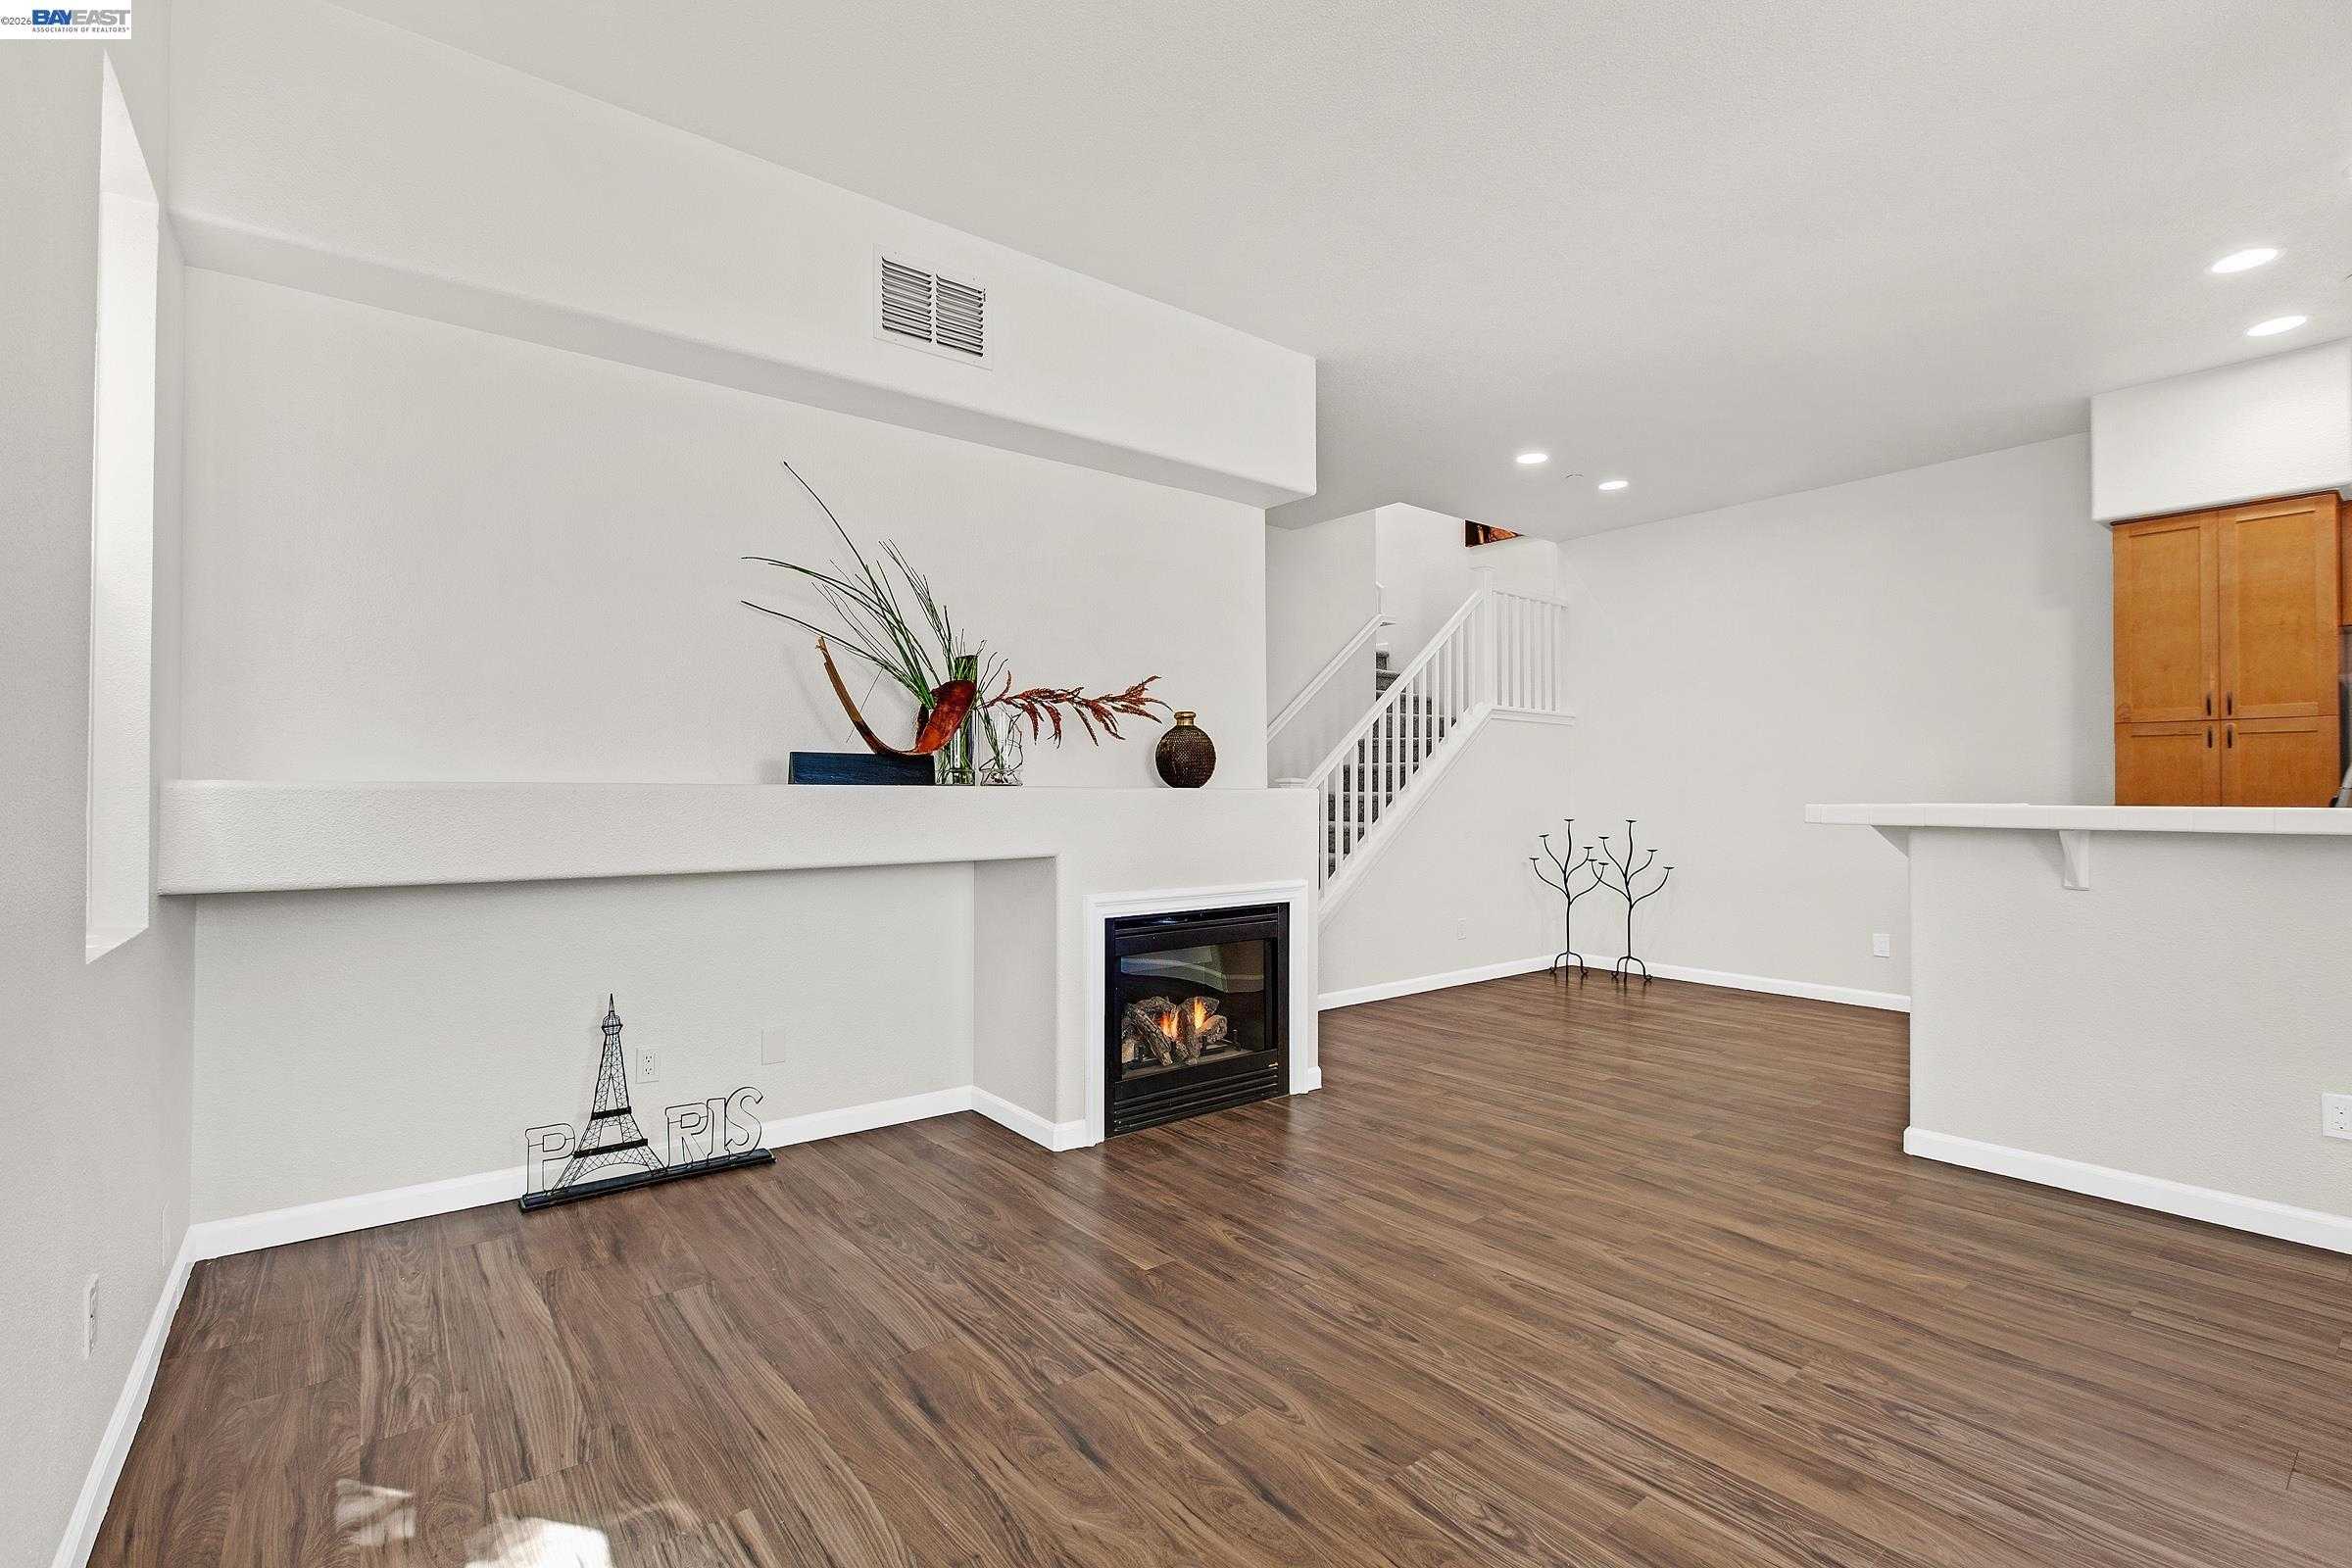
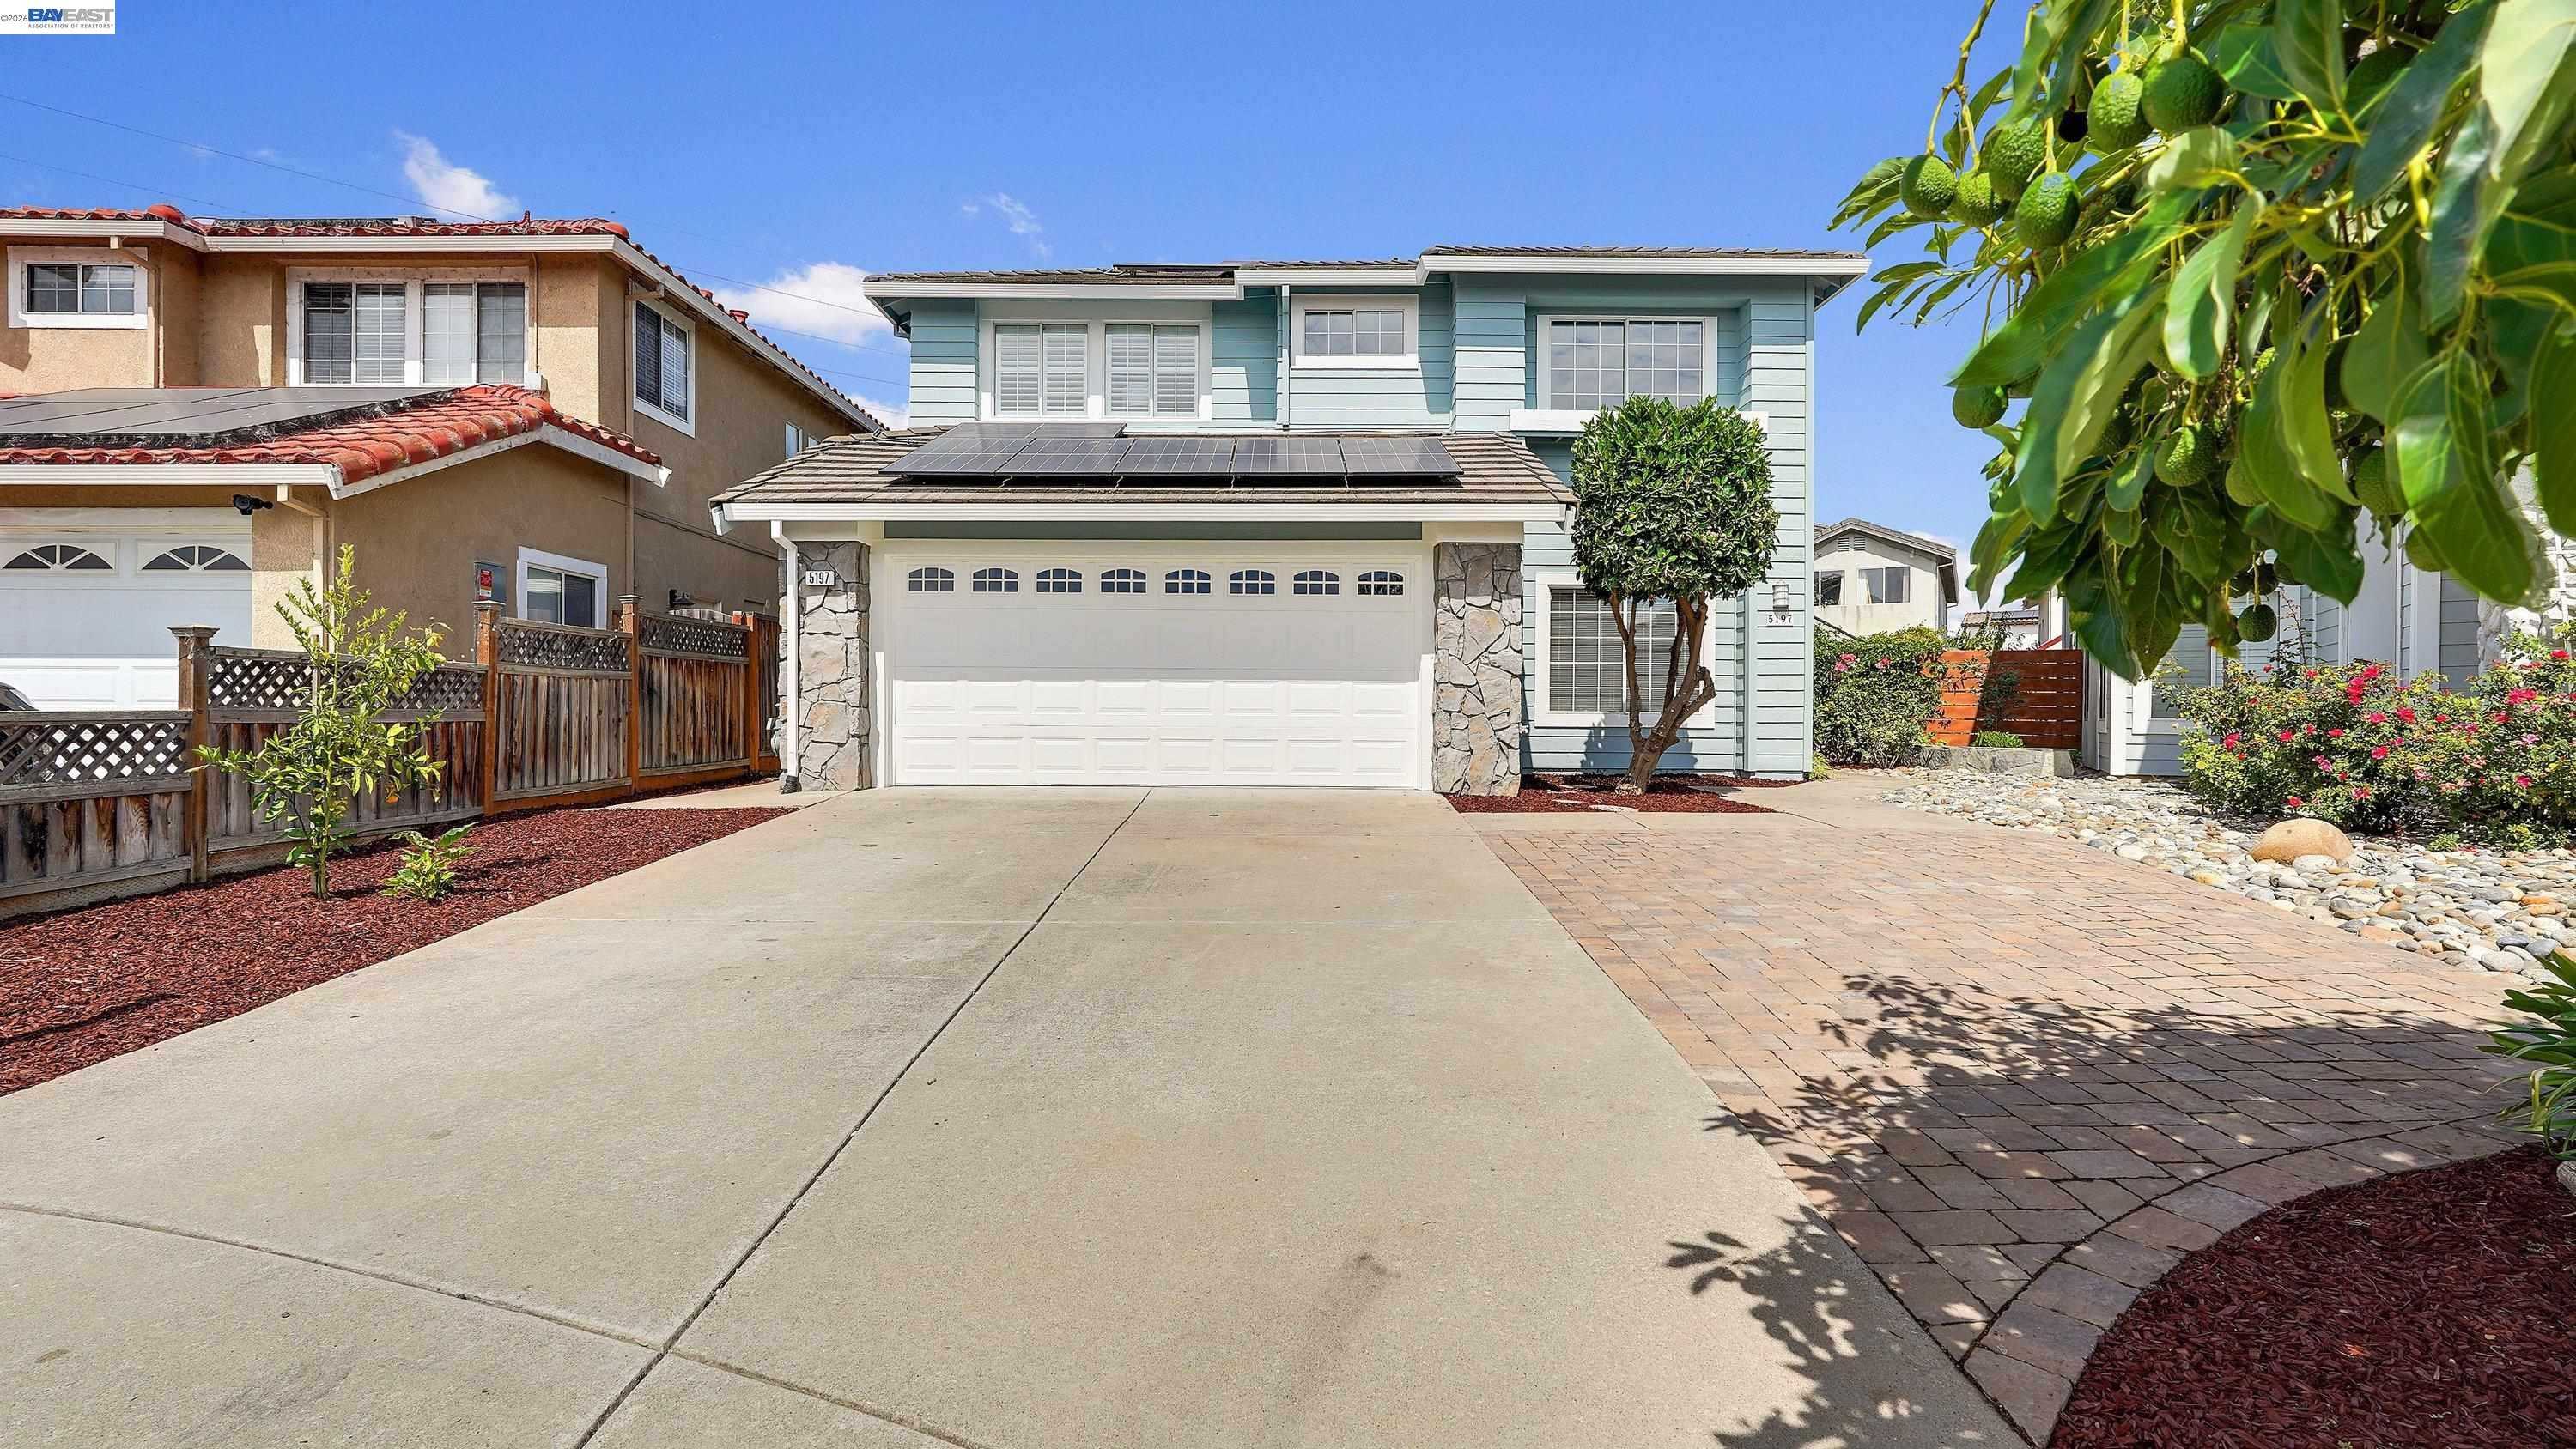
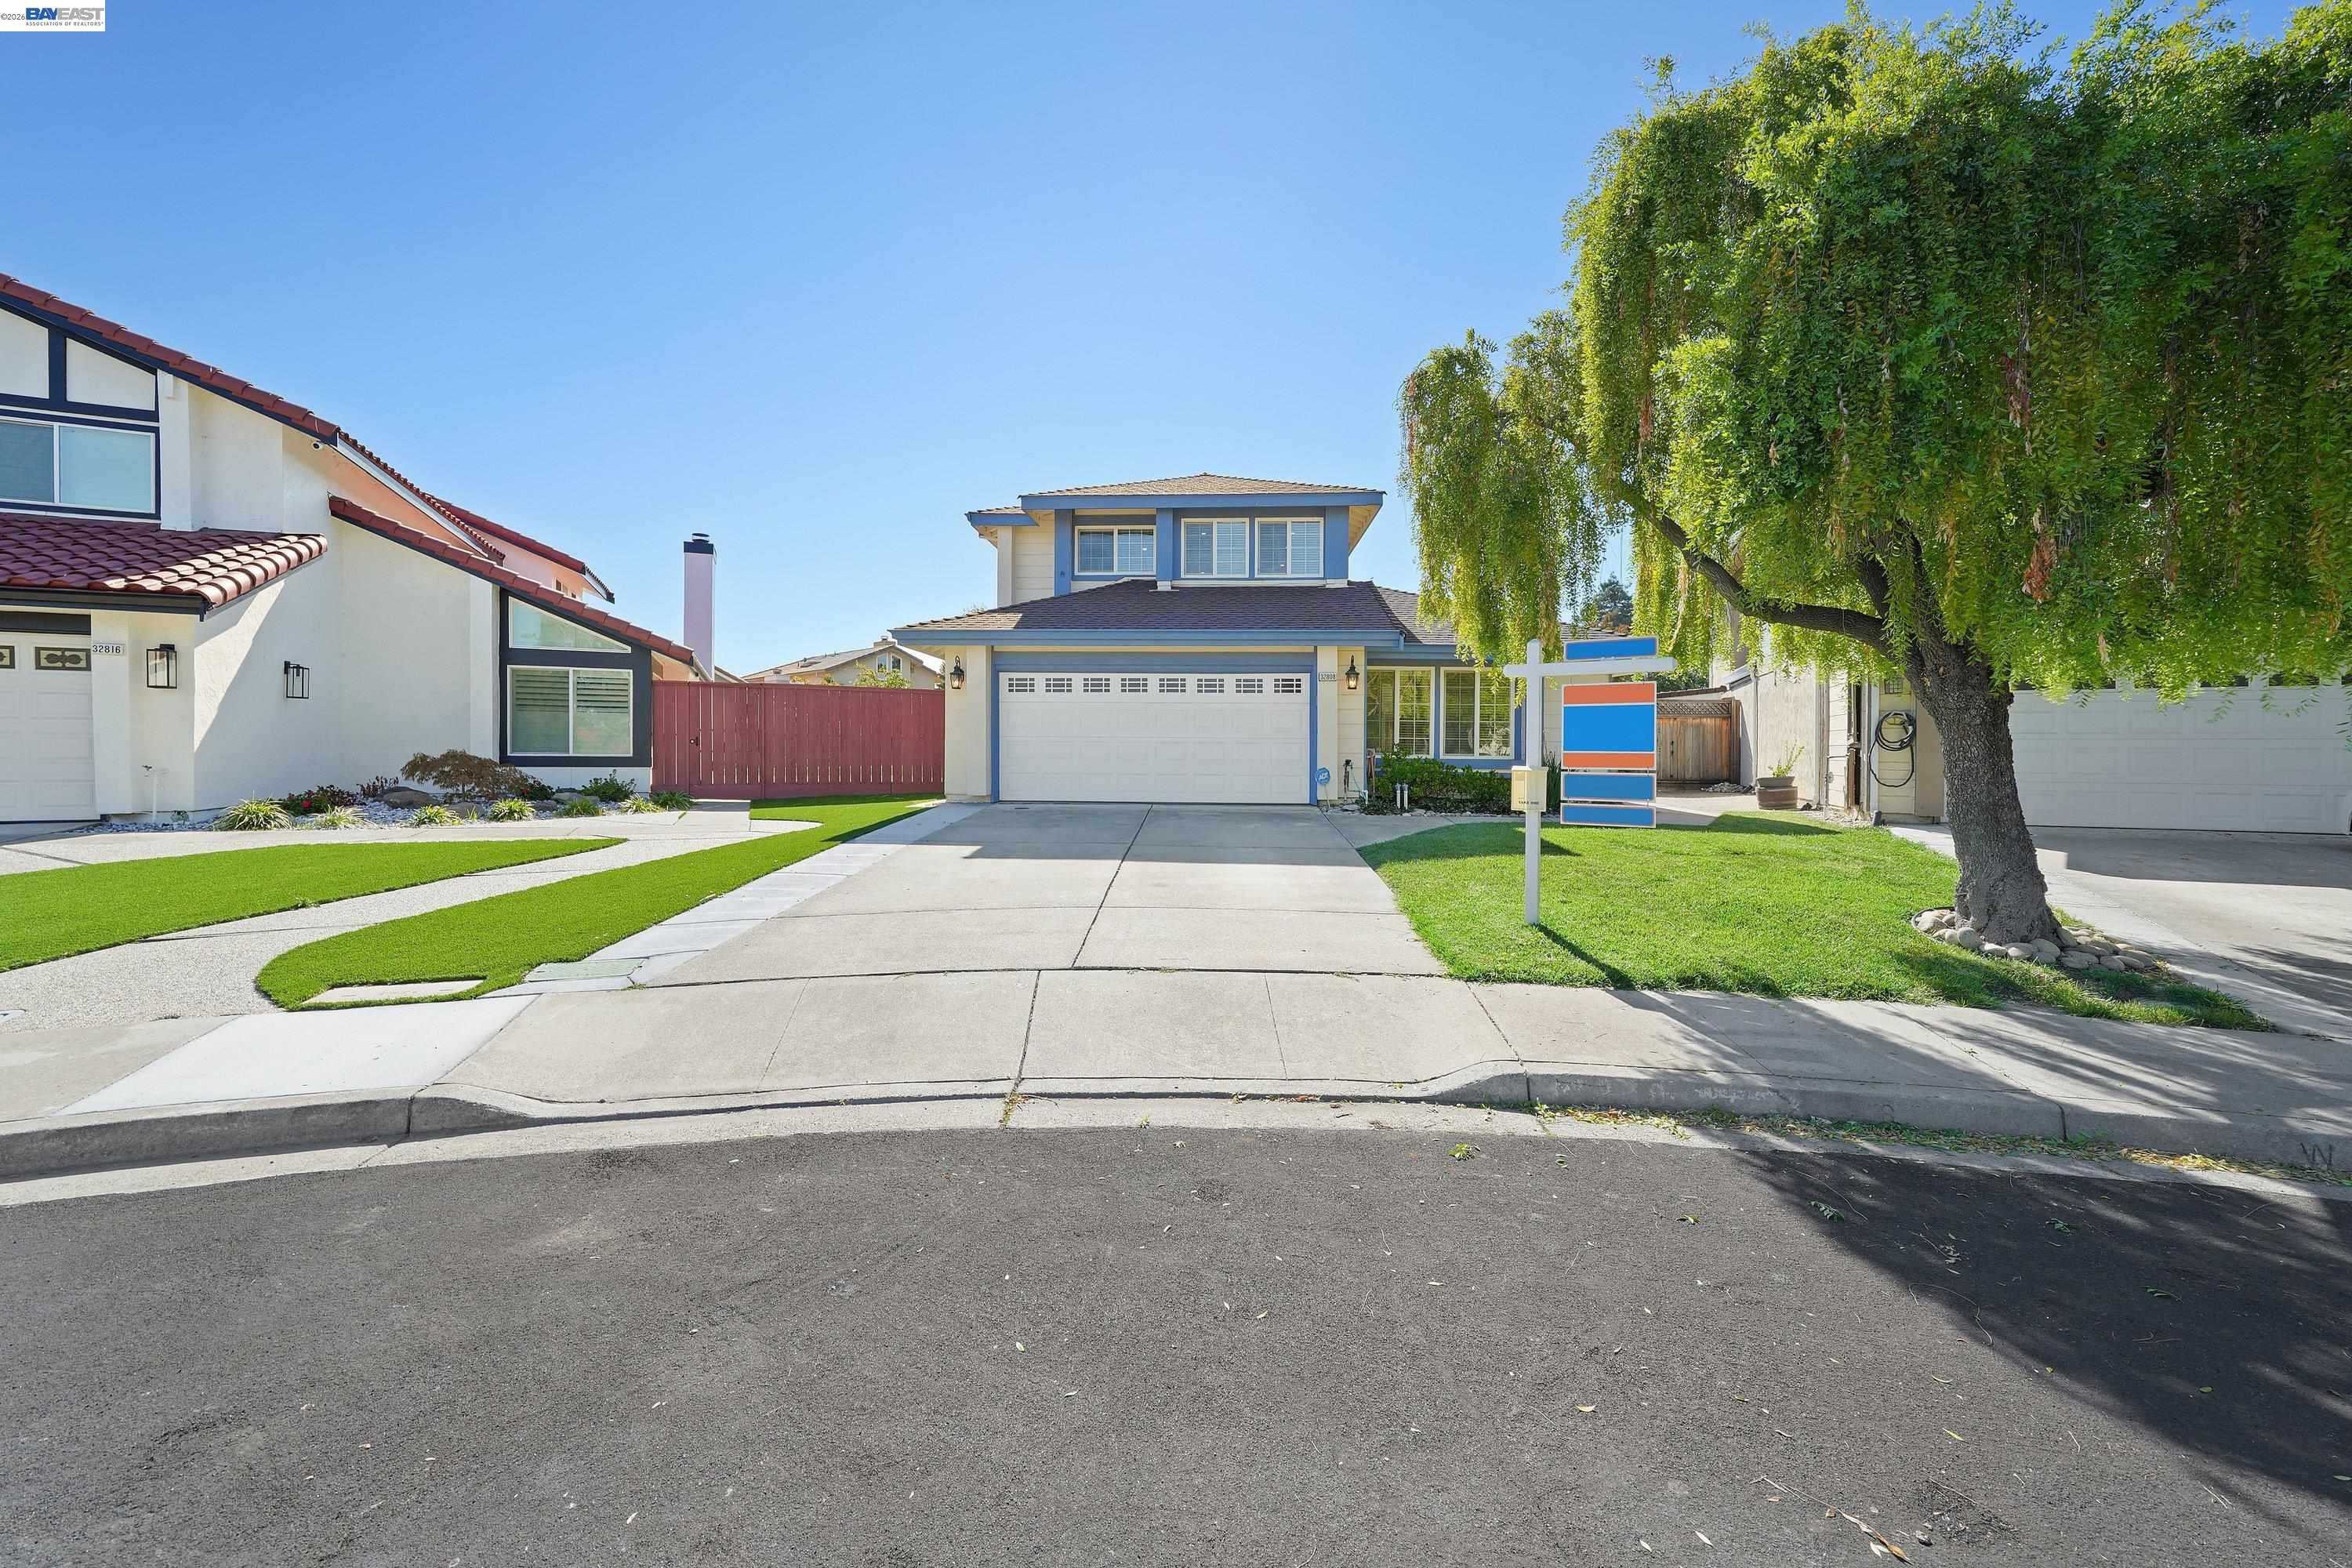
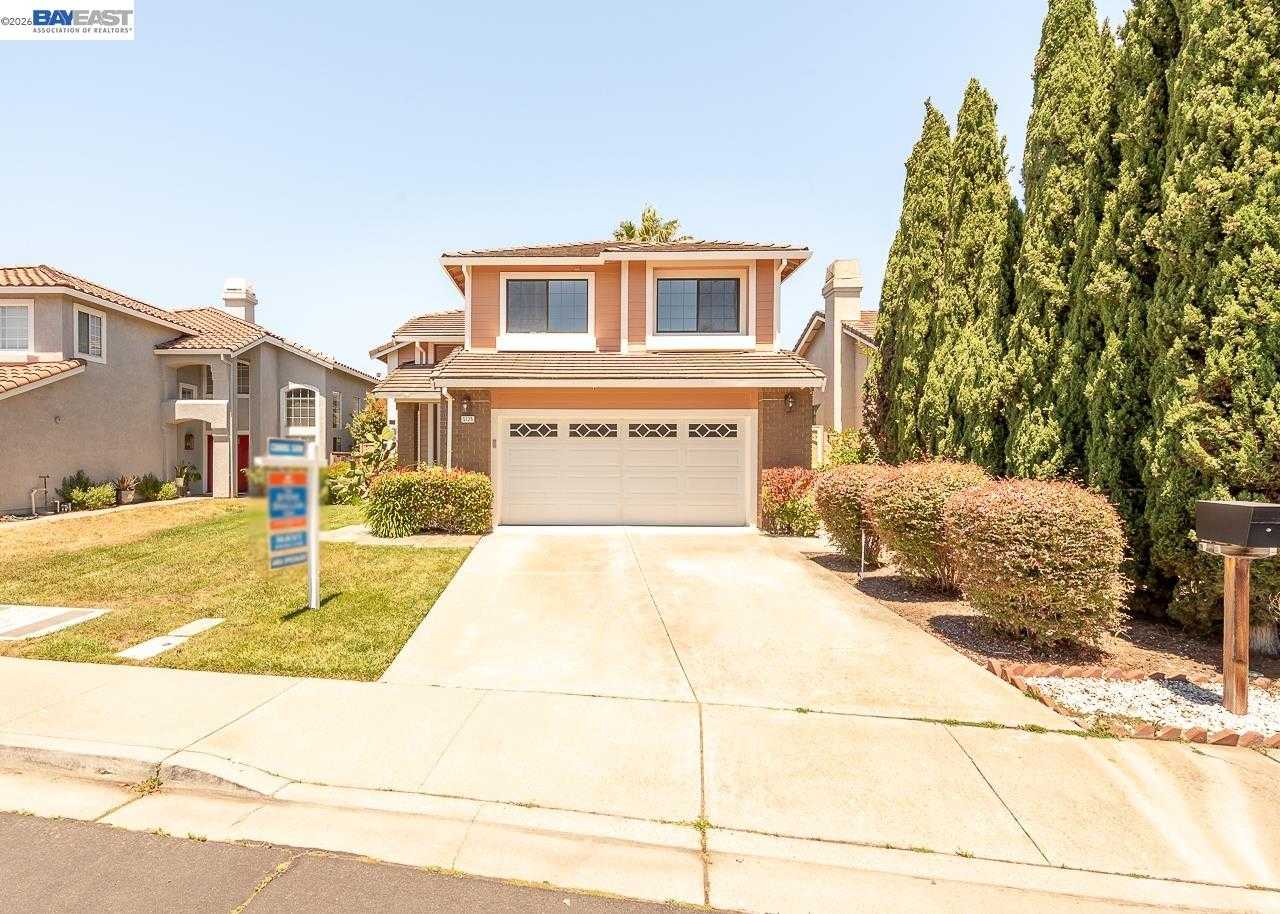
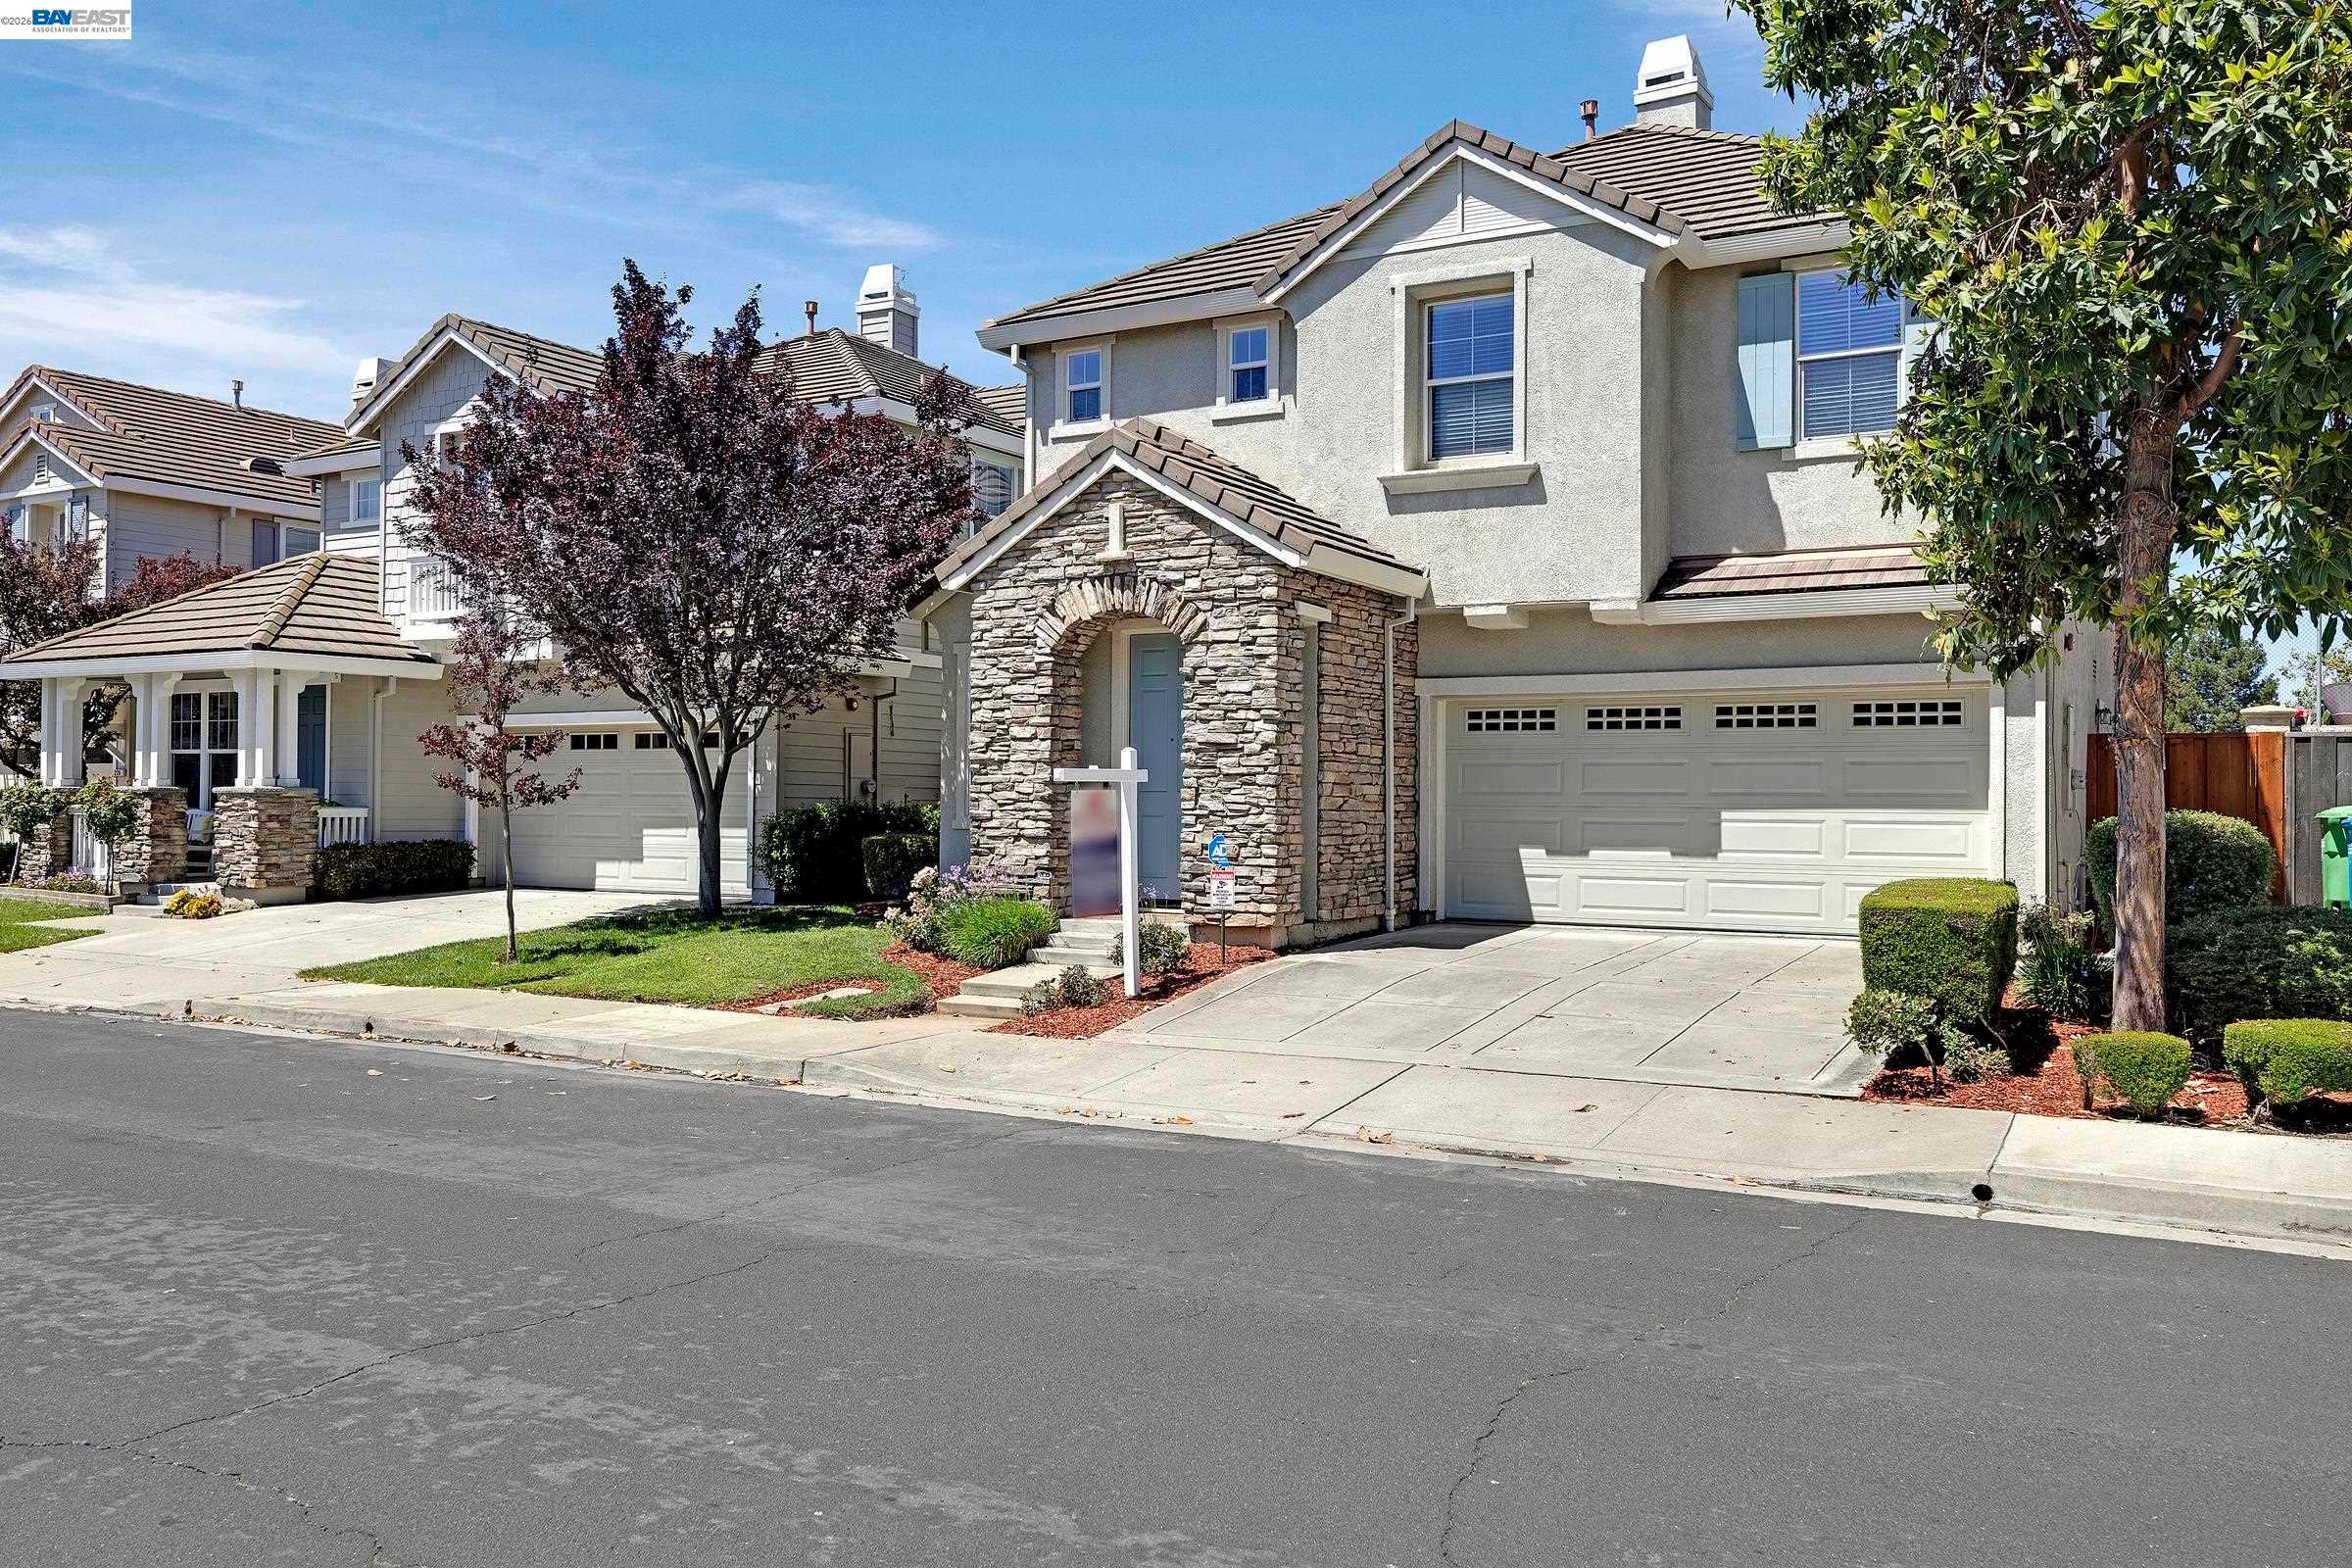
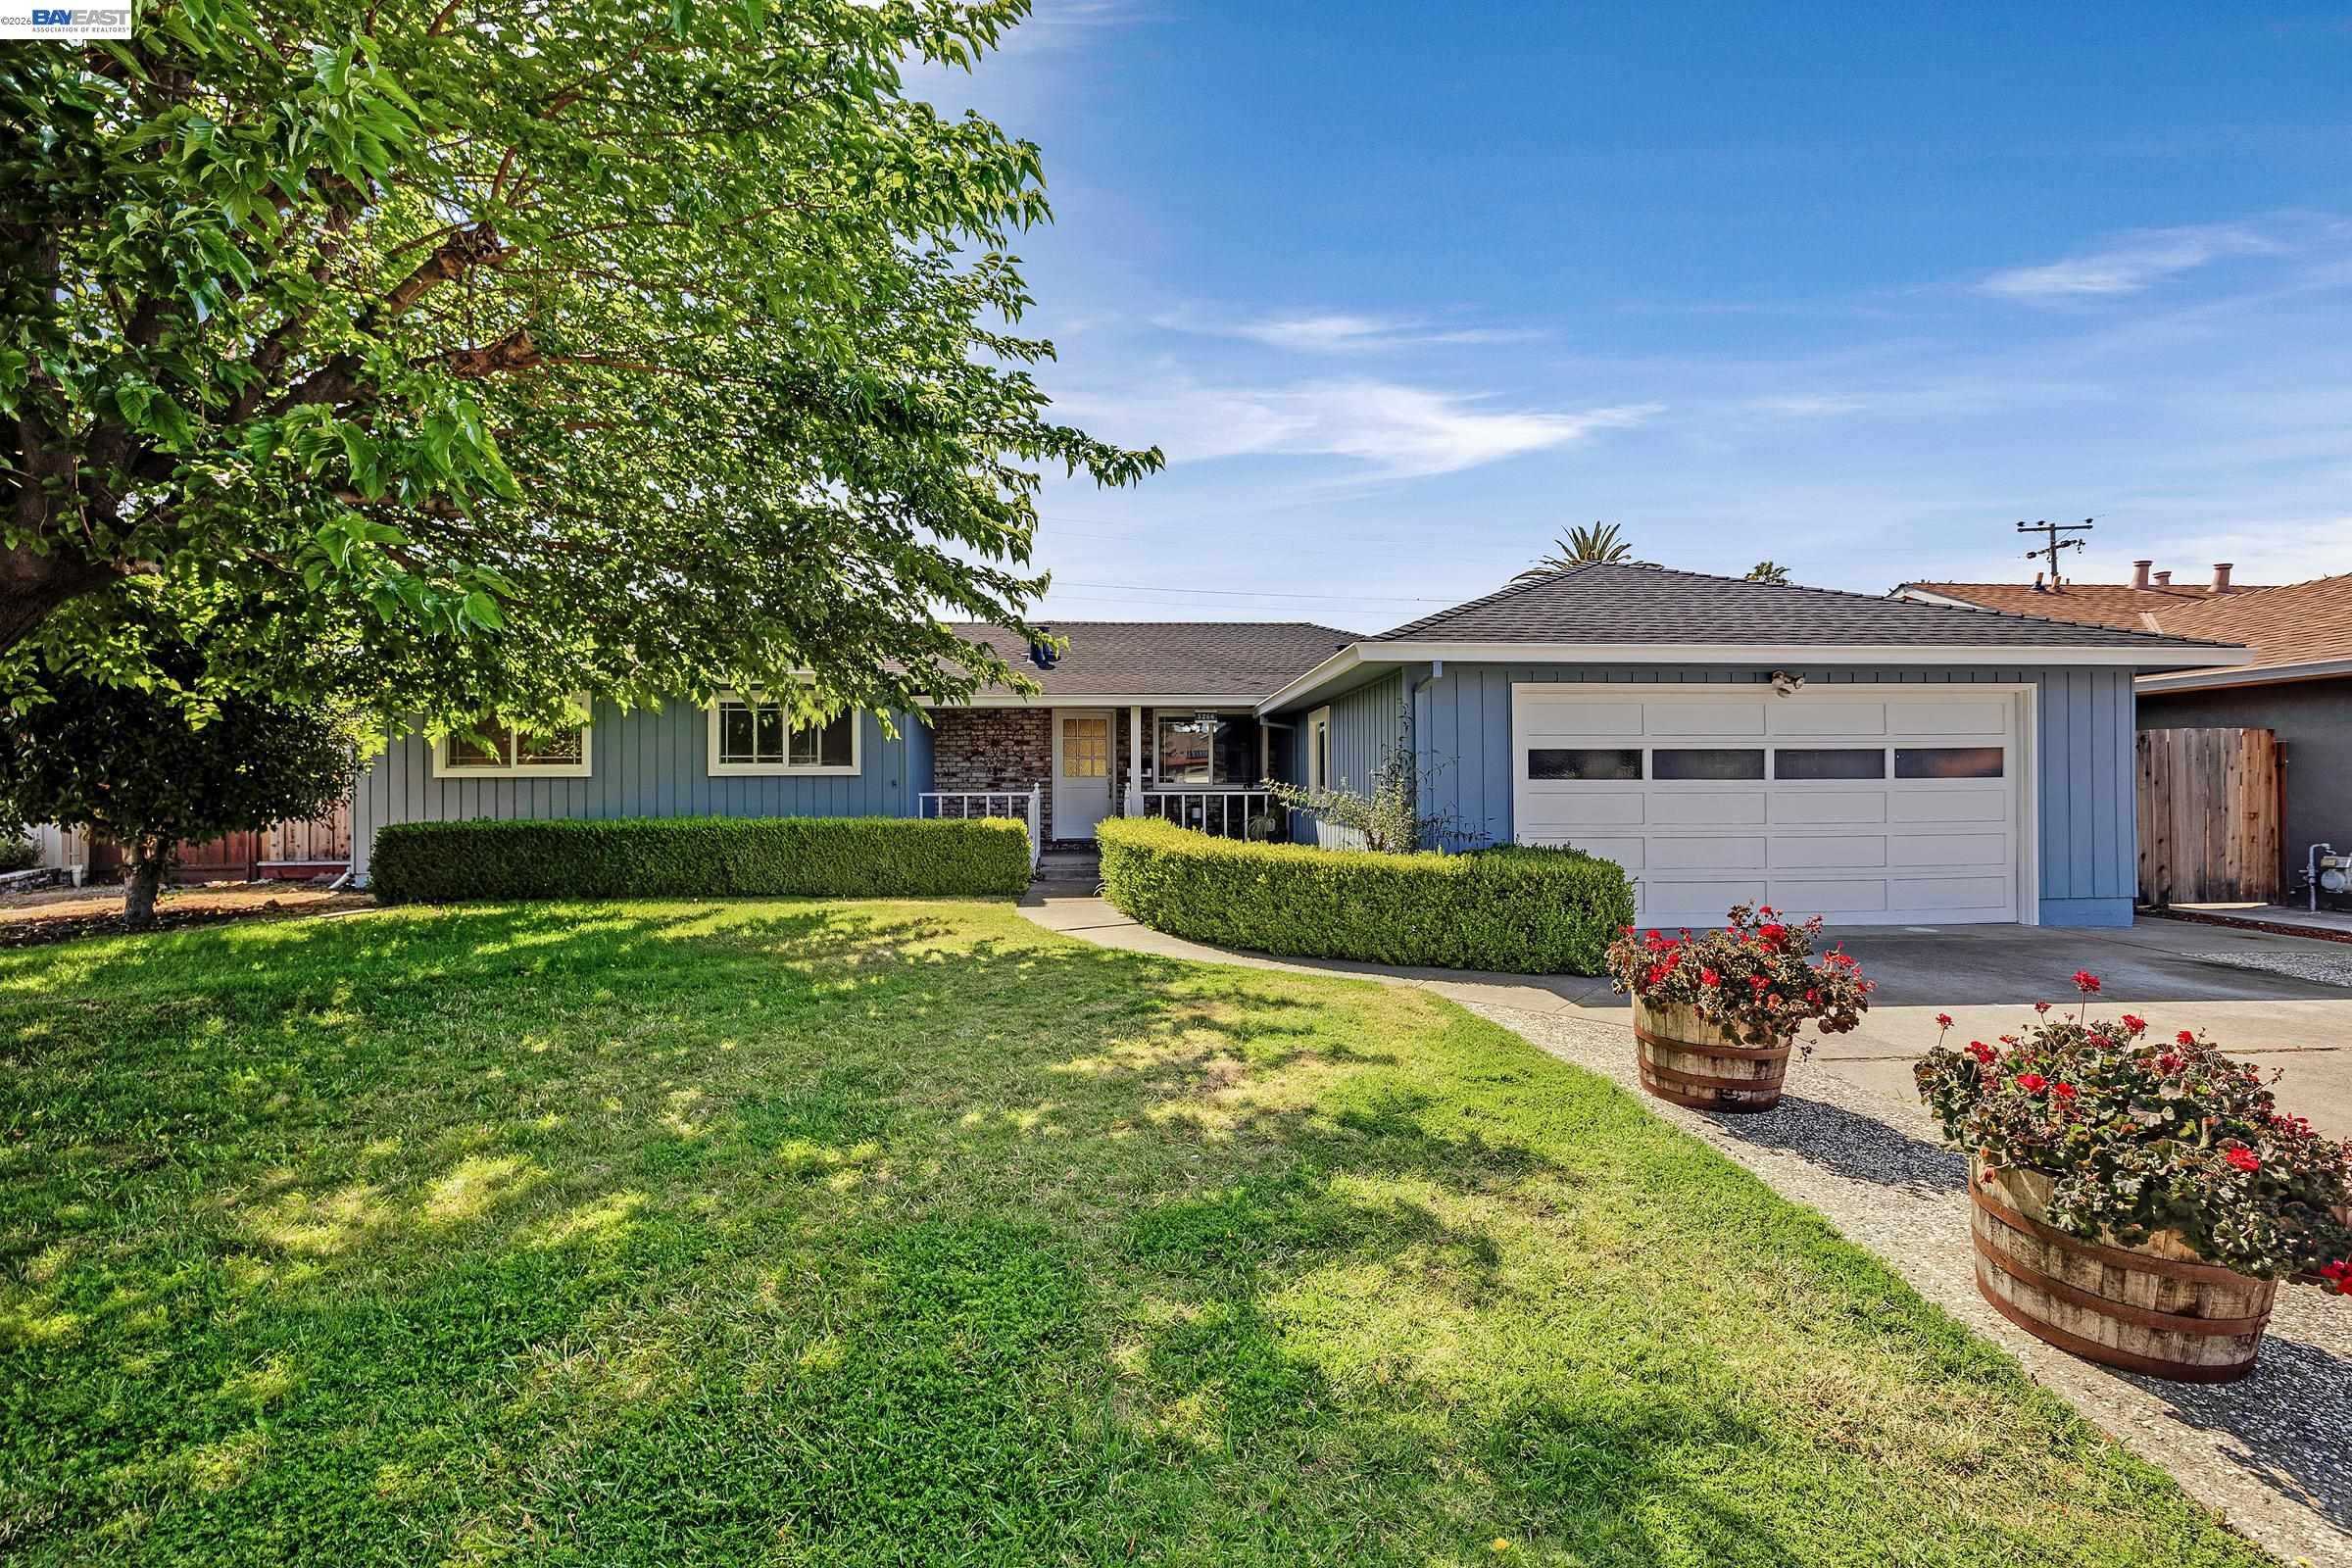
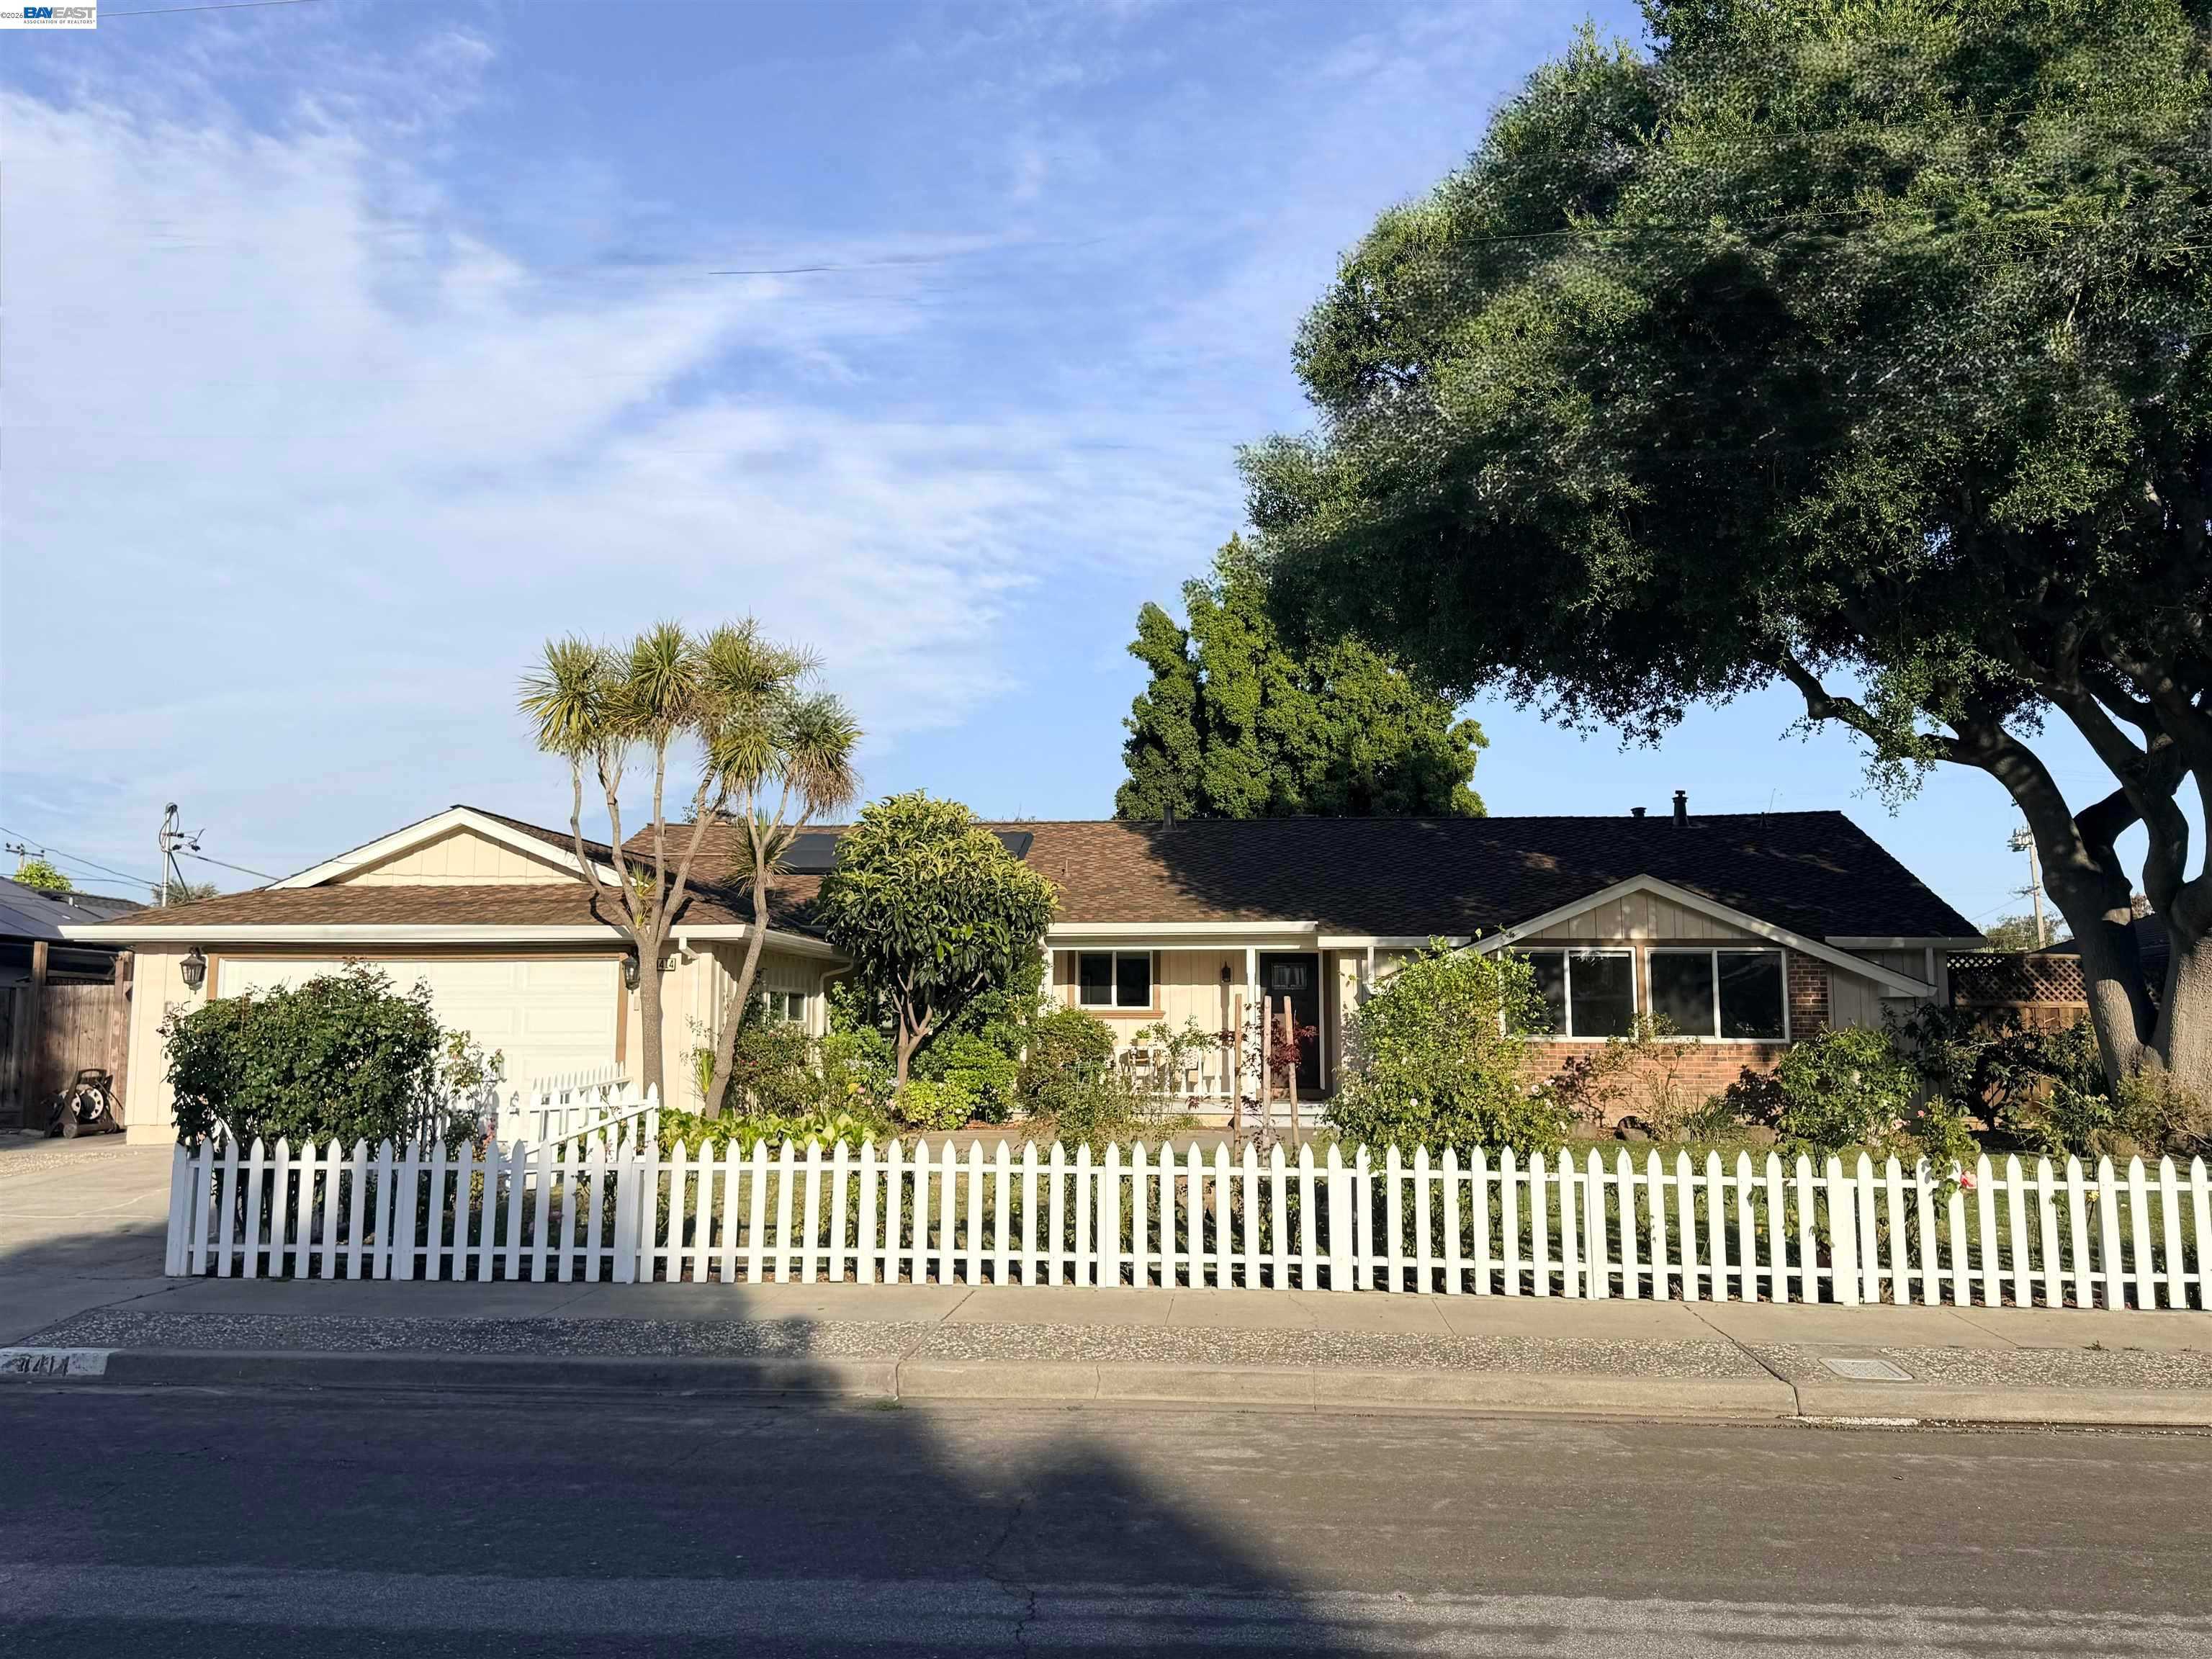
Behind these county totals: hundreds of homes still for sale in Fremont, Hayward, Union City, Newark and Milpitas, counted, priced and sorted every morning from the same MLS export, with a map search for the homes themselves.
30-Year Fixed: 7.50% -0.09 | 15-Year Fixed: 7.17% -0.05
A month of rates, in dollars. We will skip the daily rate recap. Mortgage News Daily's 30-year fixed was 6.89% on Sept. 8 and 7.50% Thursday, after a high of 7.61% on Oct. 5. On the five city median list price of $1,075,000 with 20% down, principal and interest went from $5,658 a month to $6,013, $355 more for the same home. Put the other way, the Sept. 8 payment now borrows about $51,000 less.
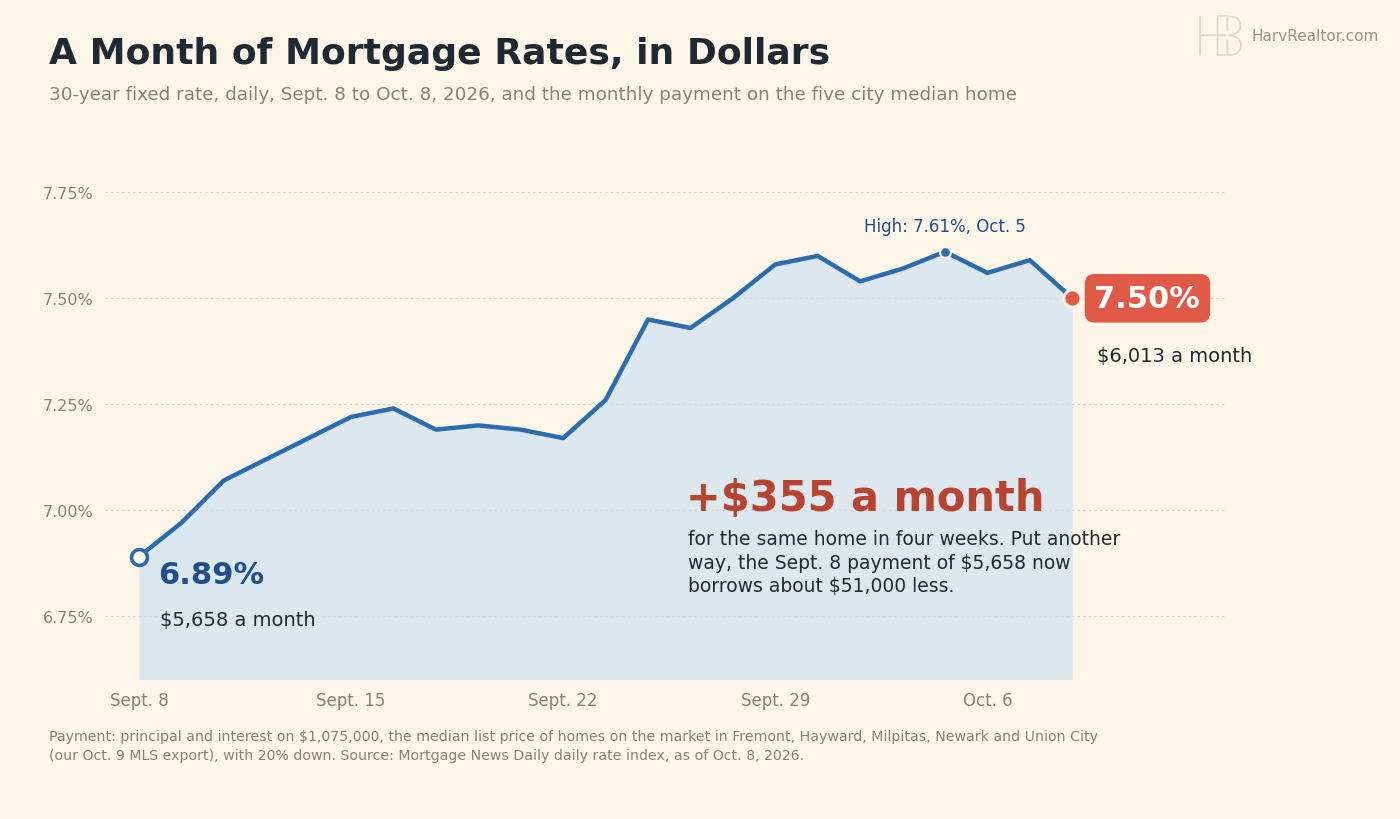
A drop, not a jump. Some newsletters described Thursday's 7.50% as rates jumping again. It was a 0.09 point drop from Wednesday's 7.59%, MND's biggest one day decline in three months.
What it means for you. If your preapproval dates from early September, have it rerun: the same payment now qualifies for about 6% less loan. If you are selling, note the 147 homes that have sat 60 days or longer; most came on the market when the 30-year was under 6.9%.
Today's count. Board wide: 2,670 listings across the 15 city table, counting active and in contract together, with 148 coming soon and 201 brand new. The five city ledger carries 687 live listings across Fremont, Hayward, Milpitas, Newark and Union City, 615 on the market and 72 coming soon, up from 682.
Fremont holds 241 live listings: 198 active, 27 coming soon and 16 brand new, with a median on market list price of $1,274,944 at $797 a square foot and a typical listing out 31 days. Hayward carries 191, Milpitas 103, Newark 90 and Union City 62. Across all five cities the median is $1,075,000 at $675 a square foot, 290 homes are priced under a million, and 147 have been sitting 60 days or longer.
S&P 500: 7,765.36 -0.47% | Dow: 51,231.64 +0.10% | Nasdaq: 27,193.34 -1.25%
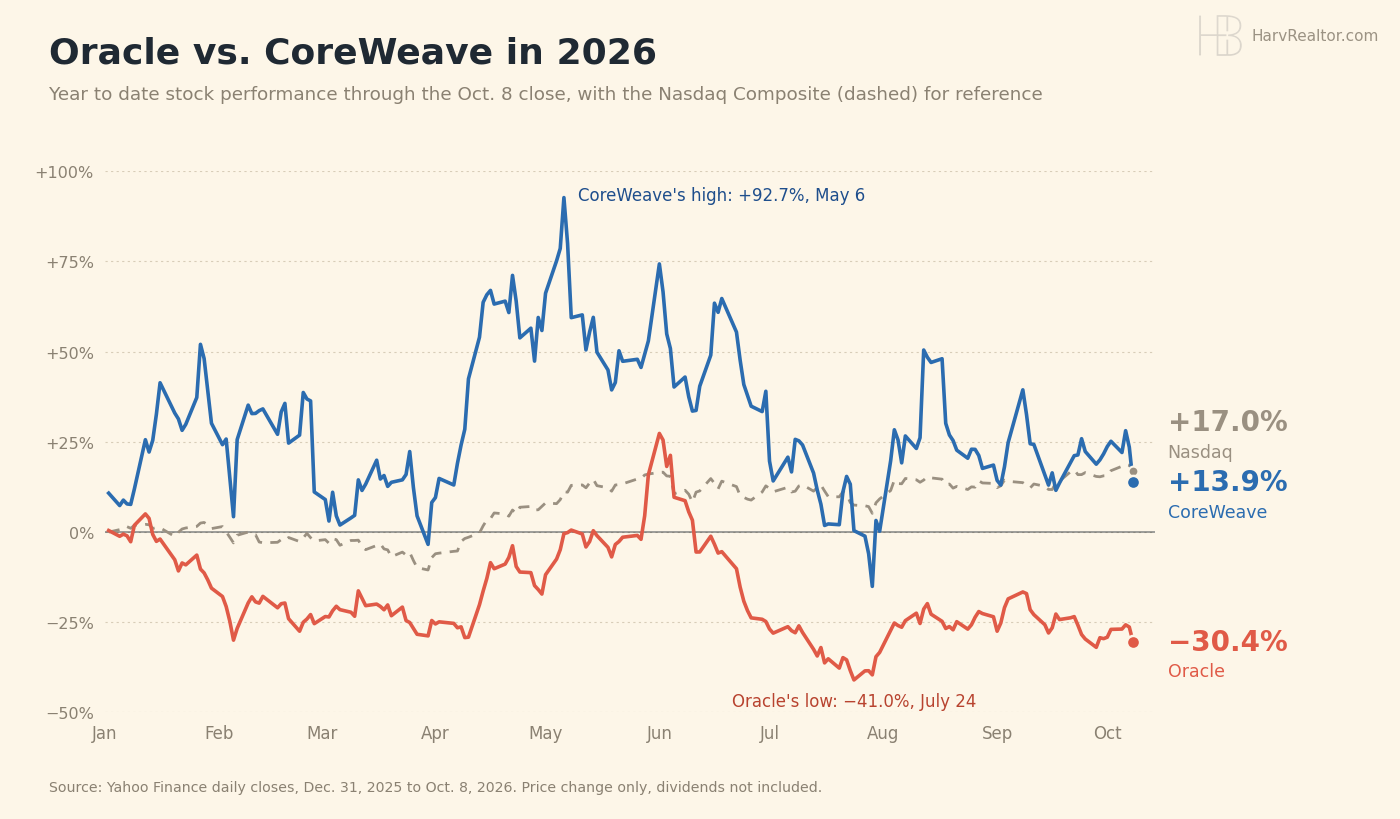
Two AI stocks, two different years. Oracle fell 5.48% and CoreWeave 7.77% Thursday after OpenAI, a major customer of both, put its revenue at about $50 billion a year, short of the $68 billion investors had heard. For 2026, CoreWeave, which rents out AI computing power, is still up 13.9% after being up as much as 92.7% in May. Oracle, which is borrowing heavily to build AI data centers, is down 30.4%. Both trail the Nasdaq's 17.0% gain.
Friday's open. Levels above are Thursday's close. At 9:20 AM PT Friday the S&P 500 was up 0.53% and the Nasdaq 0.60%, and Oracle had bounced more than 4%.
10-Year Treasury: 5.22% -0.06 | Gold: $4,157.00 +0.39% | Silver: $59.42 -1.44% | Brent Crude: $104.28 +4.07%
Tariffs, measured. A New York Fed study finds tariffs had added about 2.9 percentage points to goods inflation by February: goods prices rose 2.0% over the year, and the authors estimate they would have fallen about 0.9% without tariffs.
Steady jobs, sour mood. First time jobless claims fell to 197,000 in the week ending Oct. 3, the lowest since July. Friday, the University of Michigan's preliminary October consumer sentiment index fell to 46.3 from 48.1, and year ahead inflation expectations rose to 4.7%.
Bitcoin: $82,902 +2.05% | Ethereum: $2,495.56 +2.53% | XRP: $1.39 +2.36%
A Friday bounce. Bitcoin is up 2.05% over 24 hours near $82,900, Ether up 2.53% and XRP up 2.36%, live from CoinGecko at 9:20 AM PT, after Bitcoin fell 1.90% Thursday. JPMorgan estimates about $50 billion has flowed into digital assets so far this year, about half of last year's pace, with crypto ETF flows positive for the year again after outflows in May and June.
Sources
- Mortgage News Daily (30 and 15 year fixed, daily index Sept. 8 to Oct. 8)
- Mortgage News Daily (Mortgage Rate Watch, October 8, 2026)
- U.S. Treasury (10-Year daily yield curve, October 8)
- Yahoo Finance (Oracle, CoreWeave and Nasdaq daily closes, 2026)
- CNBC (OpenAI revenue, October 8, 2026)
- Federal Reserve Bank of New York (tariff pass through, October 6, 2026)
- U.S. Department of Labor (weekly jobless claims, October 8, 2026)
- University of Michigan (Surveys of Consumers, preliminary October 2026)
- The Block (JPMorgan crypto inflow estimate, October 8, 2026)
- CNBC quotes (index closes, COMEX and ICE settlements)
- CoinGecko (live crypto, 9:20 AM PT October 9) and Coinbase (Bitcoin daily candle)
- REALTY EXPERTS® Live Inventory (five city ledger, October 9)
Disclaimer: The market data, rates, and information provided are for informational purposes only and should not be considered financial advice. Always verify rates and data with your lender or financial advisor before making any decisions.
Based on information from the Bay East Association of REALTORS® (Bay East MLS) as of October 9, 2026. All data, including all measurements and calculations of area, is obtained from various sources and has not been, and will not be, verified by broker or MLS. All information should be independently reviewed and verified for accuracy. Properties may or may not be listed by the office/agent presenting the information.