


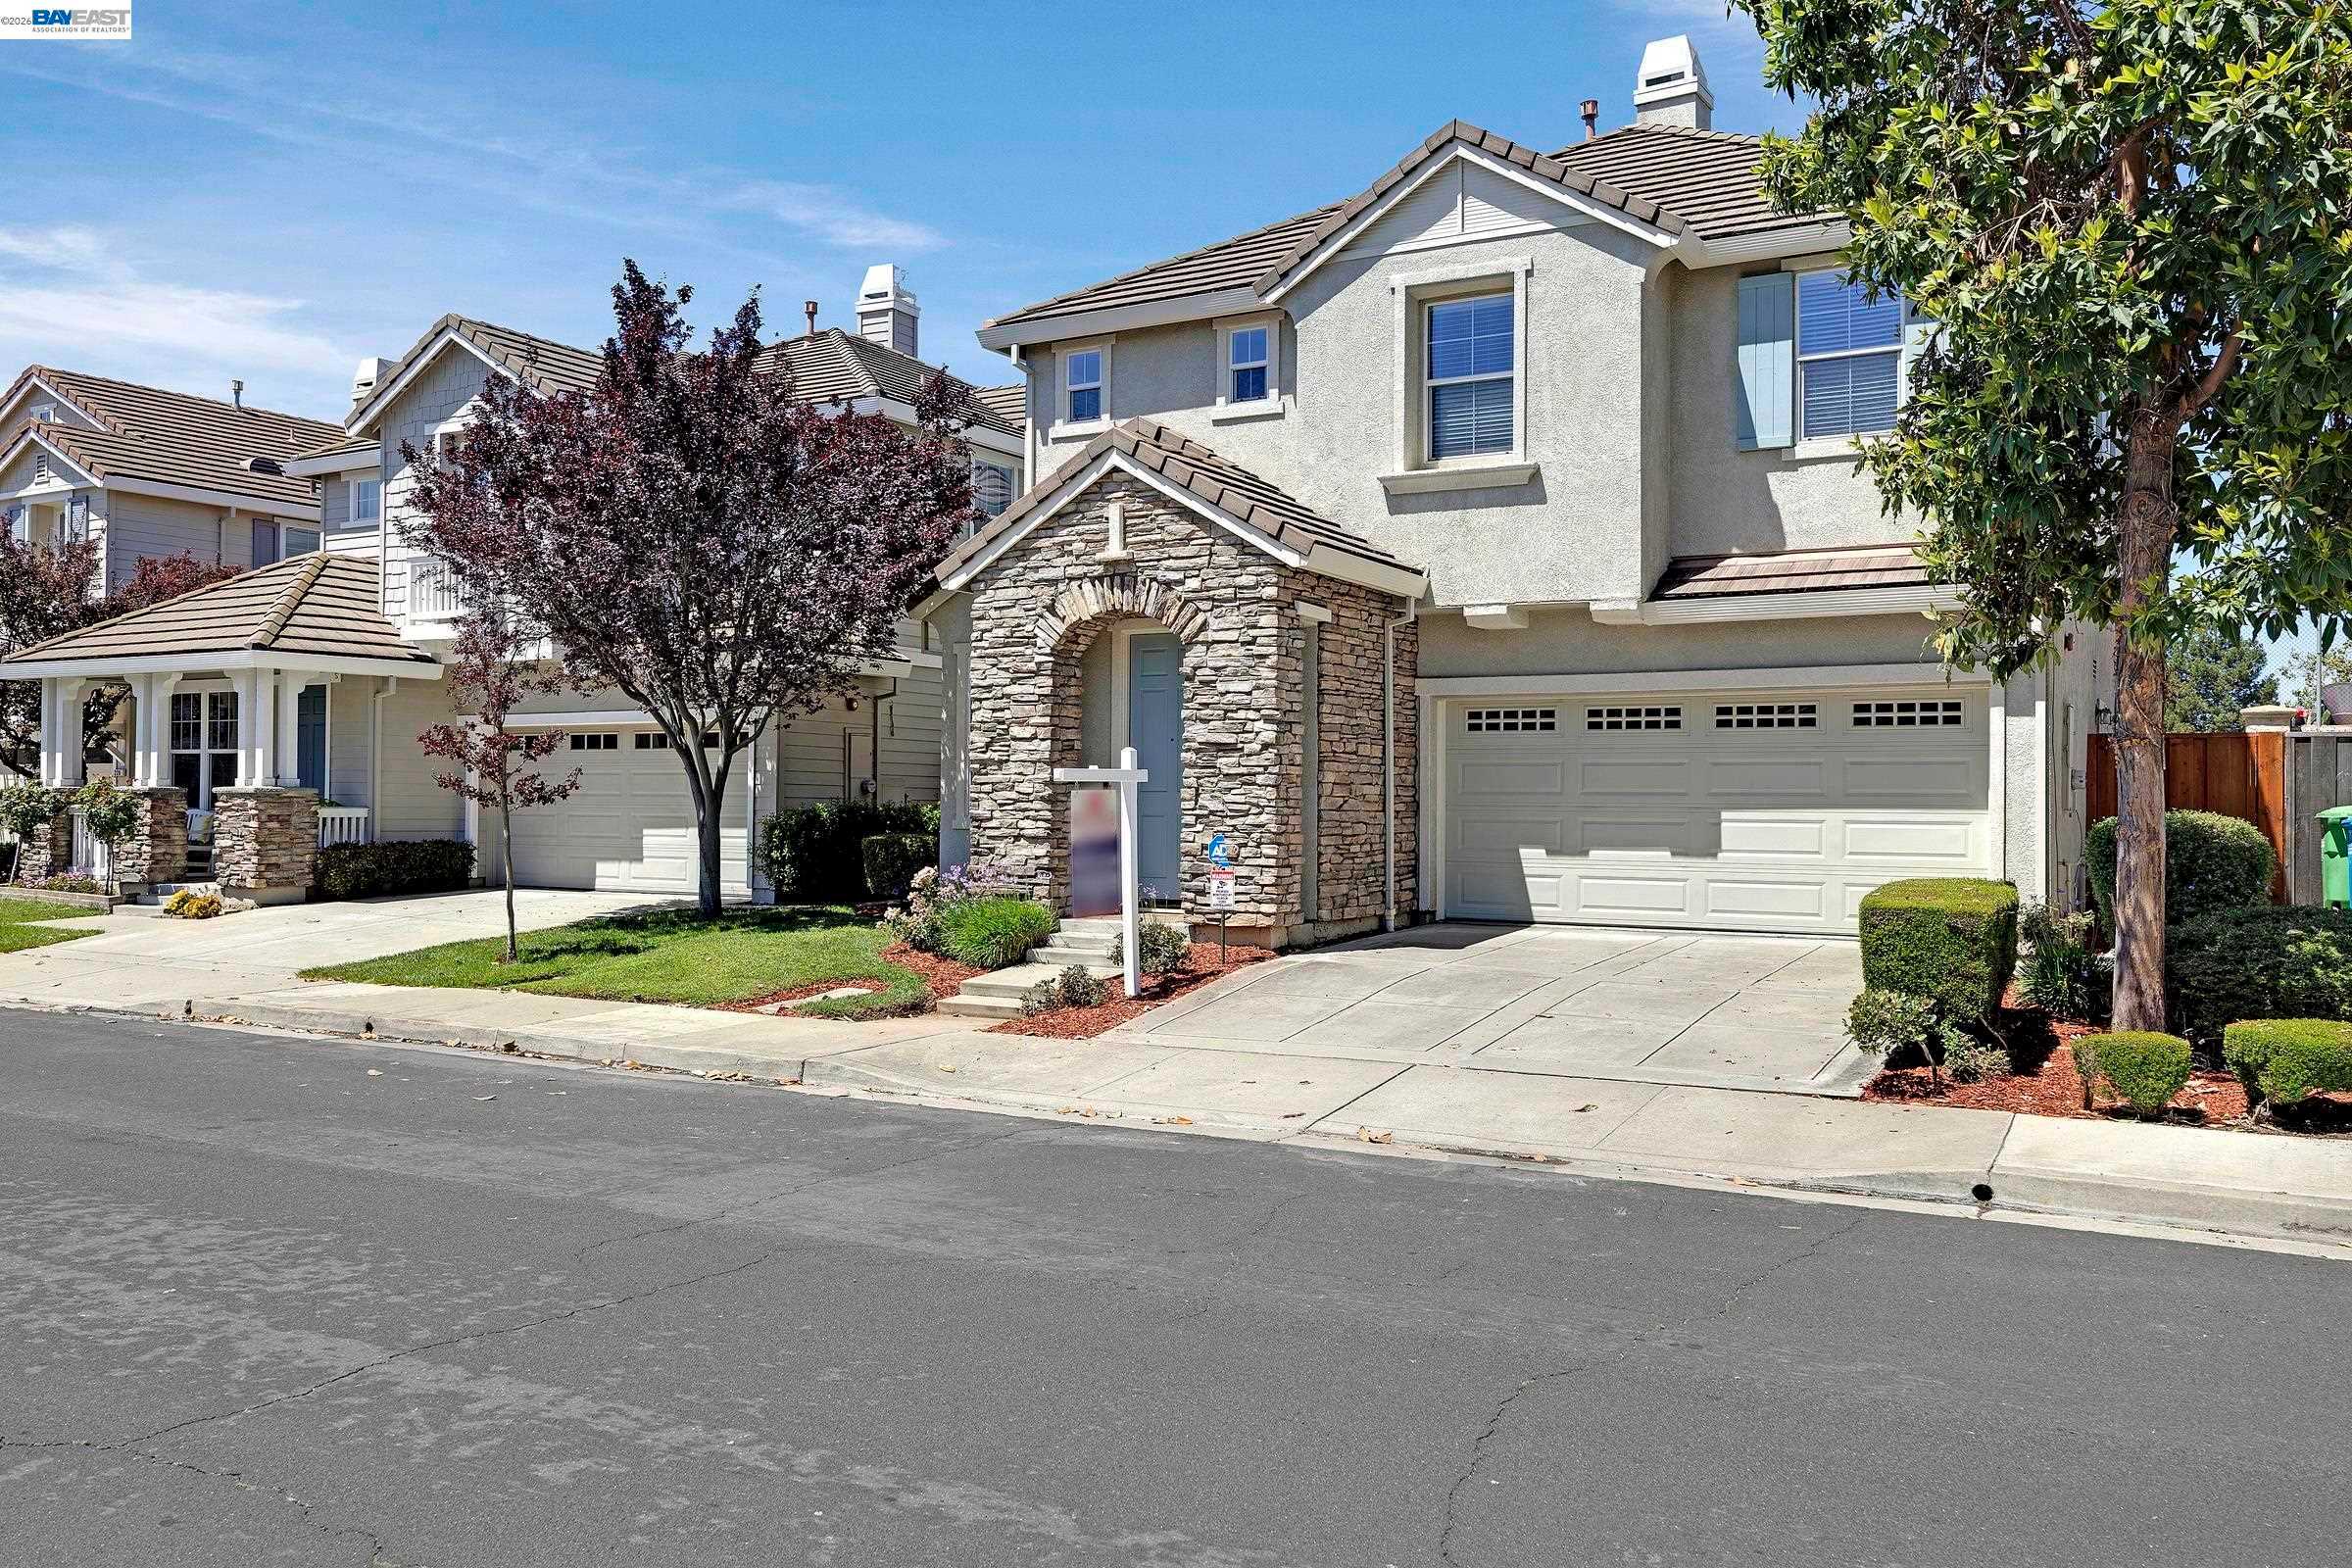
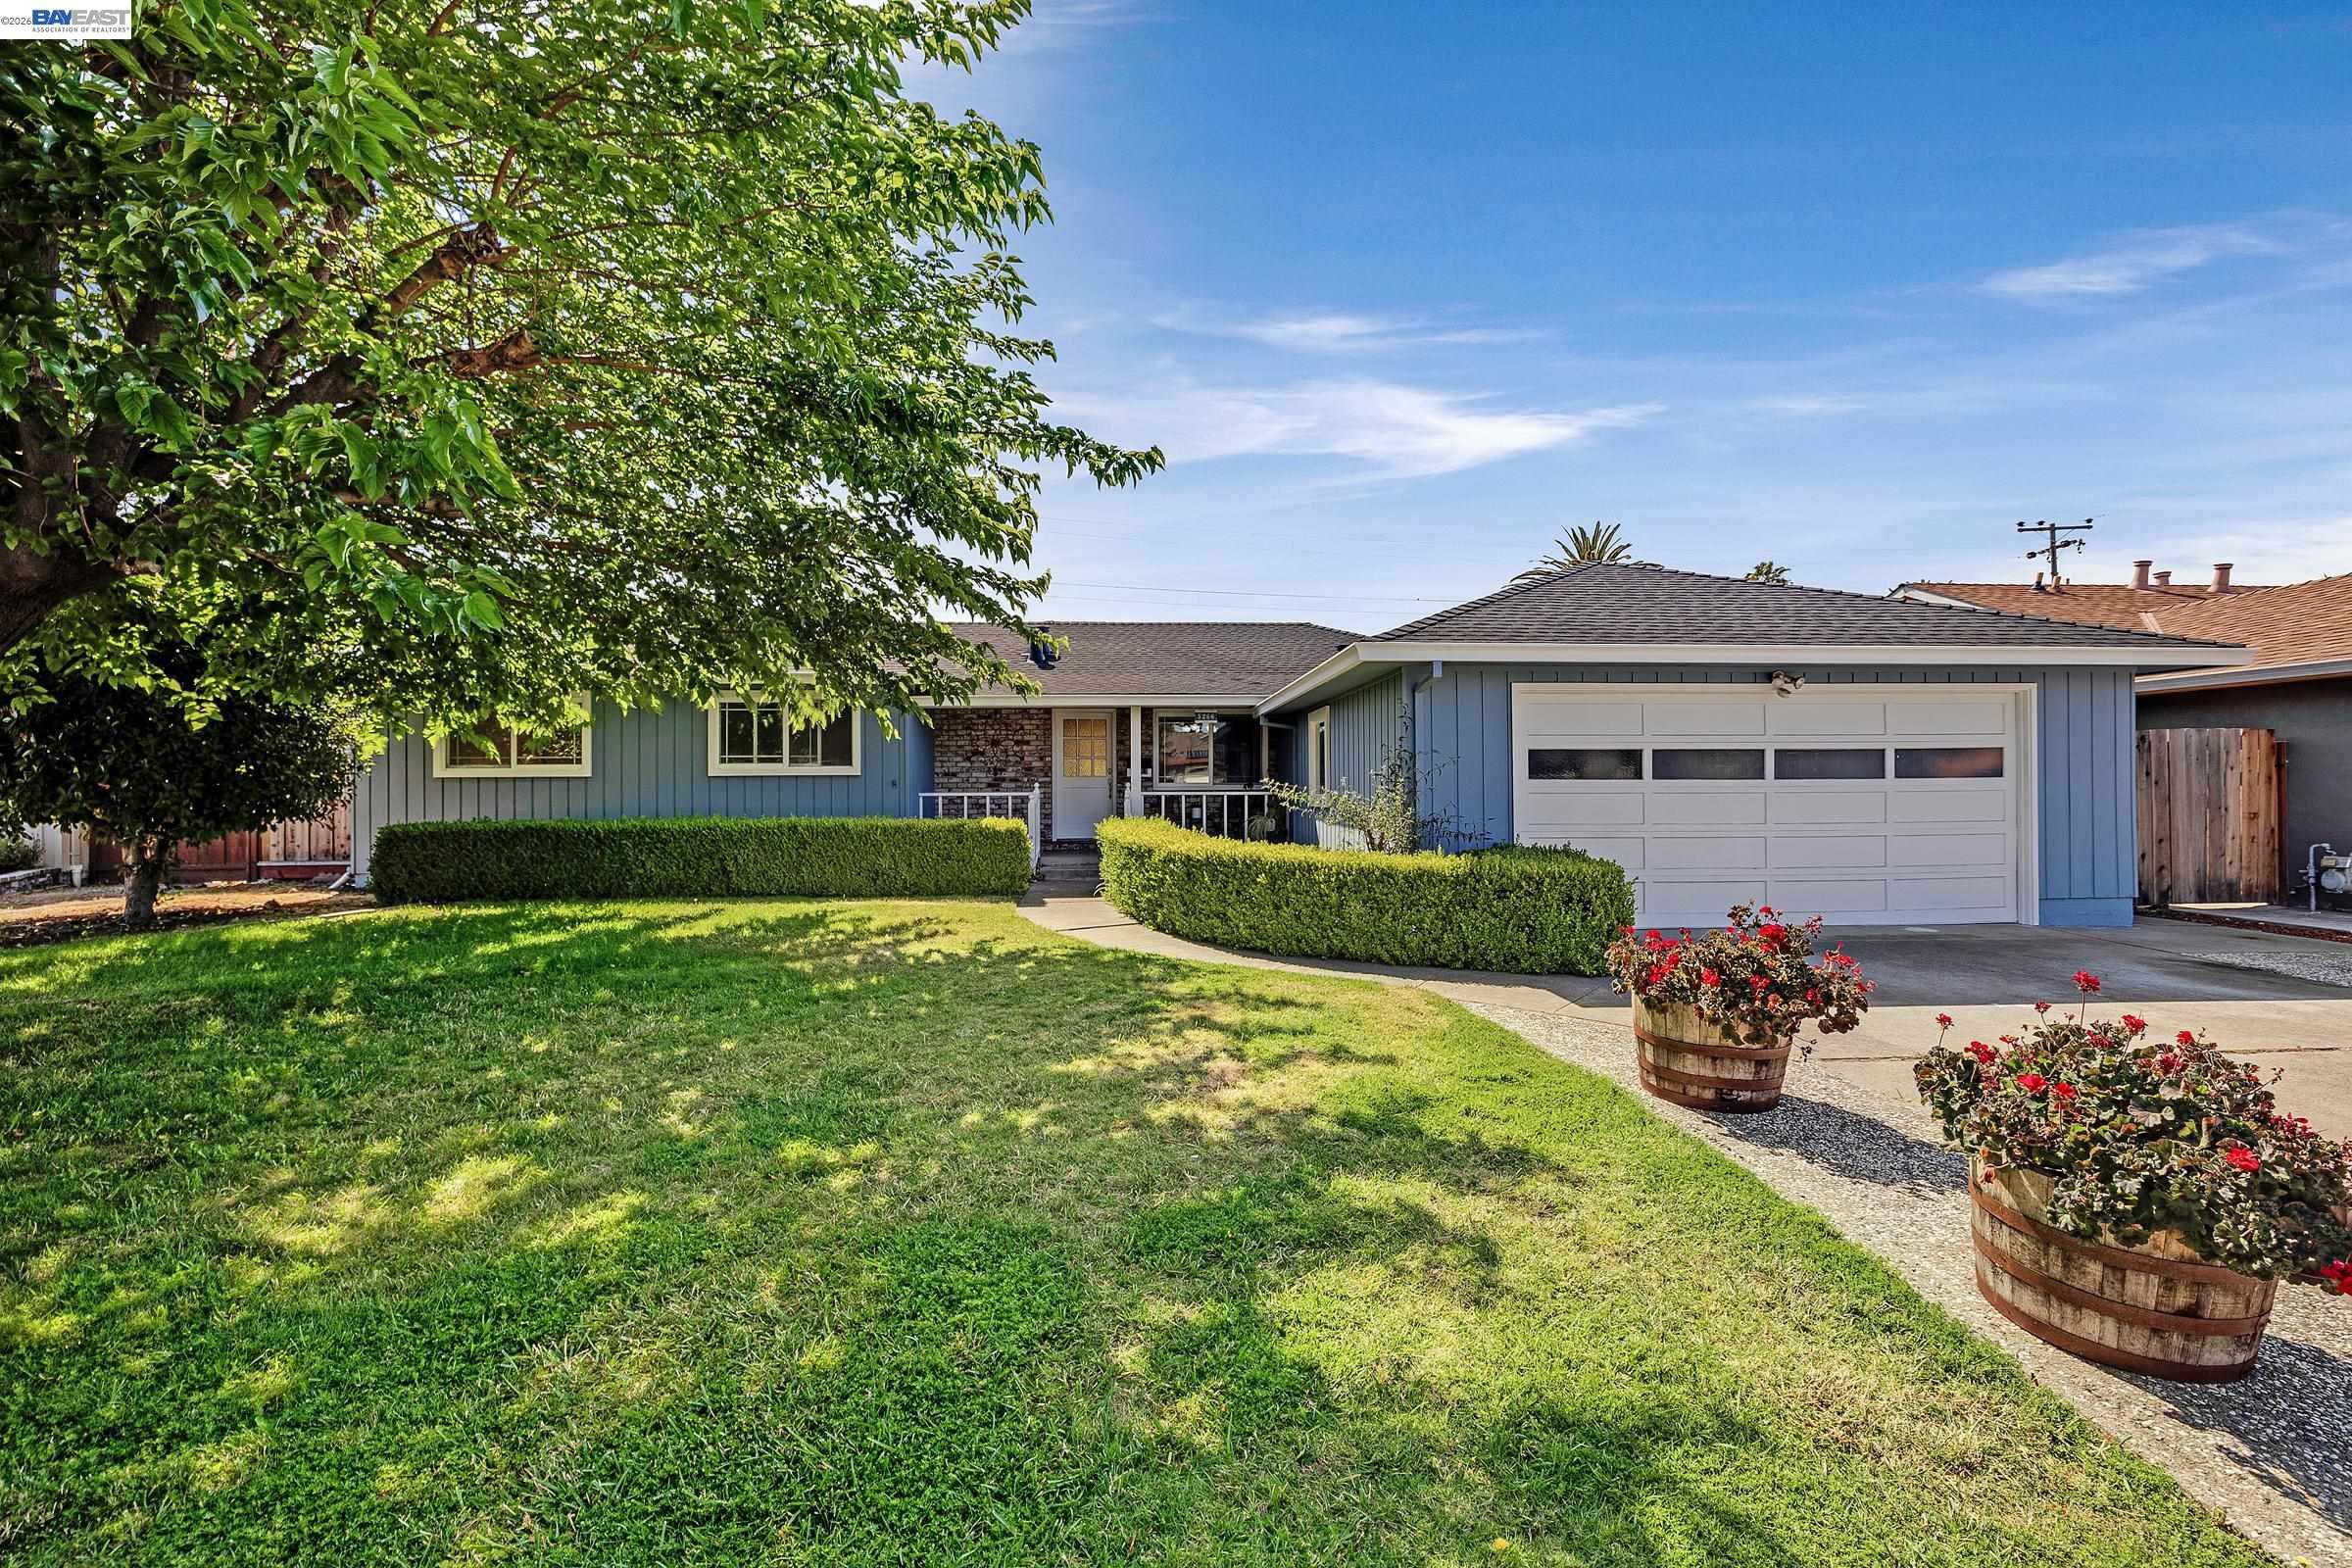
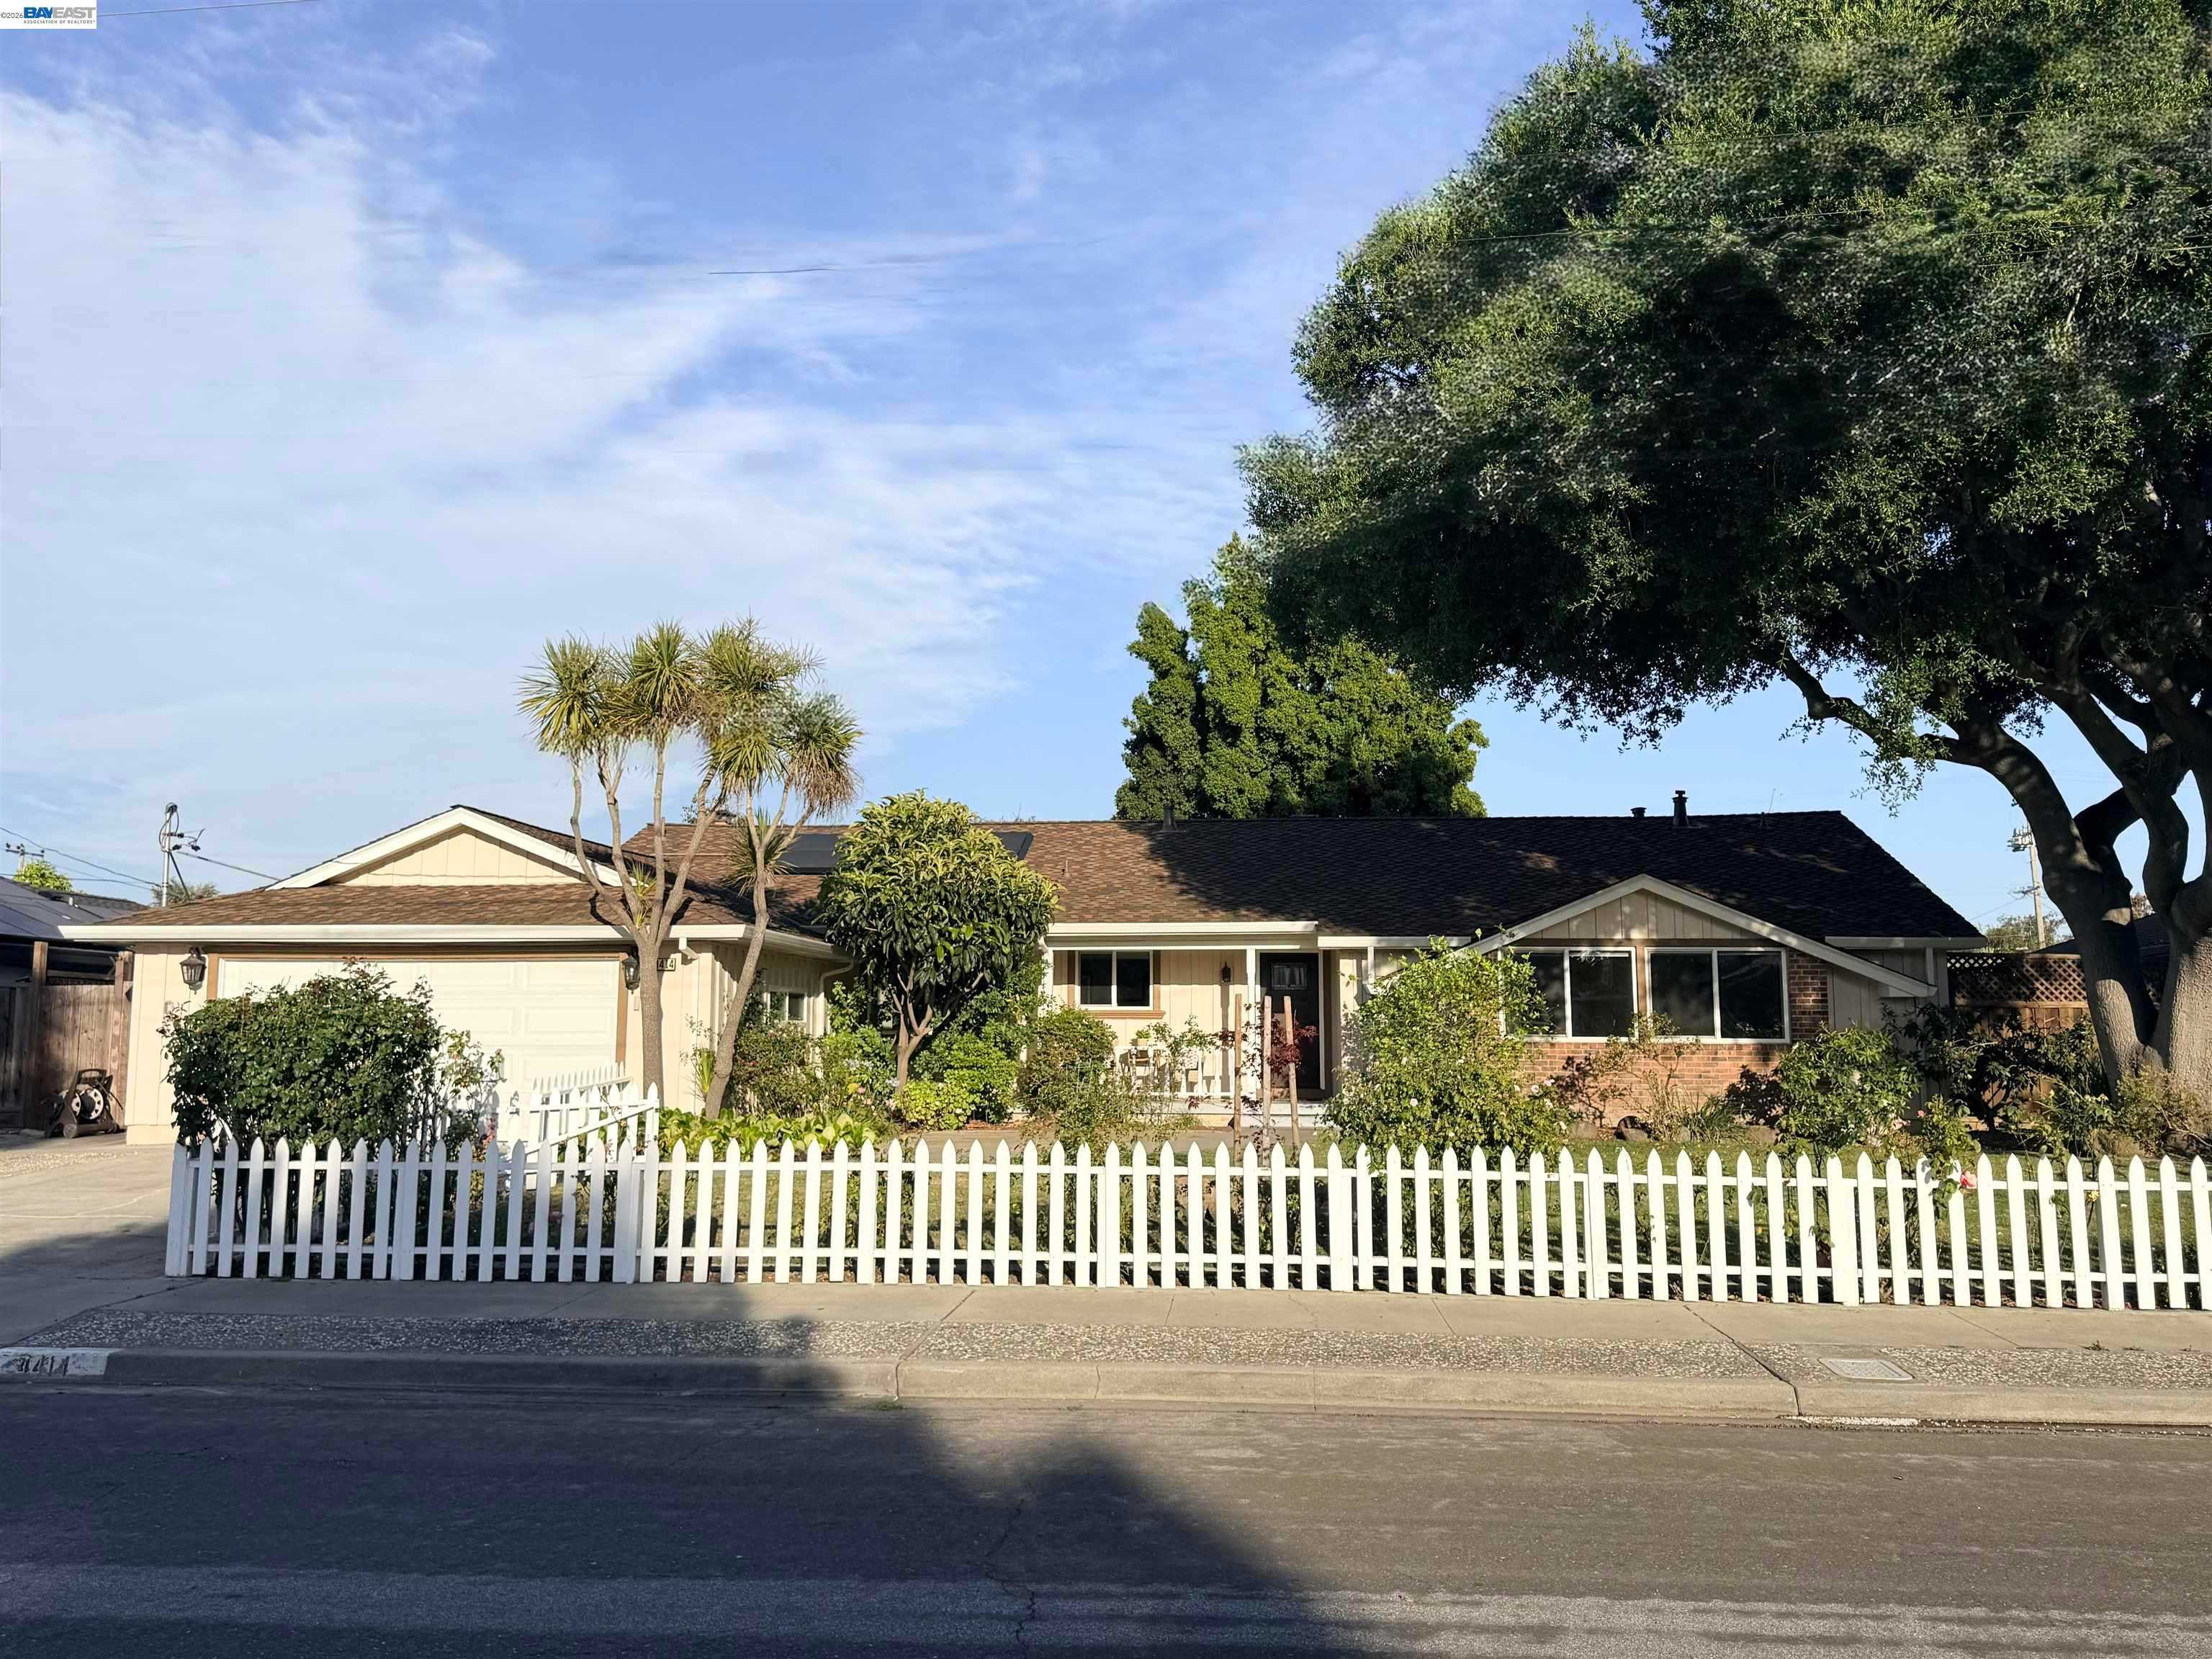

"At a Glance" Local Housing STATS and News 10/07/26
October 7, 2026 · Alameda County Market Dashboard
TODAY'S LIVE INVENTORY
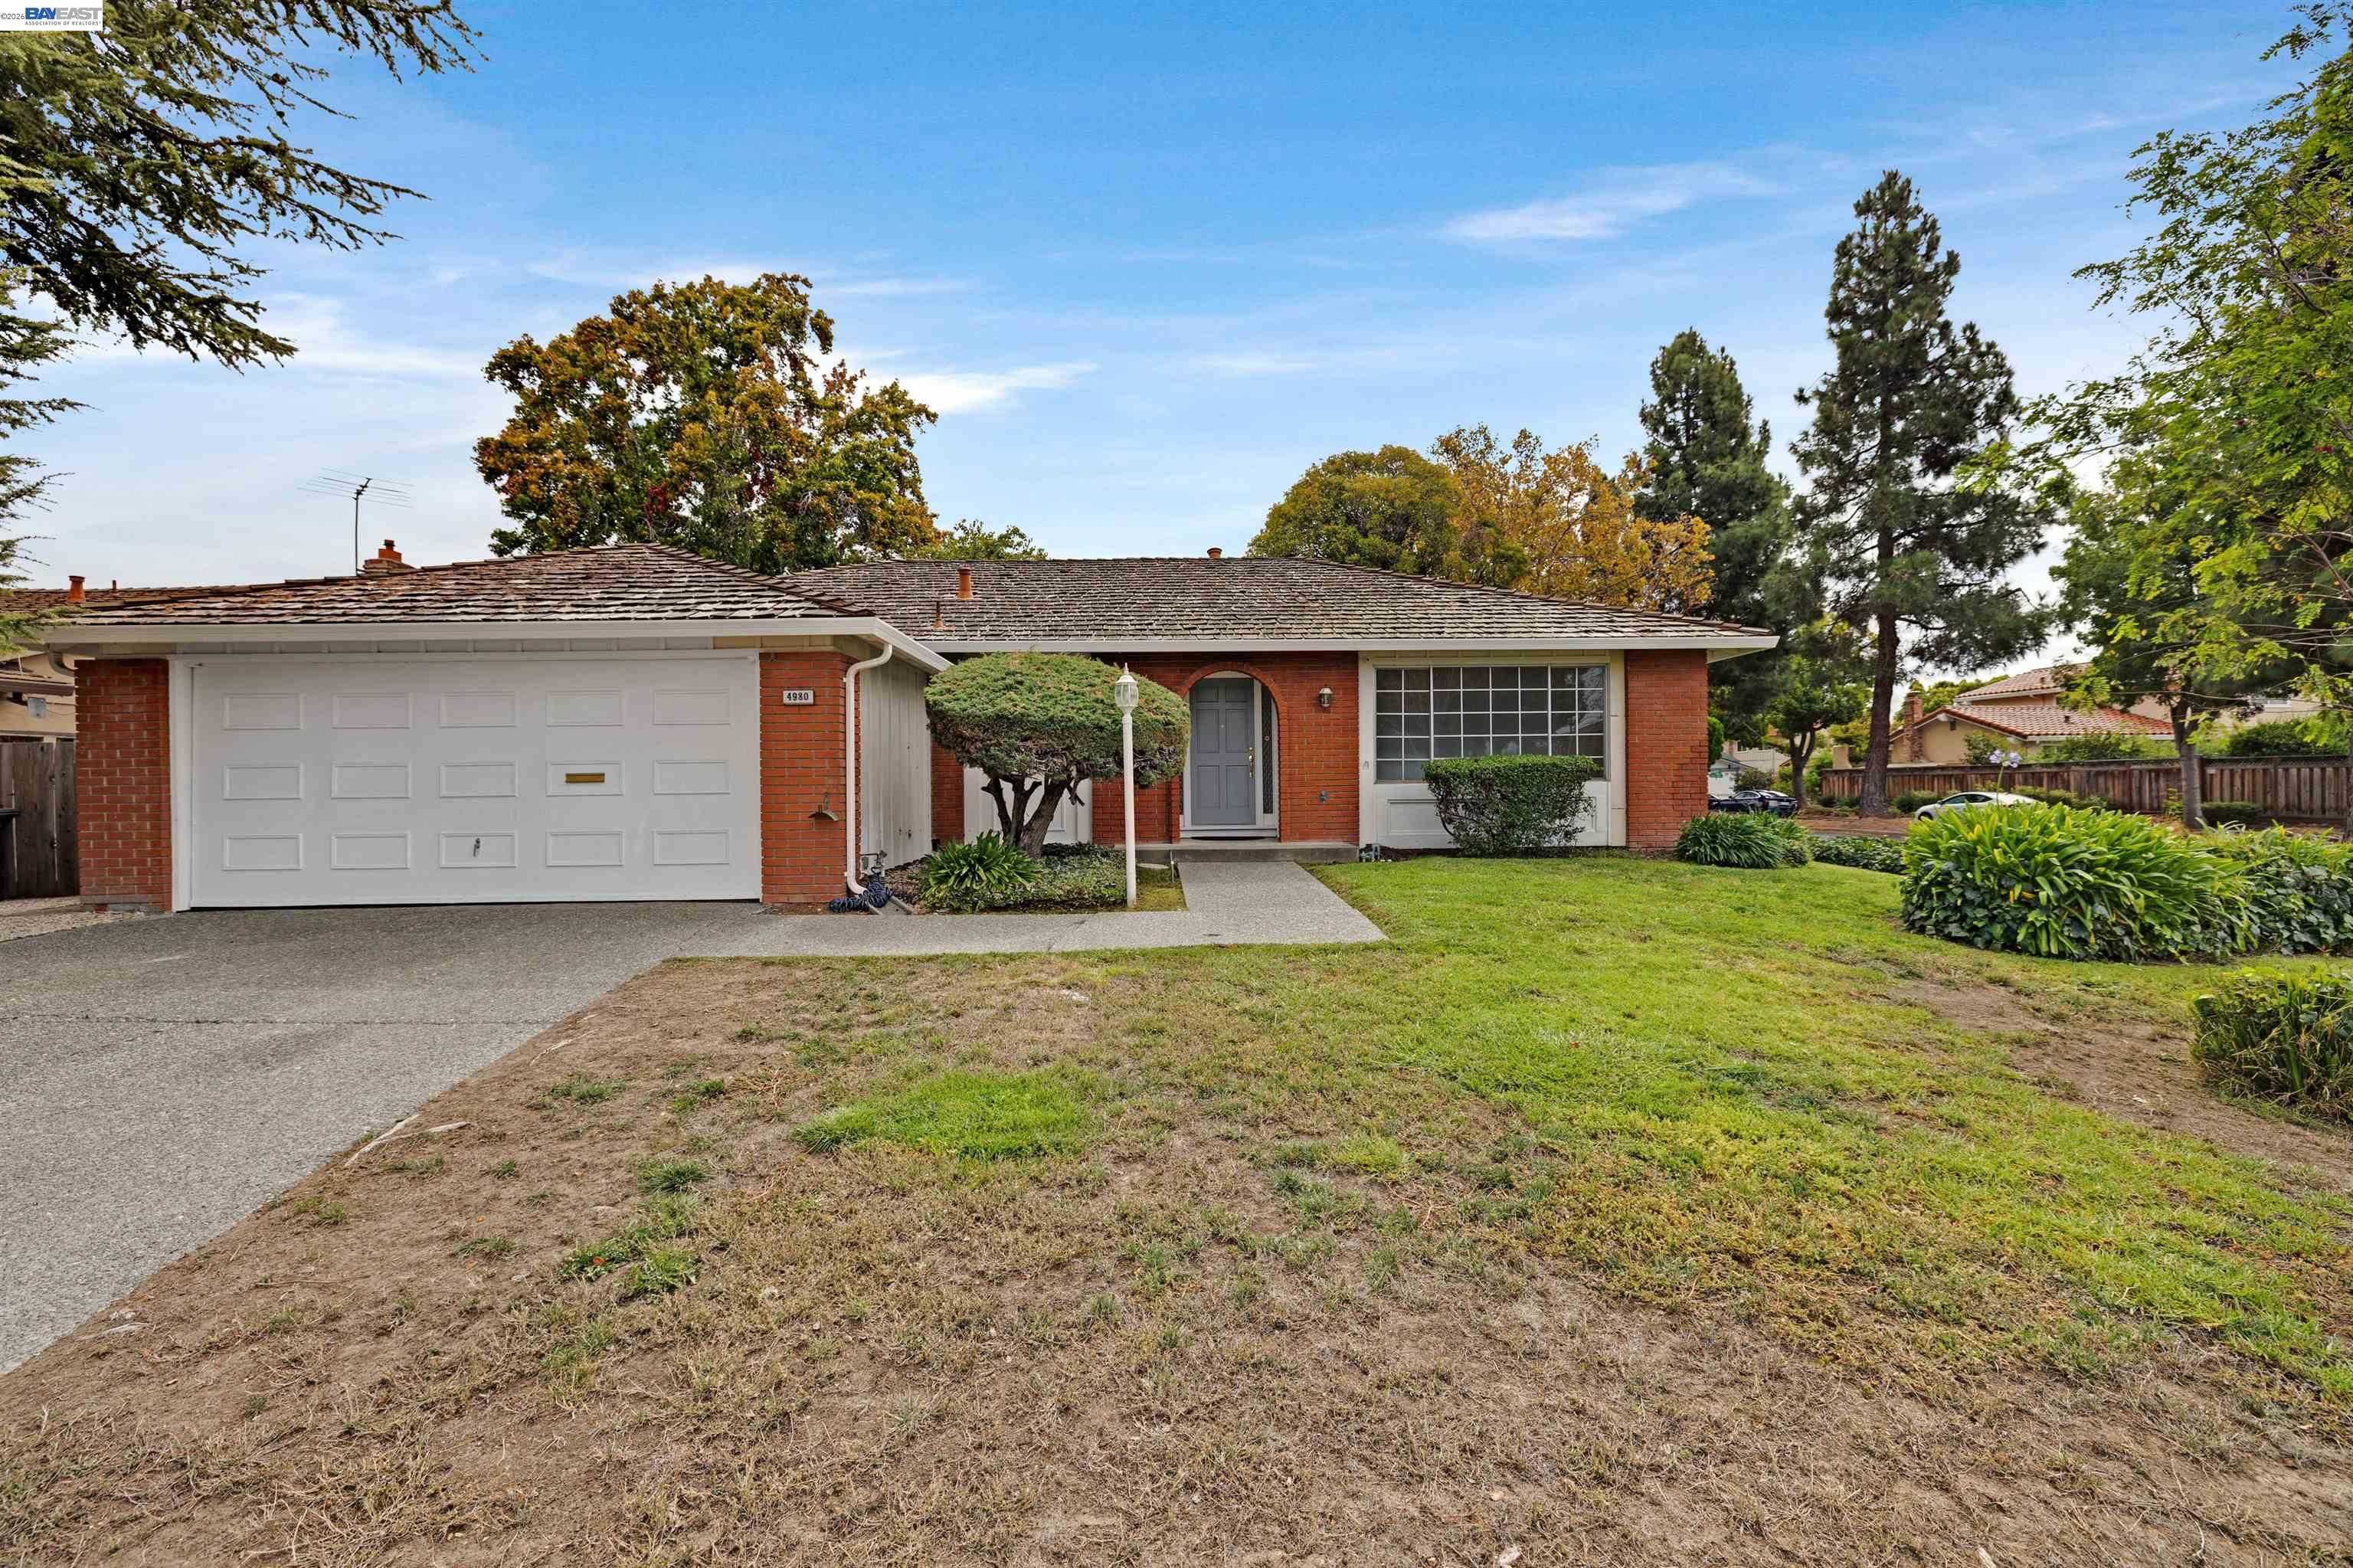
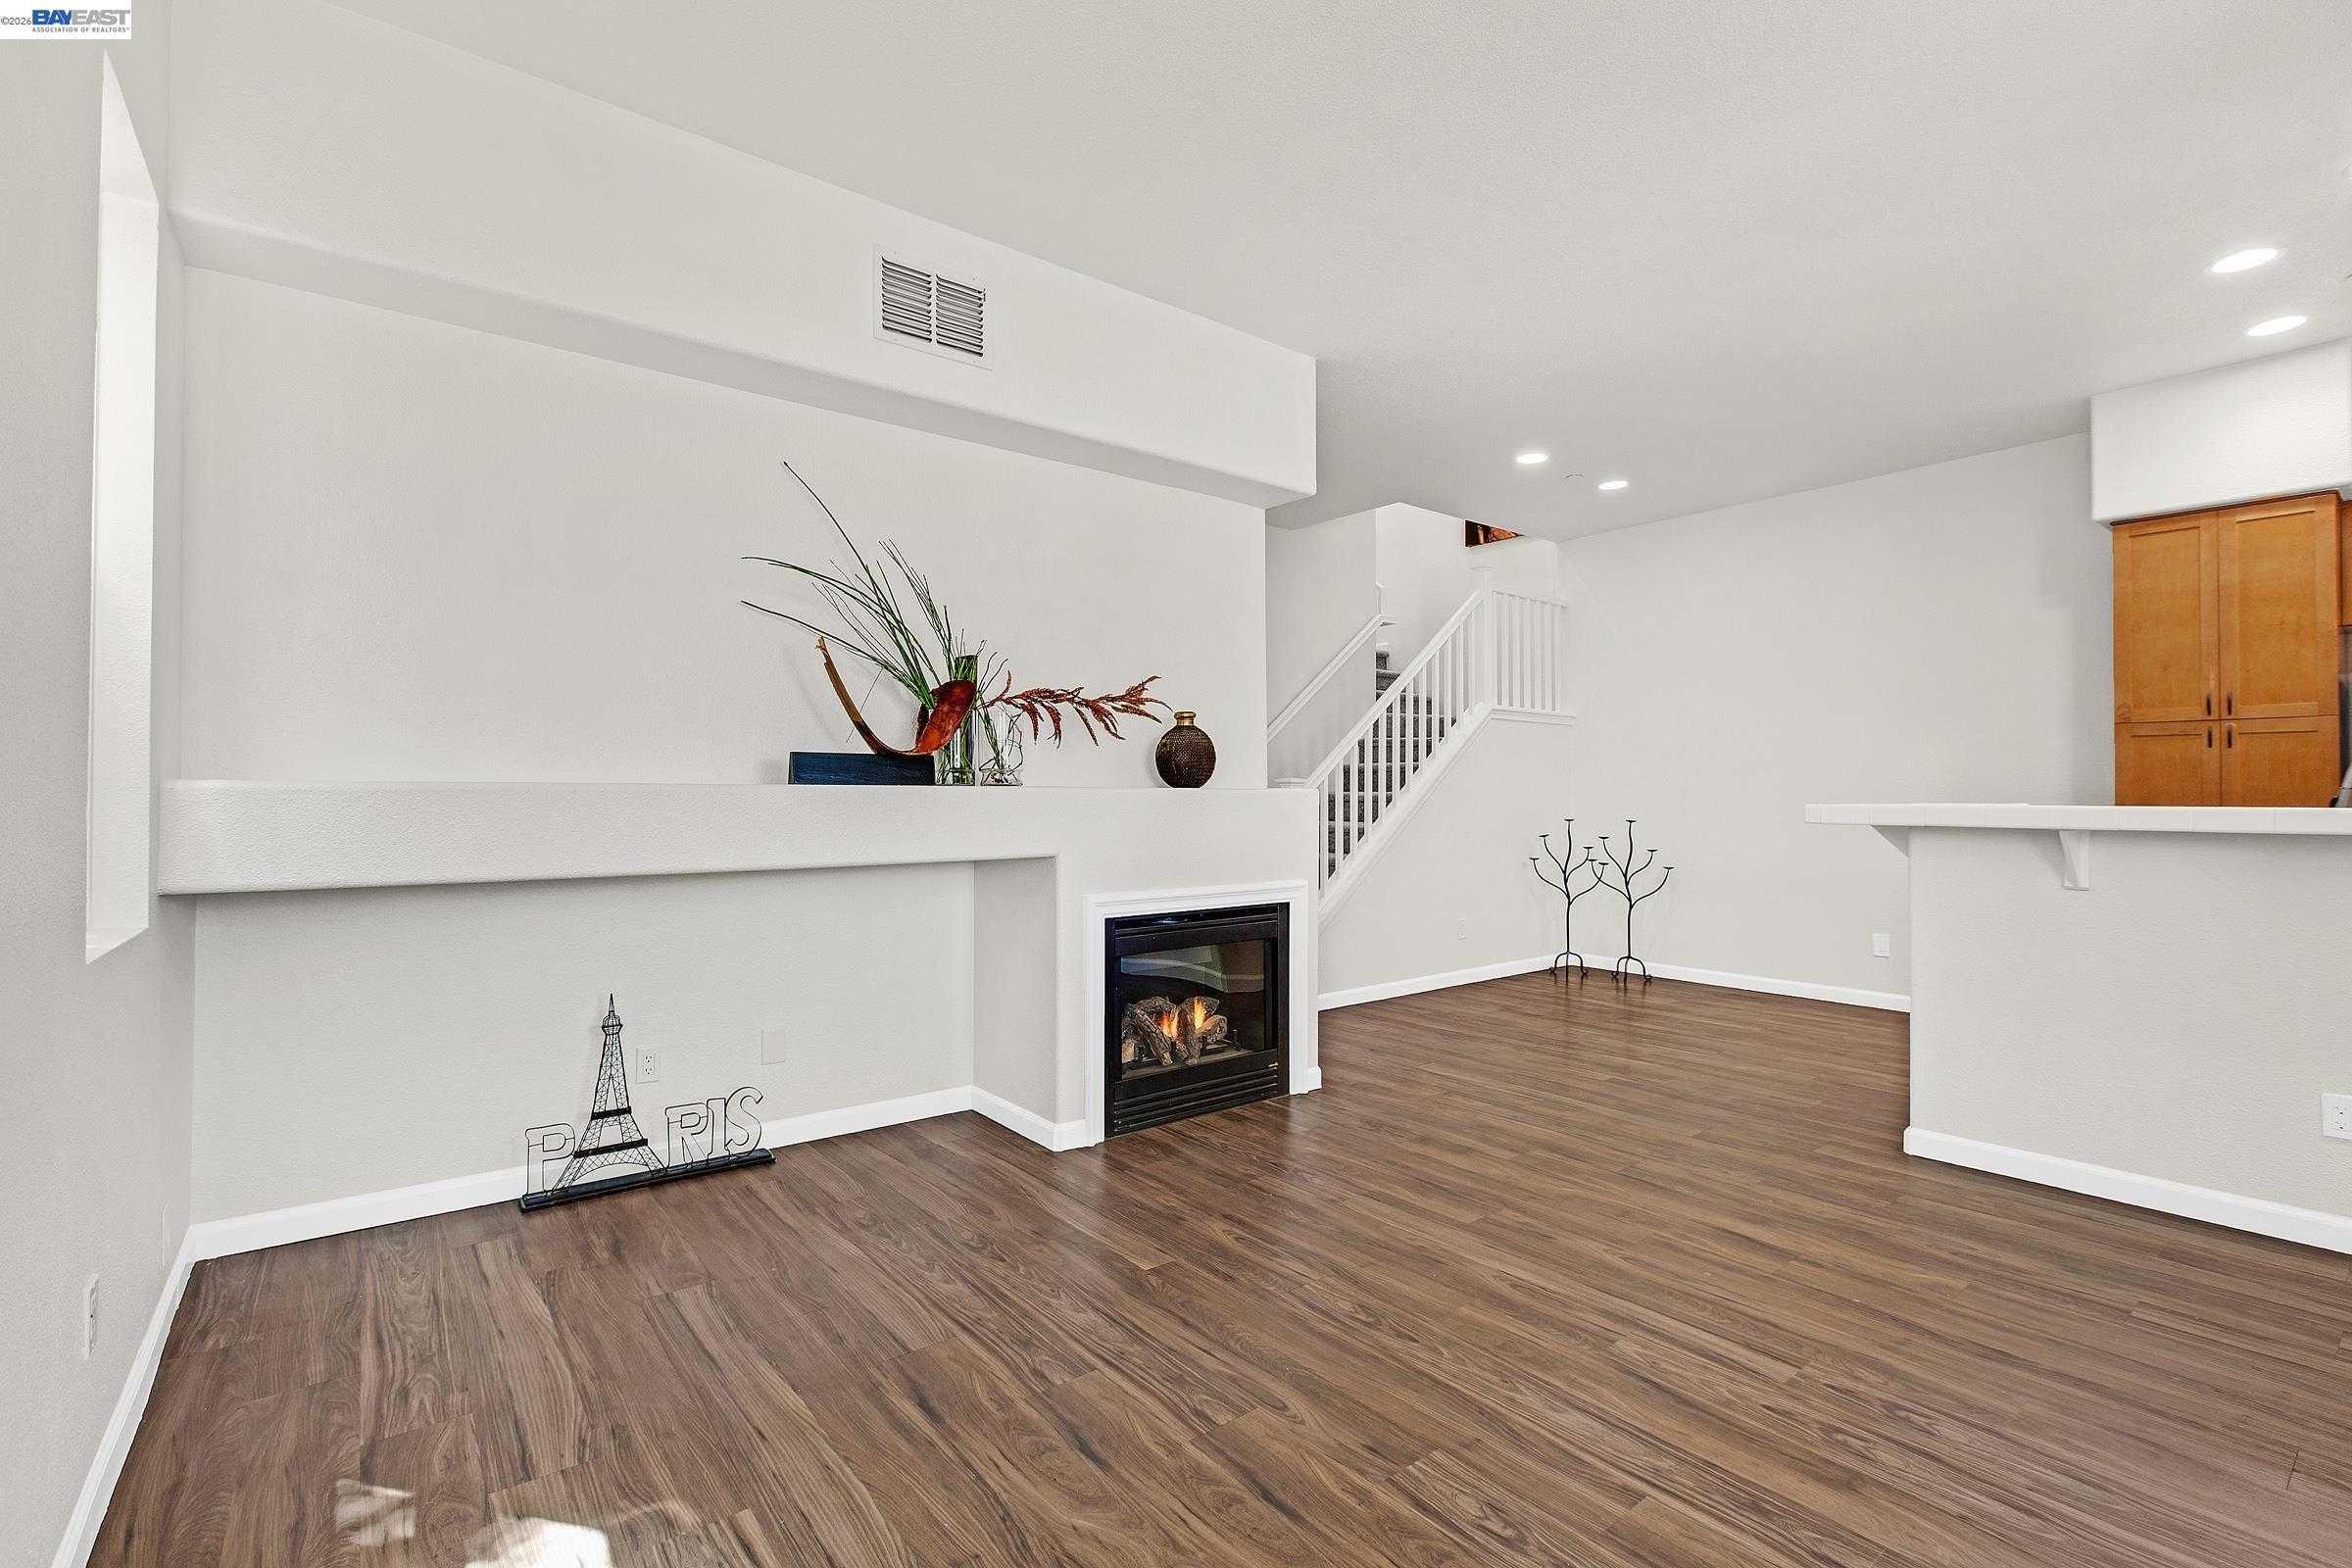
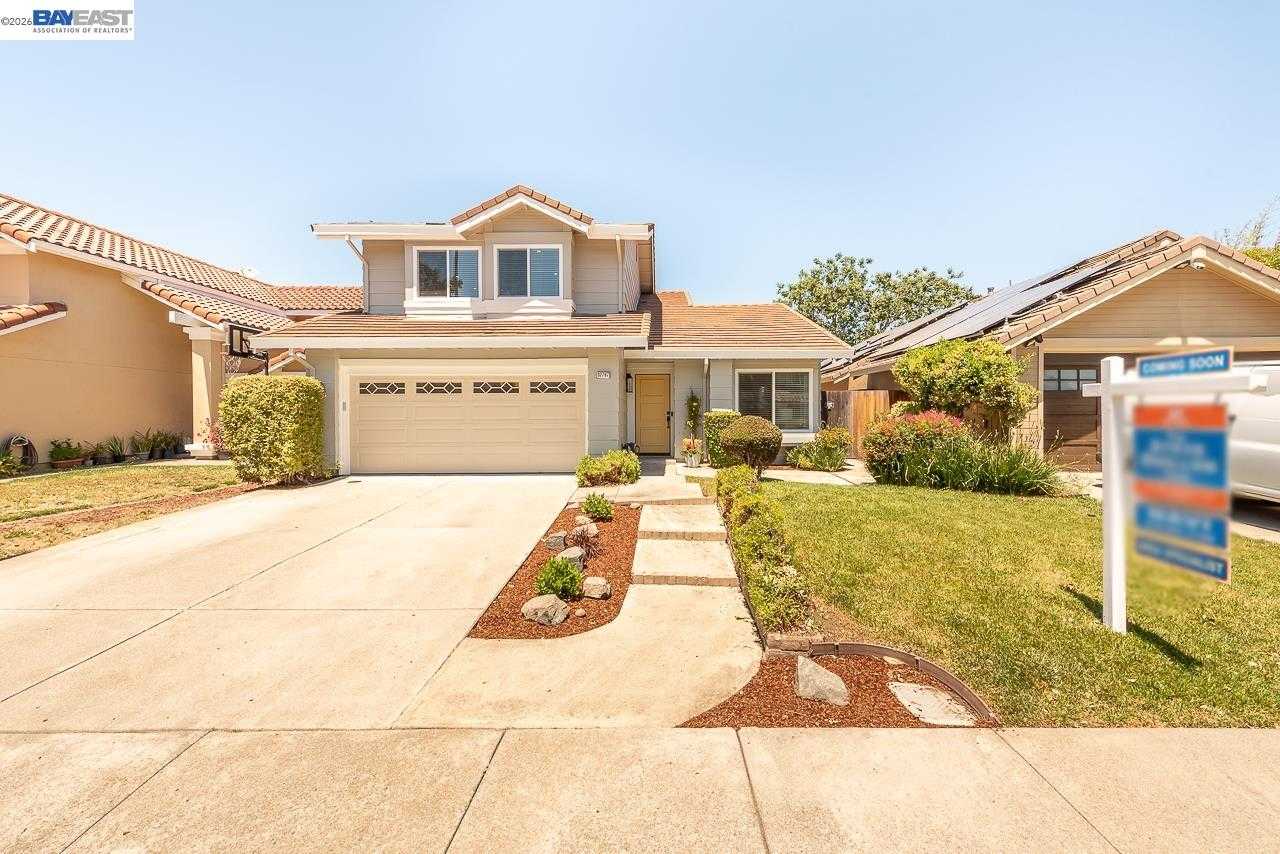
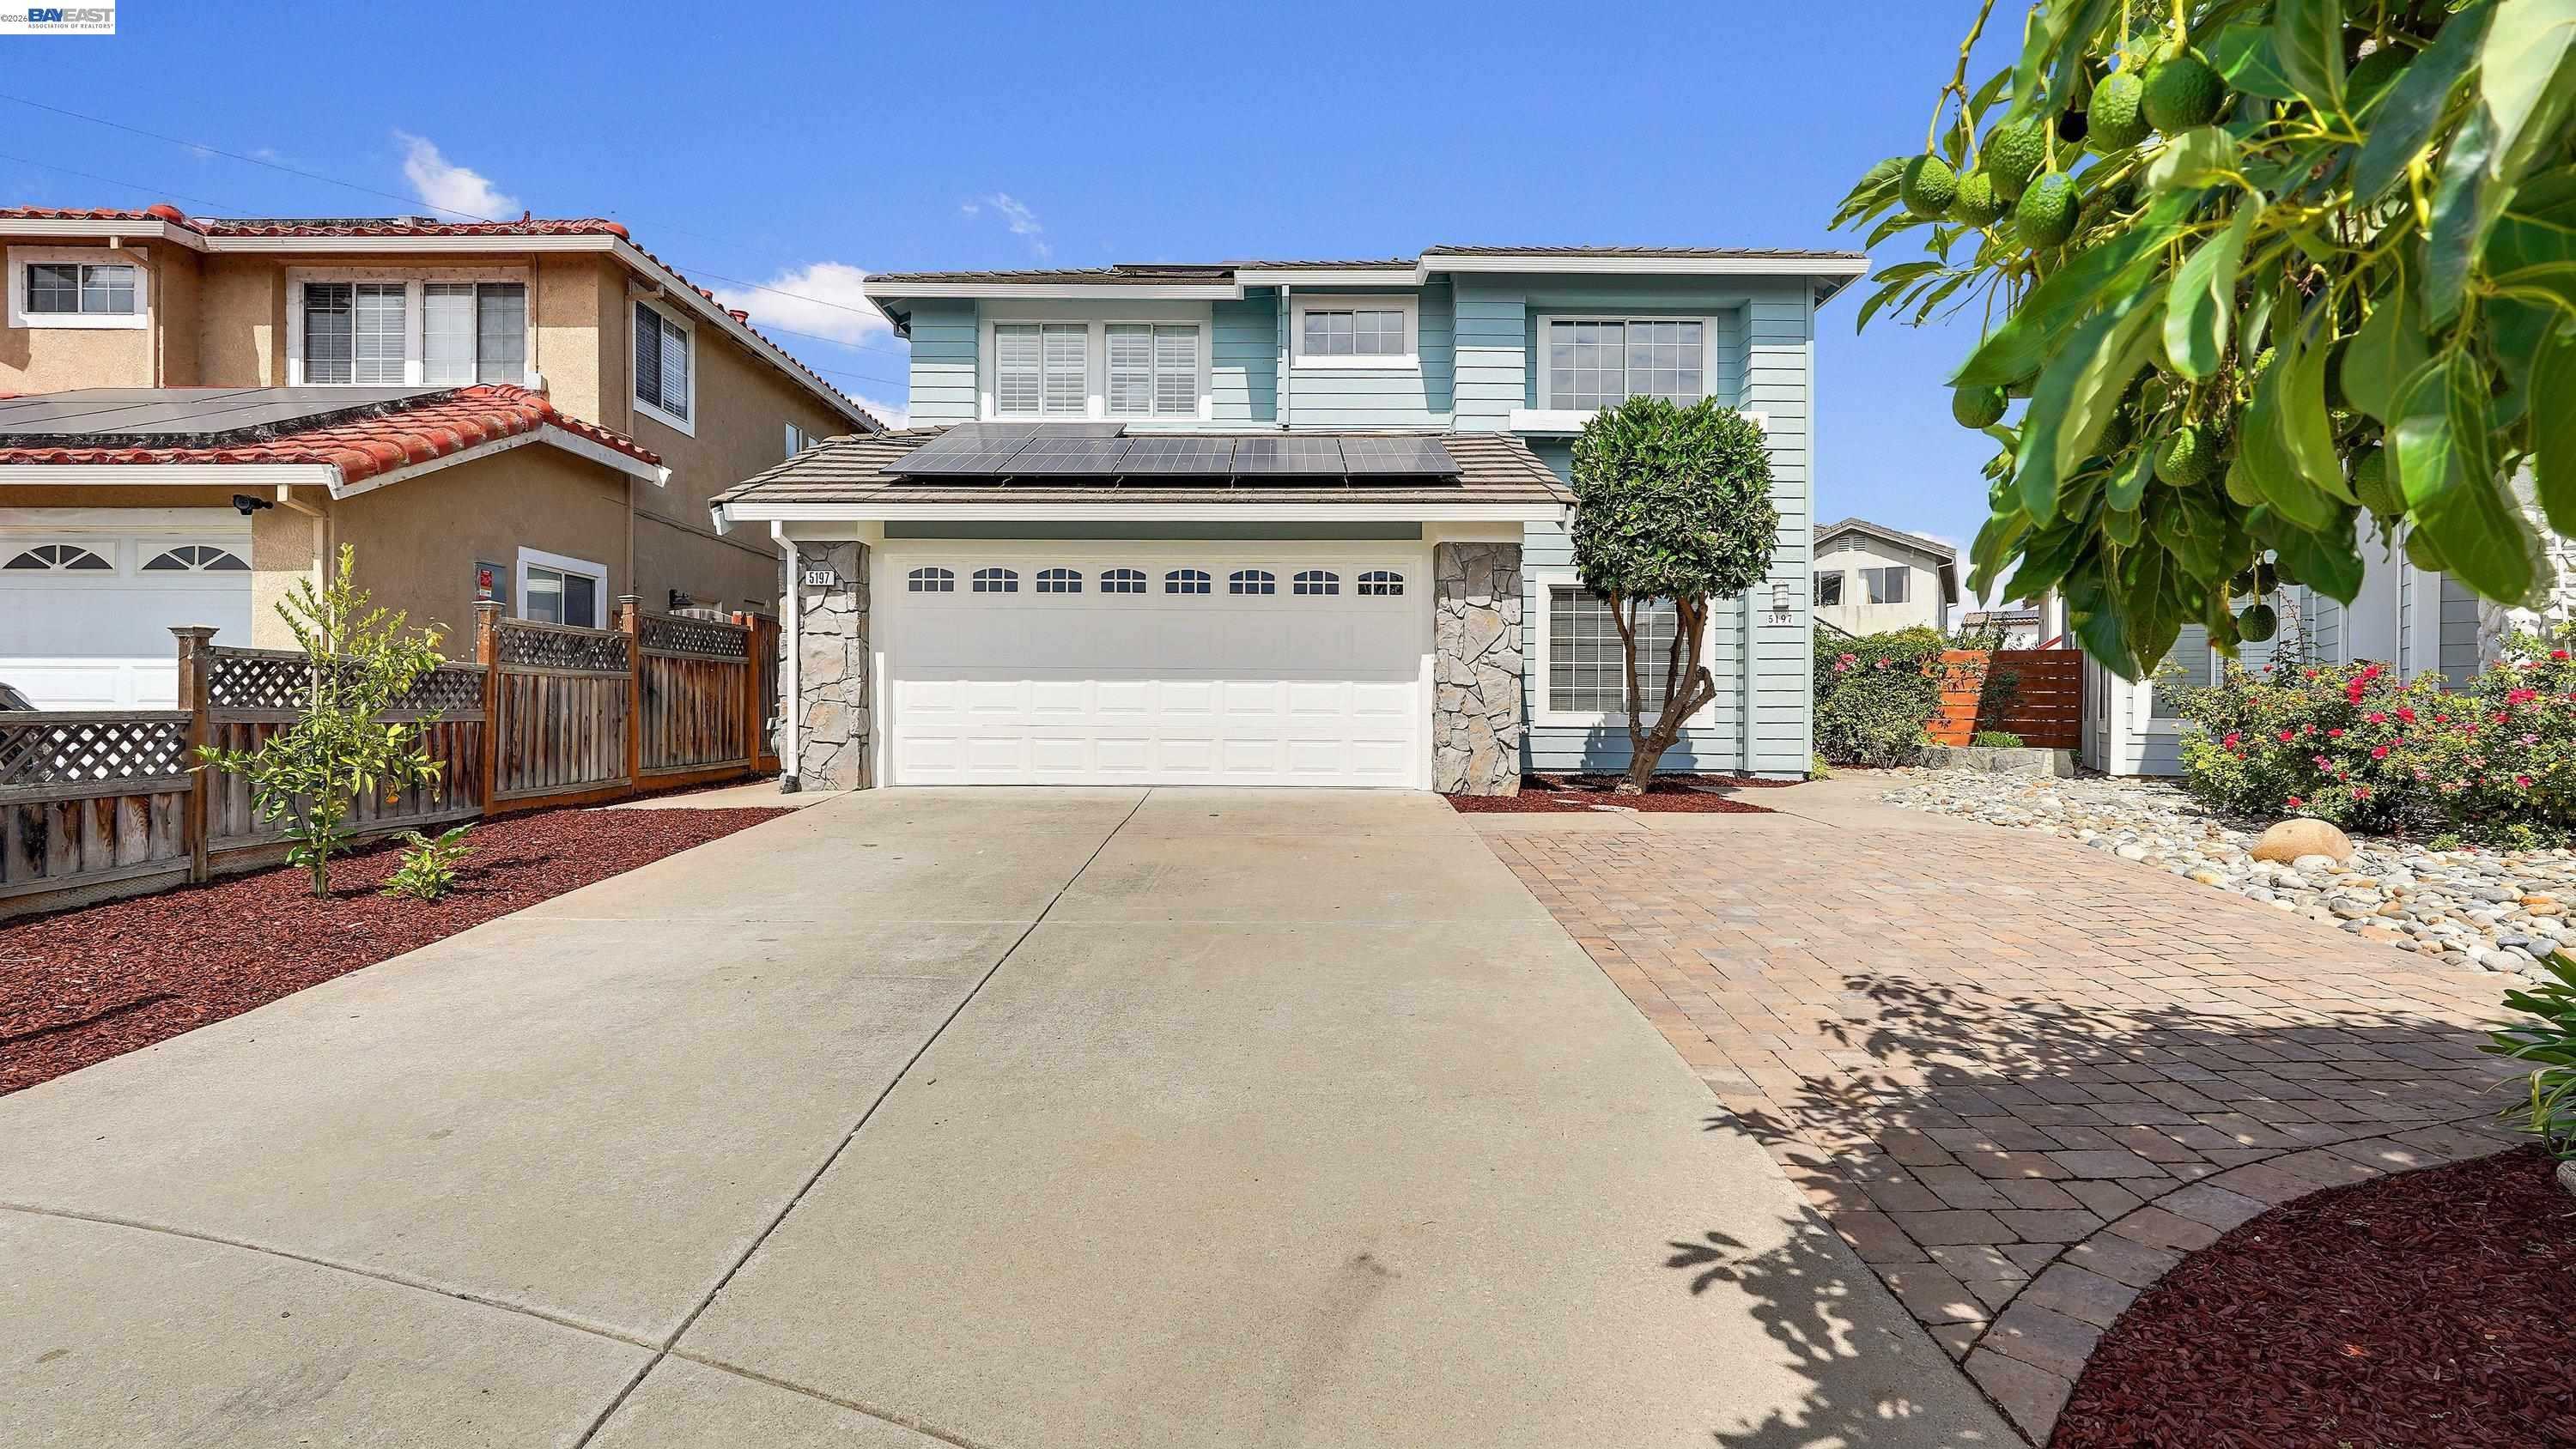
Behind these county totals: hundreds of homes still for sale in Fremont, Hayward, Union City, Newark and Milpitas, counted, priced and sorted every morning from the same MLS export, with a map search for the homes themselves.
30-Year Fixed: 7.56% -0.05 | 15-Year Fixed: 7.22% -0.01
A one day breather. Mortgage News Daily's 30-year fixed eased to 7.56% Tuesday from Monday's 7.61%, and the 15-year to 7.22%. It may not last: this morning the 10-Year Treasury touched 5.35%, its highest level since April 2002 according to CNBC, so expect lenders to give some of that back today.
What it means for you. At 7.56%, the five city median list price of $1,079,000 with 20% down runs about $6,071 a month in principal and interest, $392 more than on Sept. 1. If you are buying, the 150 homes that have sat 60 days or longer are where I would ask for seller credits toward a rate buydown. If you are selling and not getting showings, price for today's payment, not for summer's.
Today's count. Board wide: 2,643 listings across the 15 city table, counting active and in contract together, with 167 coming soon and 170 brand new. The five city ledger carries 685 live listings across Fremont, Hayward, Milpitas, Newark and Union City, 609 on the market and 76 coming soon. That is up from 671, but only because the ledger now counts the 21 homes in price change status, which are still for sale; on yesterday's rules it would be 664.
Fremont holds 244 live listings: 200 active, 29 coming soon and 15 brand new, with a median on market list price of $1,275,000 at $797 a square foot and a typical listing out 30 days. Hayward carries 183, Milpitas 108, Newark 88 and Union City 62. Across all five cities the median is $1,079,000 at $680 a square foot, 286 homes are priced under a million, and 150 have been sitting 60 days or longer.
S&P 500: 7,818.93 +0.58% | Dow: 51,521.28 +0.49% | Nasdaq: 27,599.79 +0.45%
Records, then a retreat. The S&P 500 closed above 7,800 for the first time Tuesday and the Nasdaq set another record. As of 7:58 AM PT Wednesday the Dow is down 1.03% and the S&P 500 down 0.62%, with Treasury yields at a 24 year high and the Fed's September minutes due this afternoon.
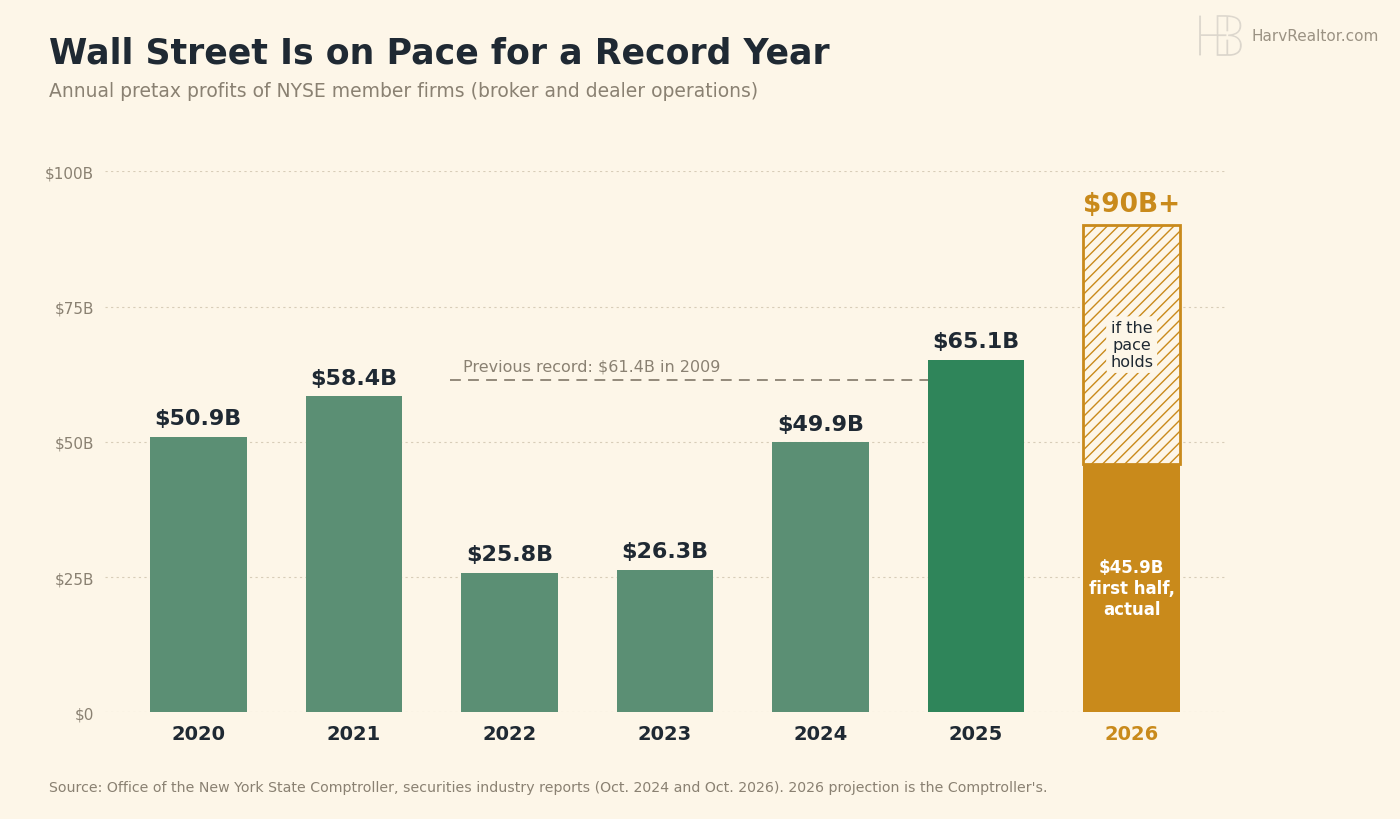
Wall Street's best half ever. New York's Comptroller says NYSE member firms earned $45.9 billion before taxes in the first half and could top $90 billion for 2026, against last year's record $65.1 billion.
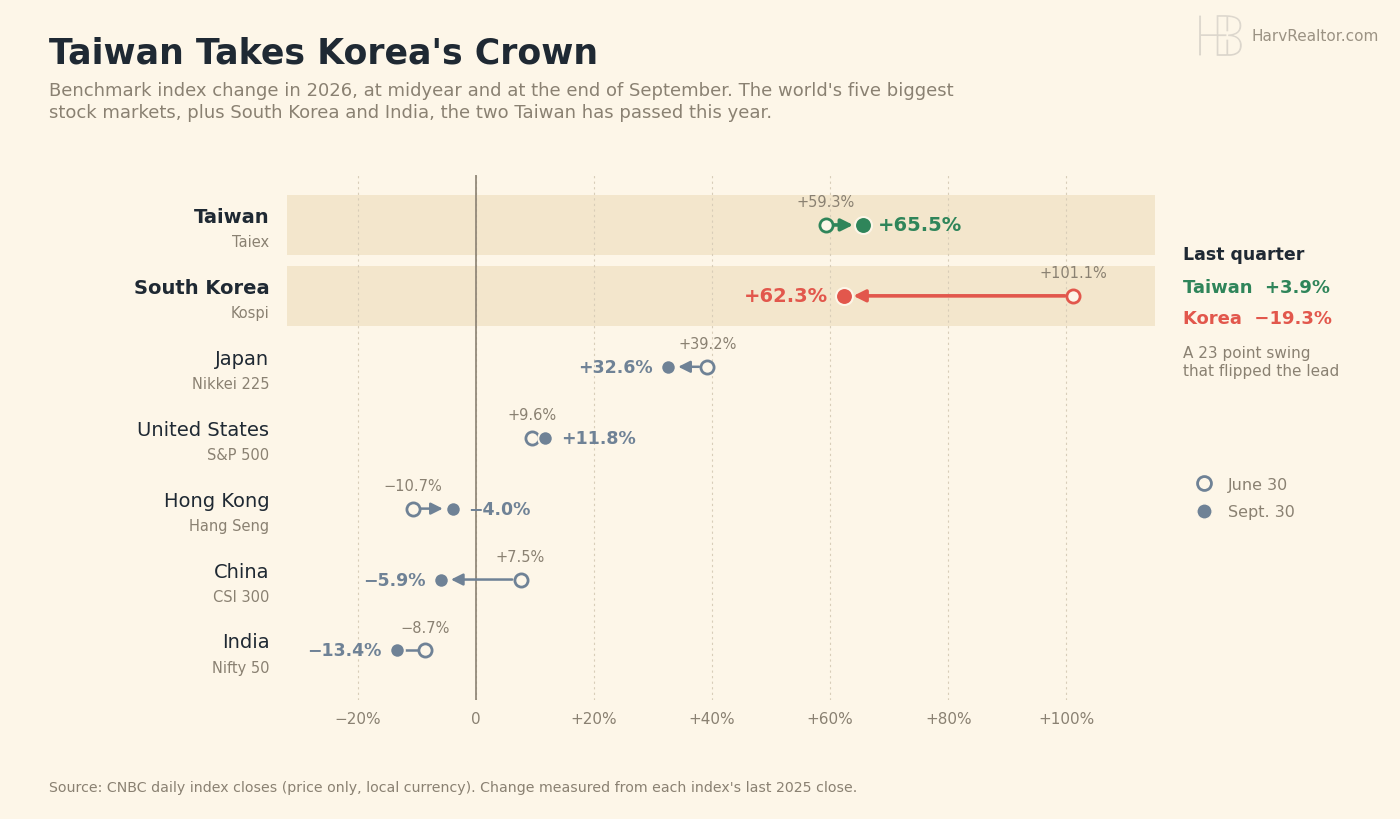
Taiwan takes the crown. Taiwan's market rose 3.9% last quarter while South Korea's fell 19.3%, putting Taiwan on top for 2026, up 65.5%. It is now the world's fifth biggest stock market, carried by TSMC, the chipmaker behind much of Silicon Valley's AI hardware.
10-Year Treasury: 5.27% -0.04 | Gold: $4,187.10 +0.73% | Silver: $61.59 +0.47% | Brent Crude: $100.58 +0.26%
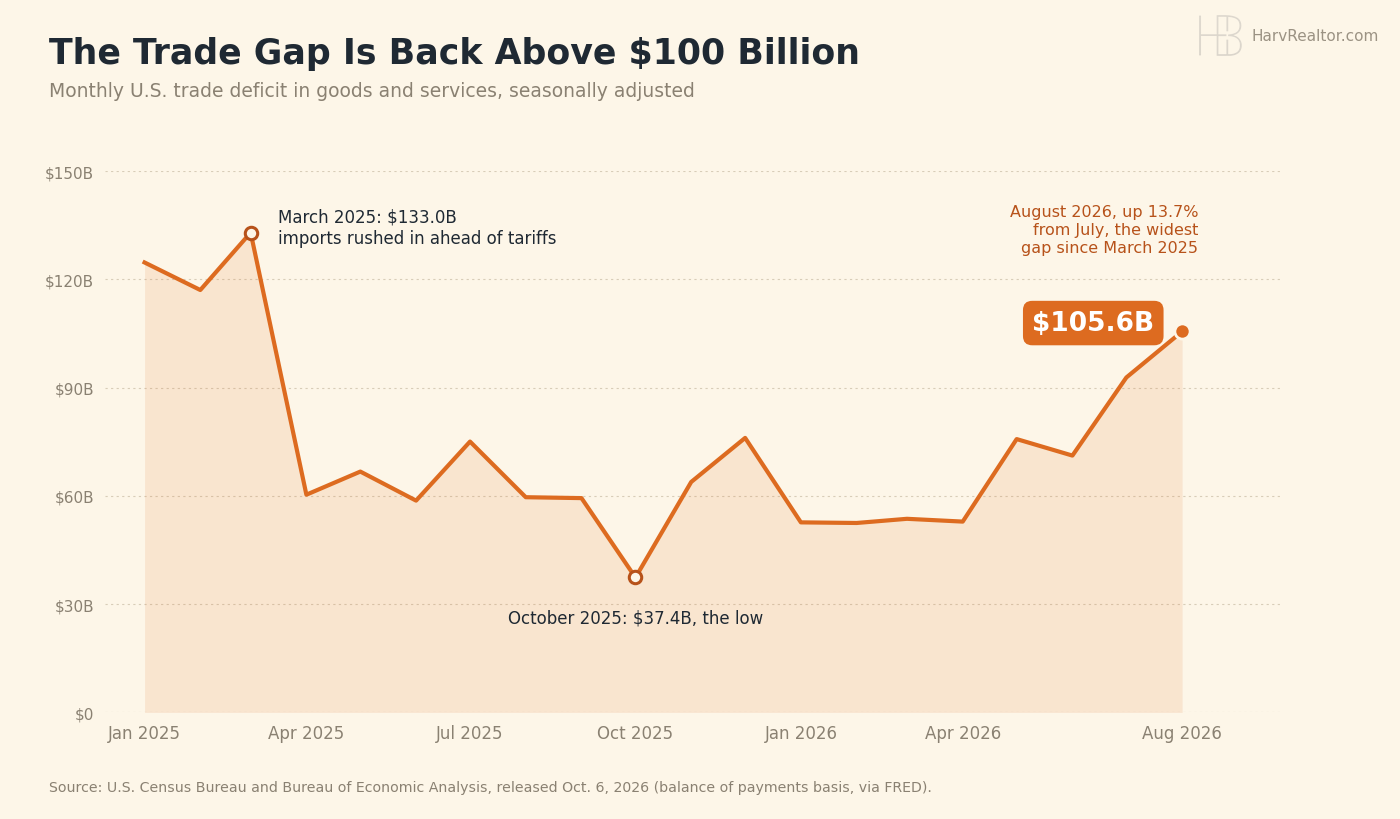
The trade gap is back above $100 billion. The deficit widened 13.7% in August to $105.6 billion, the widest since March 2025, as imports of crude oil, gold and semiconductors rose. For the year to date it is still 19.9% smaller than 2025's.
Chips in the numbers. Taiwan ran the third largest goods deficit with the U.S. in August, $18.3 billion, behind Mexico and Vietnam. Gold slid this morning to its lowest level since early August.
Bitcoin: $82,910 -4.21% | Ethereum: $2,561.40 -5.86% | XRP: $1.43 -6.28%
A rough morning. Bitcoin is down 4.21% over 24 hours near $82,900, Ether down 5.86% and XRP down 6.28%, live from CoinGecko at 7:58 AM PT. The selling arrived with this morning's jump in Treasury yields and puts Bitcoin back near the bottom of the $82,500 to $87,000 range it has held for ten days. Range trading is only calm until it is not.
Sources
- Mortgage News Daily (30 and 15 year fixed, October 6 reading)
- Mortgage News Daily (Mortgage Rate Watch, October 6, 2026)
- U.S. Treasury (10-Year daily yield curve, October 6)
- CNBC (market close, October 6)
- CNBC (live updates, October 7)
- Office of the New York State Comptroller (The Securities Industry in New York City, October 2026)
- Office of the New York State Comptroller (2020 to 2023 profits, October 2024)
- Bloomberg News via BusinessMirror (Taiwan overtakes India, May 26, 2026)
- U.S. Census Bureau and BEA (U.S. International Trade in Goods and Services, August 2026)
- CNBC quotes (index closes, COMEX and ICE settlements, live quotes)
- CoinGecko (live crypto, 7:58 AM PT October 7)
- REALTY EXPERTS® Live Inventory (five city ledger, October 7)
Disclaimer: The market data, rates, and information provided are for informational purposes only and should not be considered financial advice. Always verify rates and data with your lender or financial advisor before making any decisions.
Based on information from the Bay East Association of REALTORS® (Bay East MLS) as of October 7, 2026. All data, including all measurements and calculations of area, is obtained from various sources and has not been, and will not be, verified by broker or MLS. All information should be independently reviewed and verified for accuracy. Properties may or may not be listed by the office/agent presenting the information.