



"At a Glance" Local Housing STATS and News 09/30/26
September 30, 2026 · Alameda County Market Dashboard
TODAY'S LIVE INVENTORY
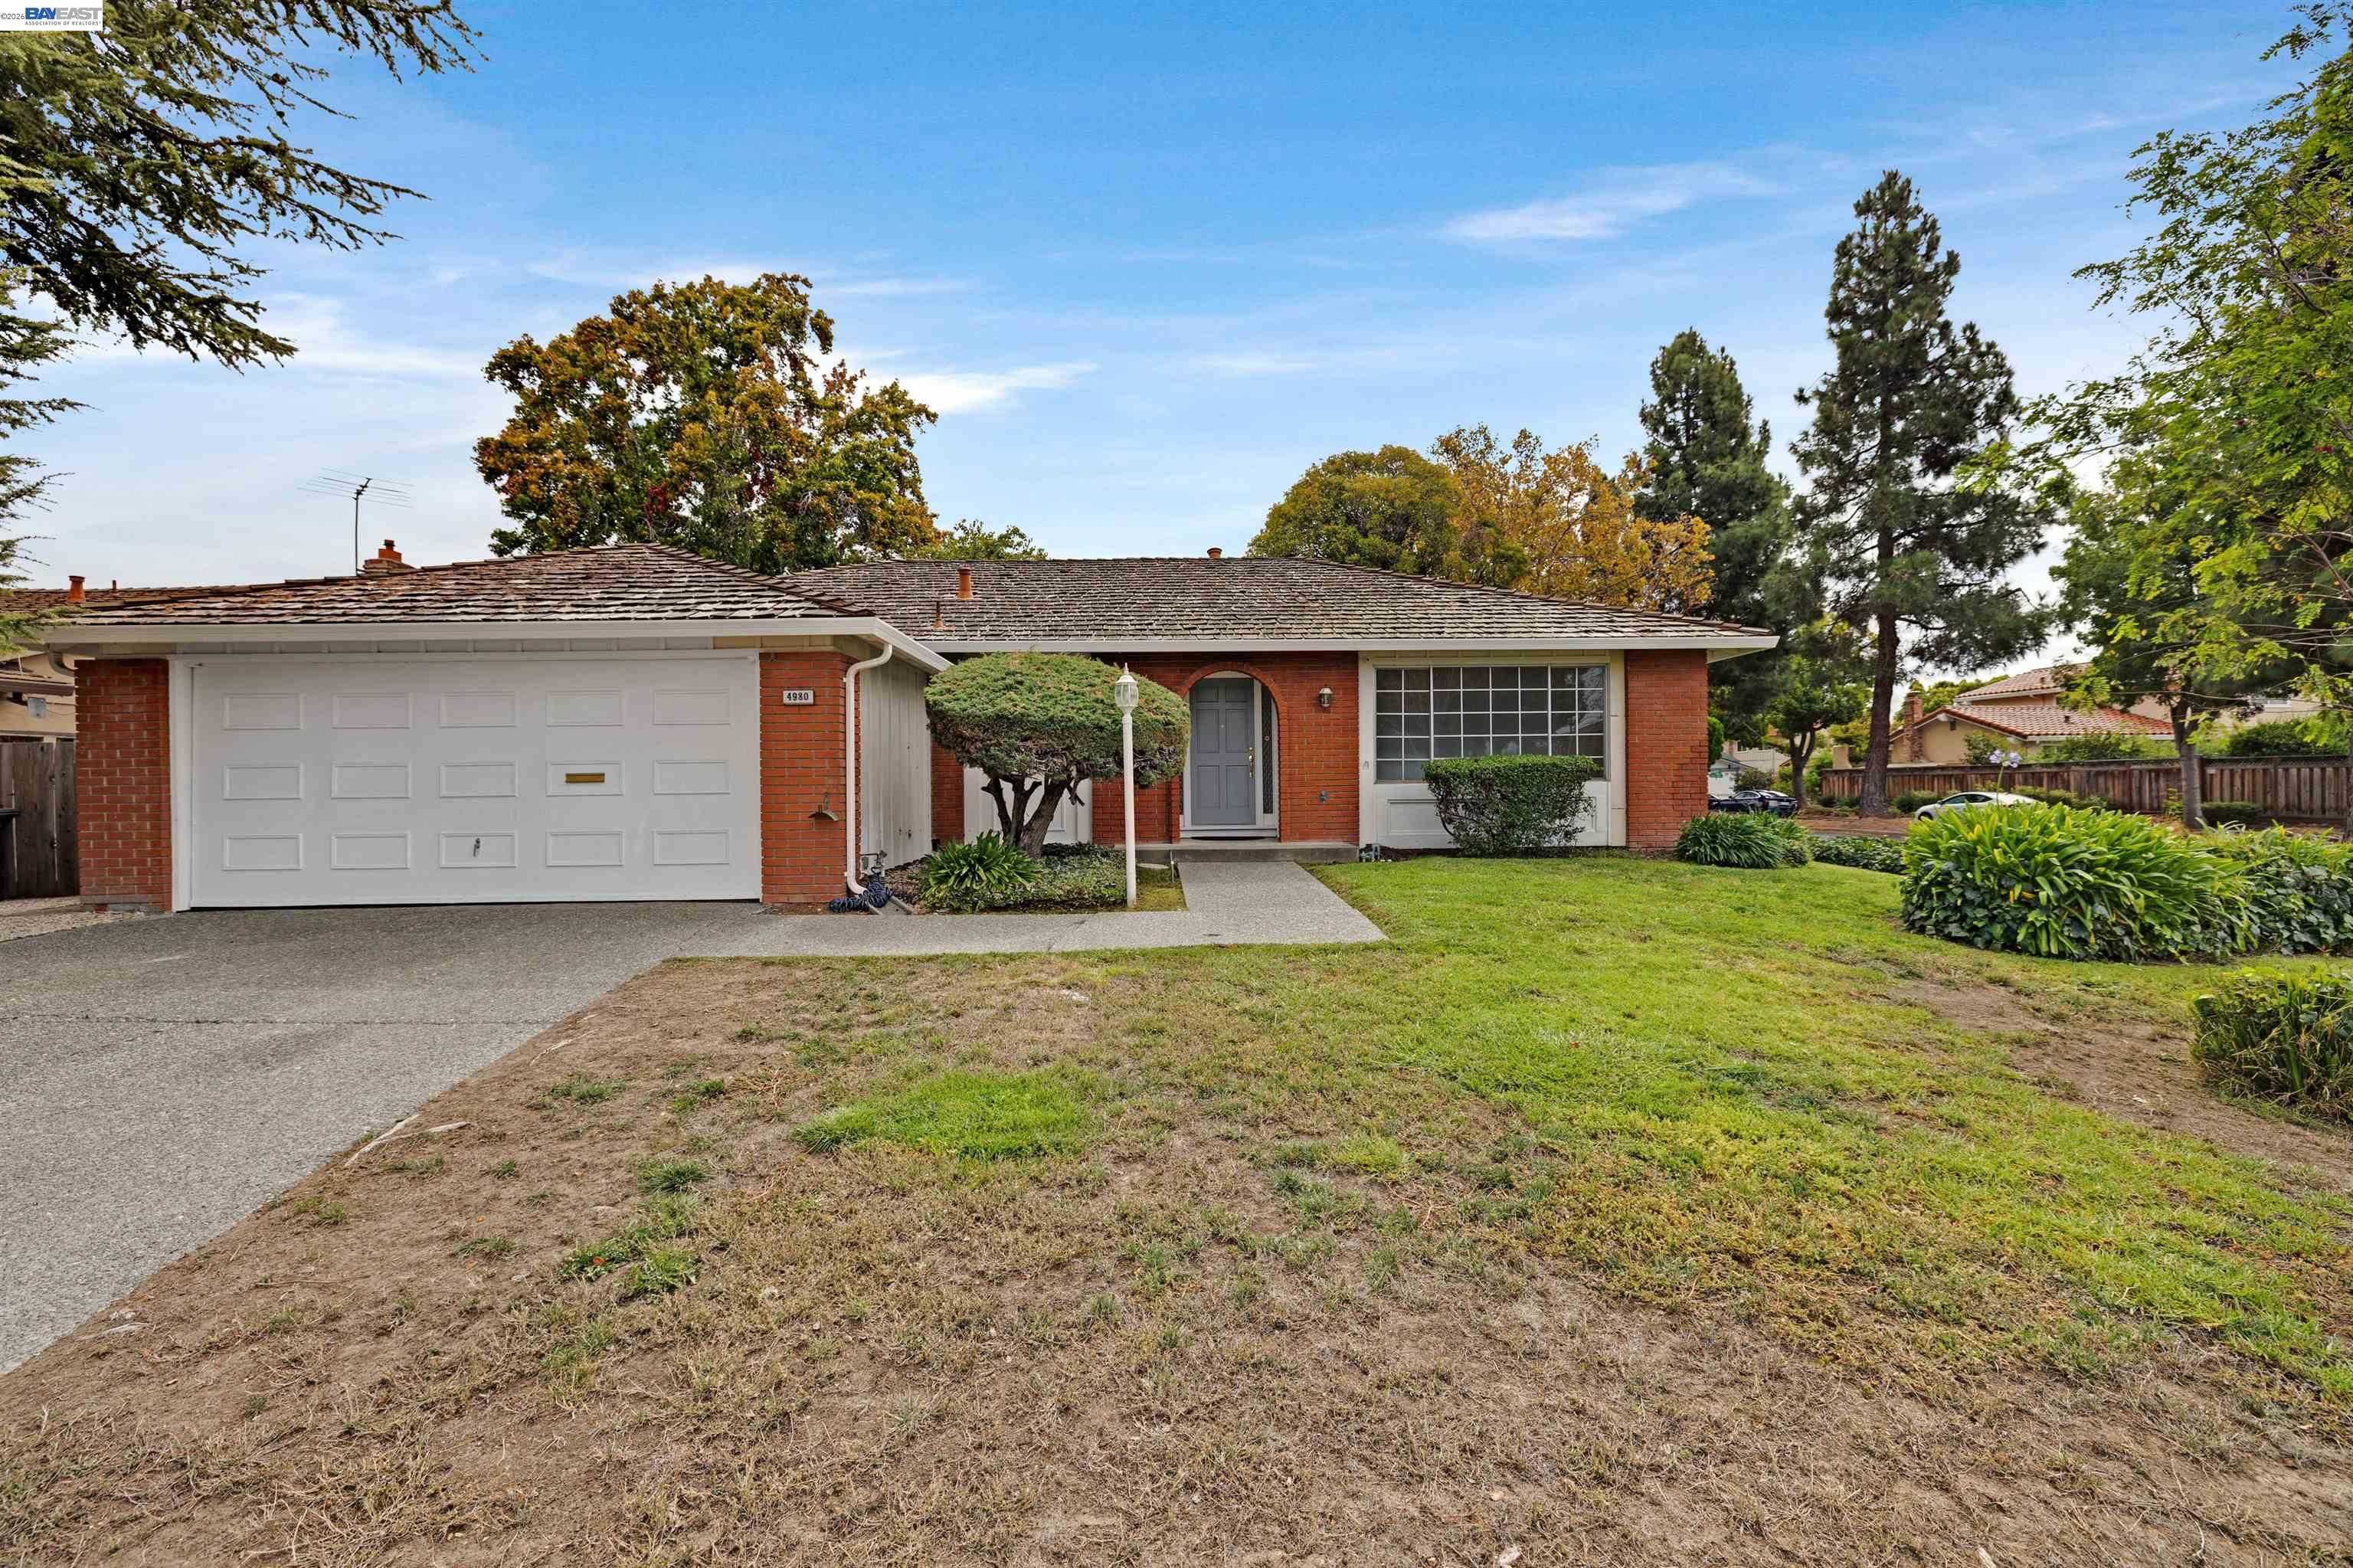
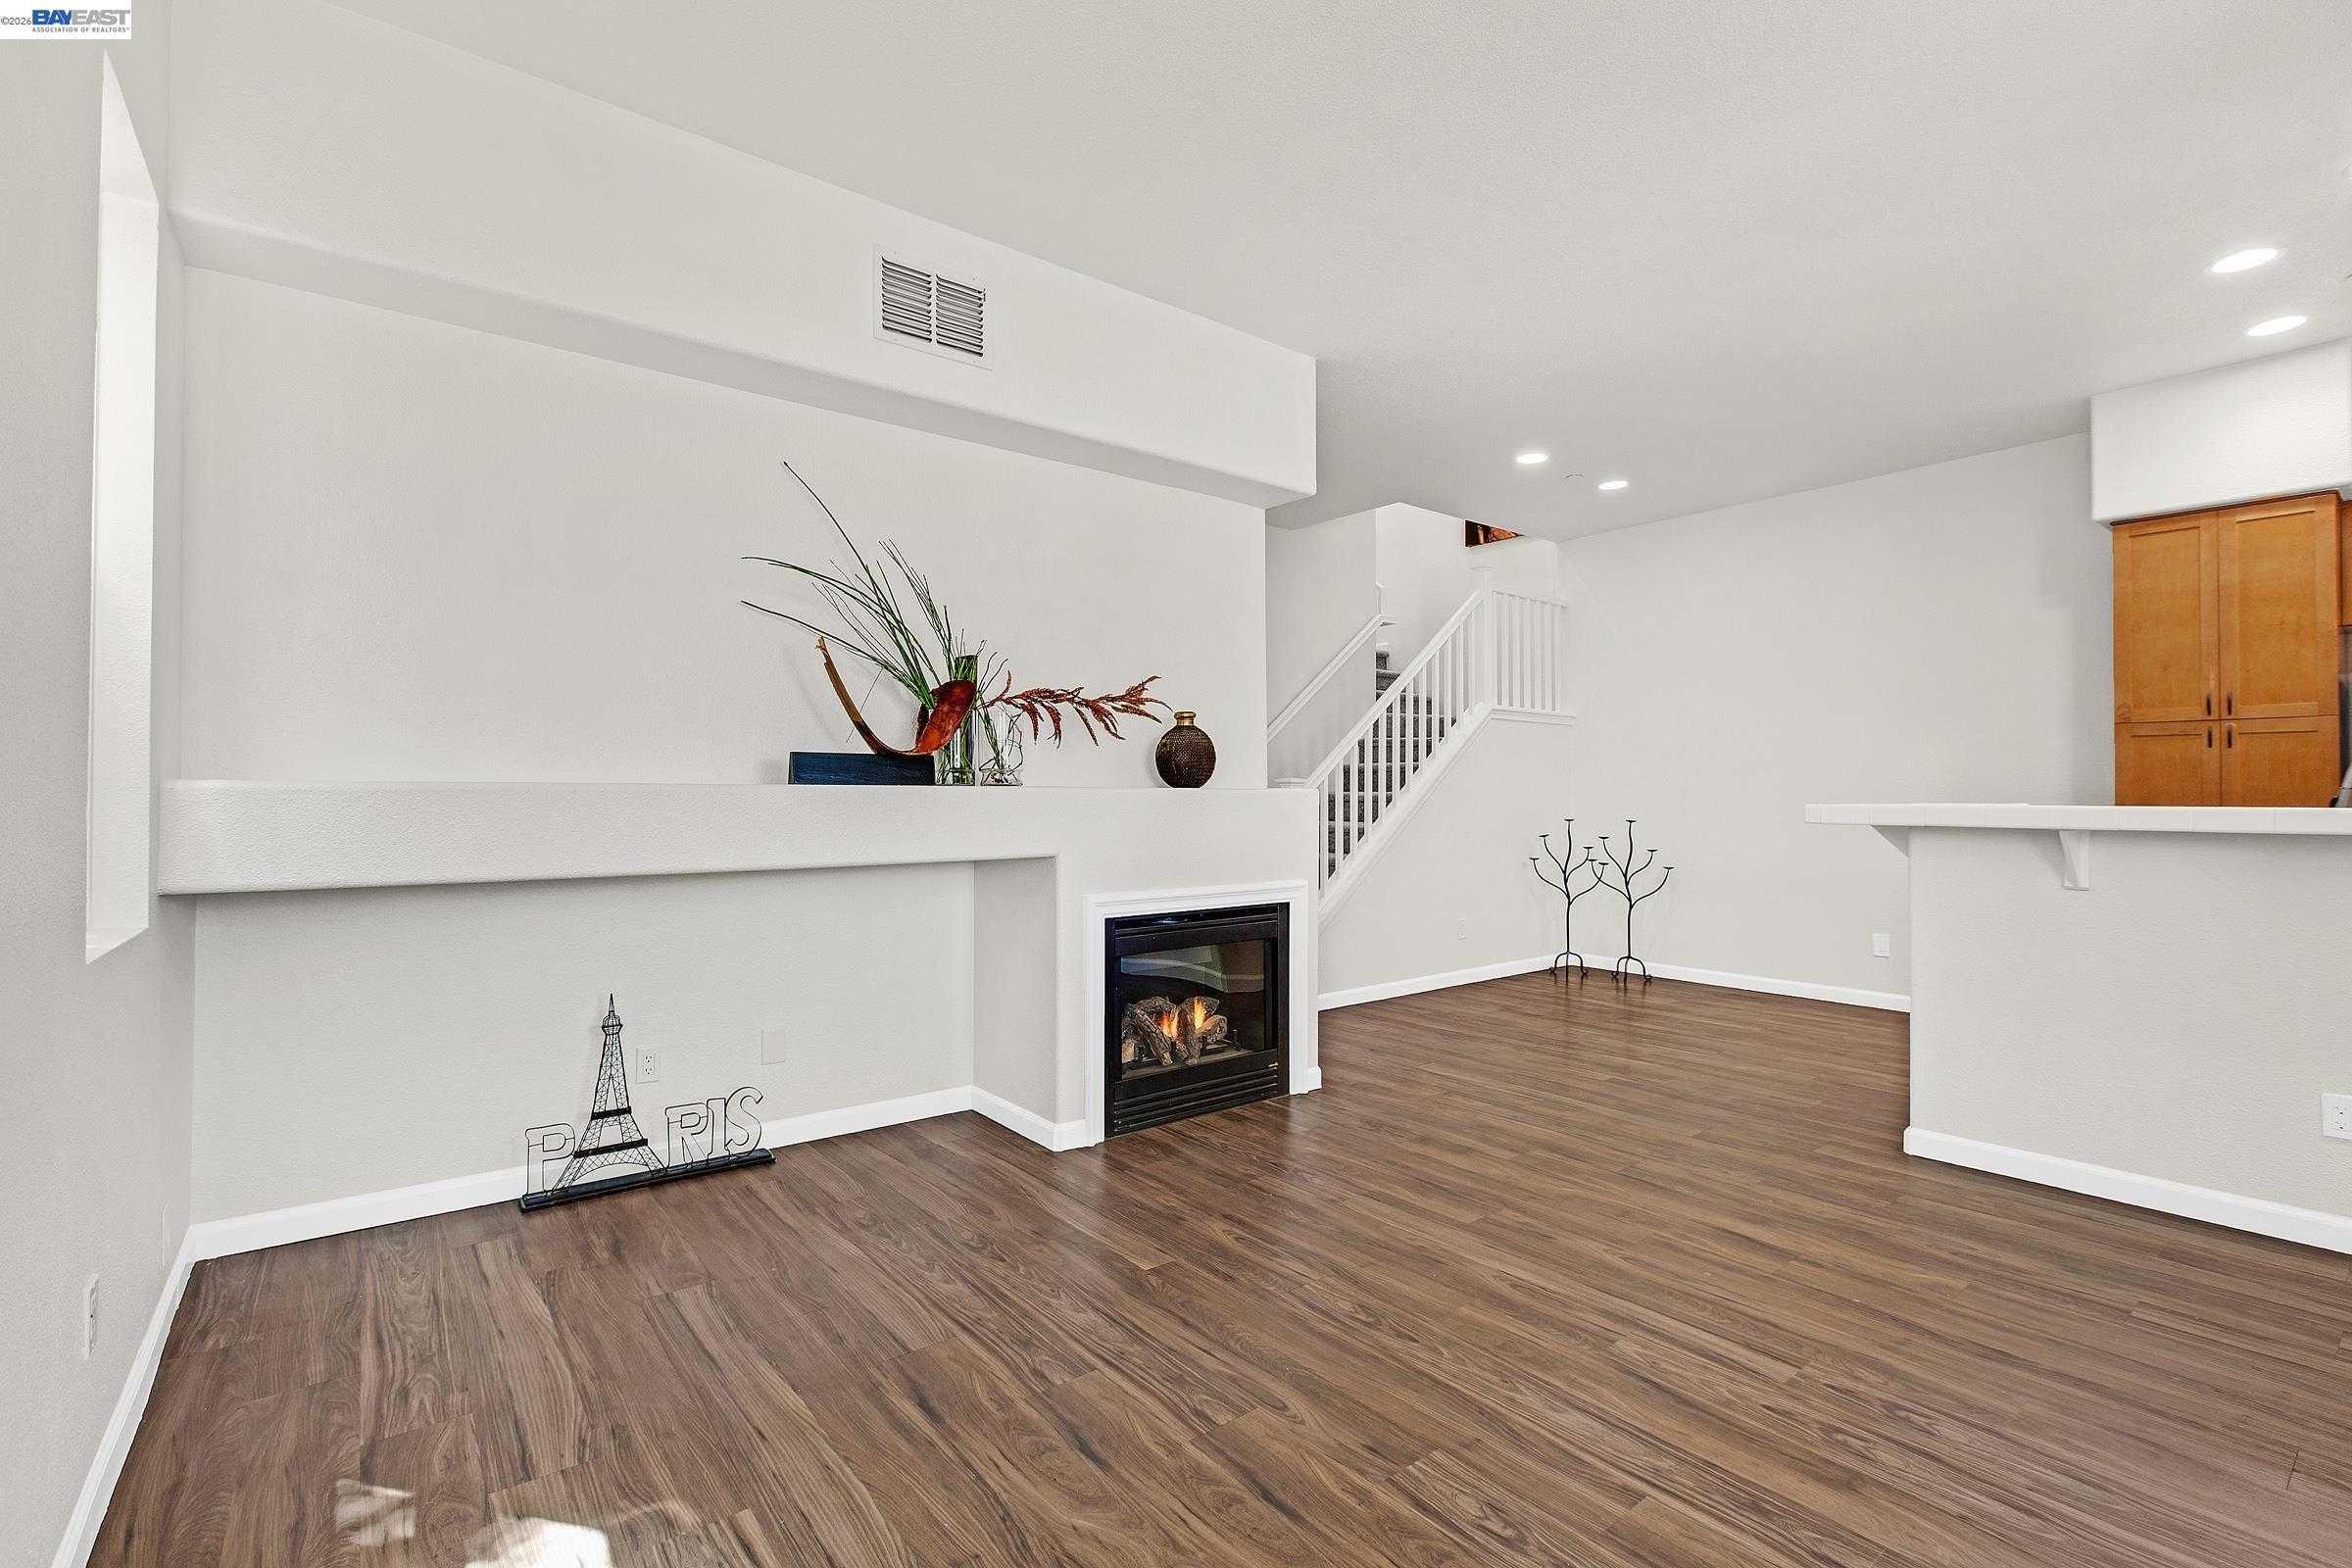
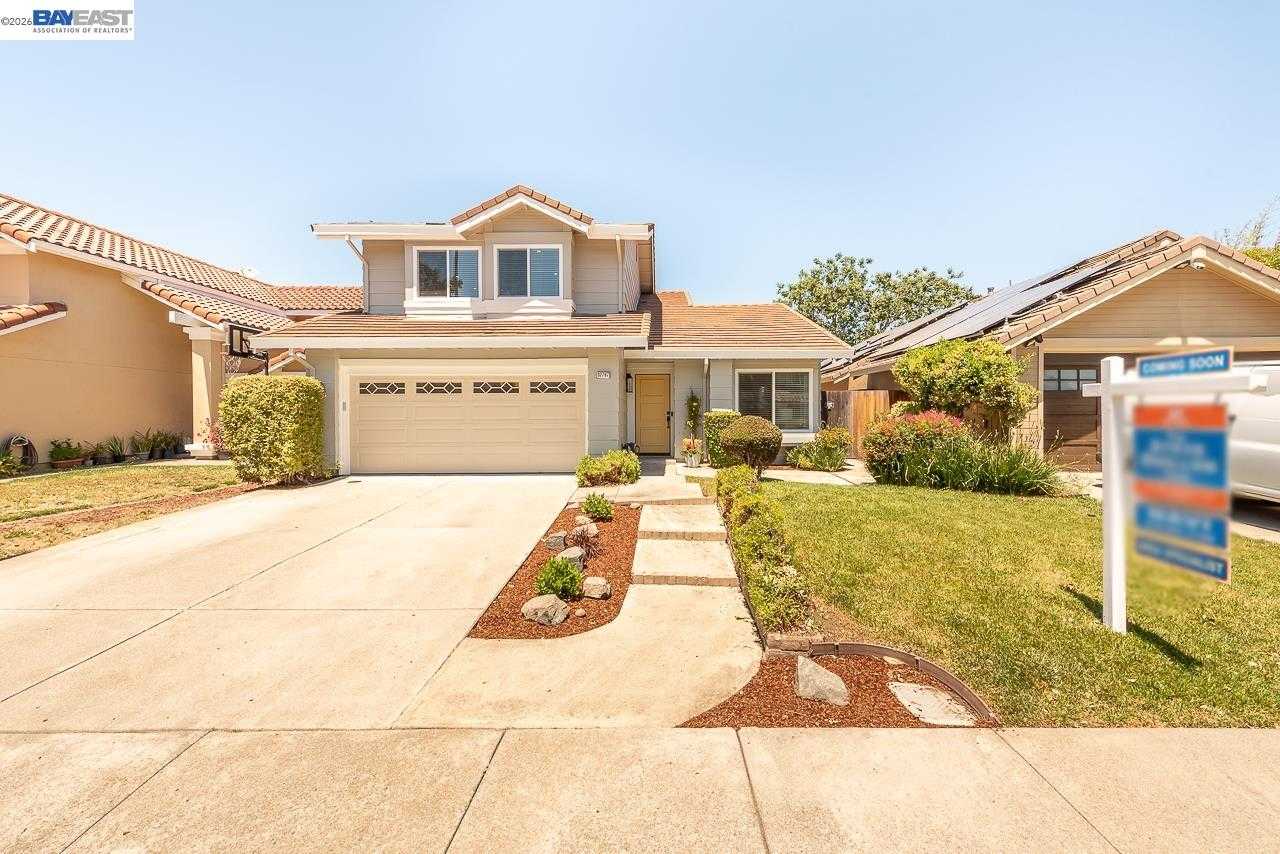
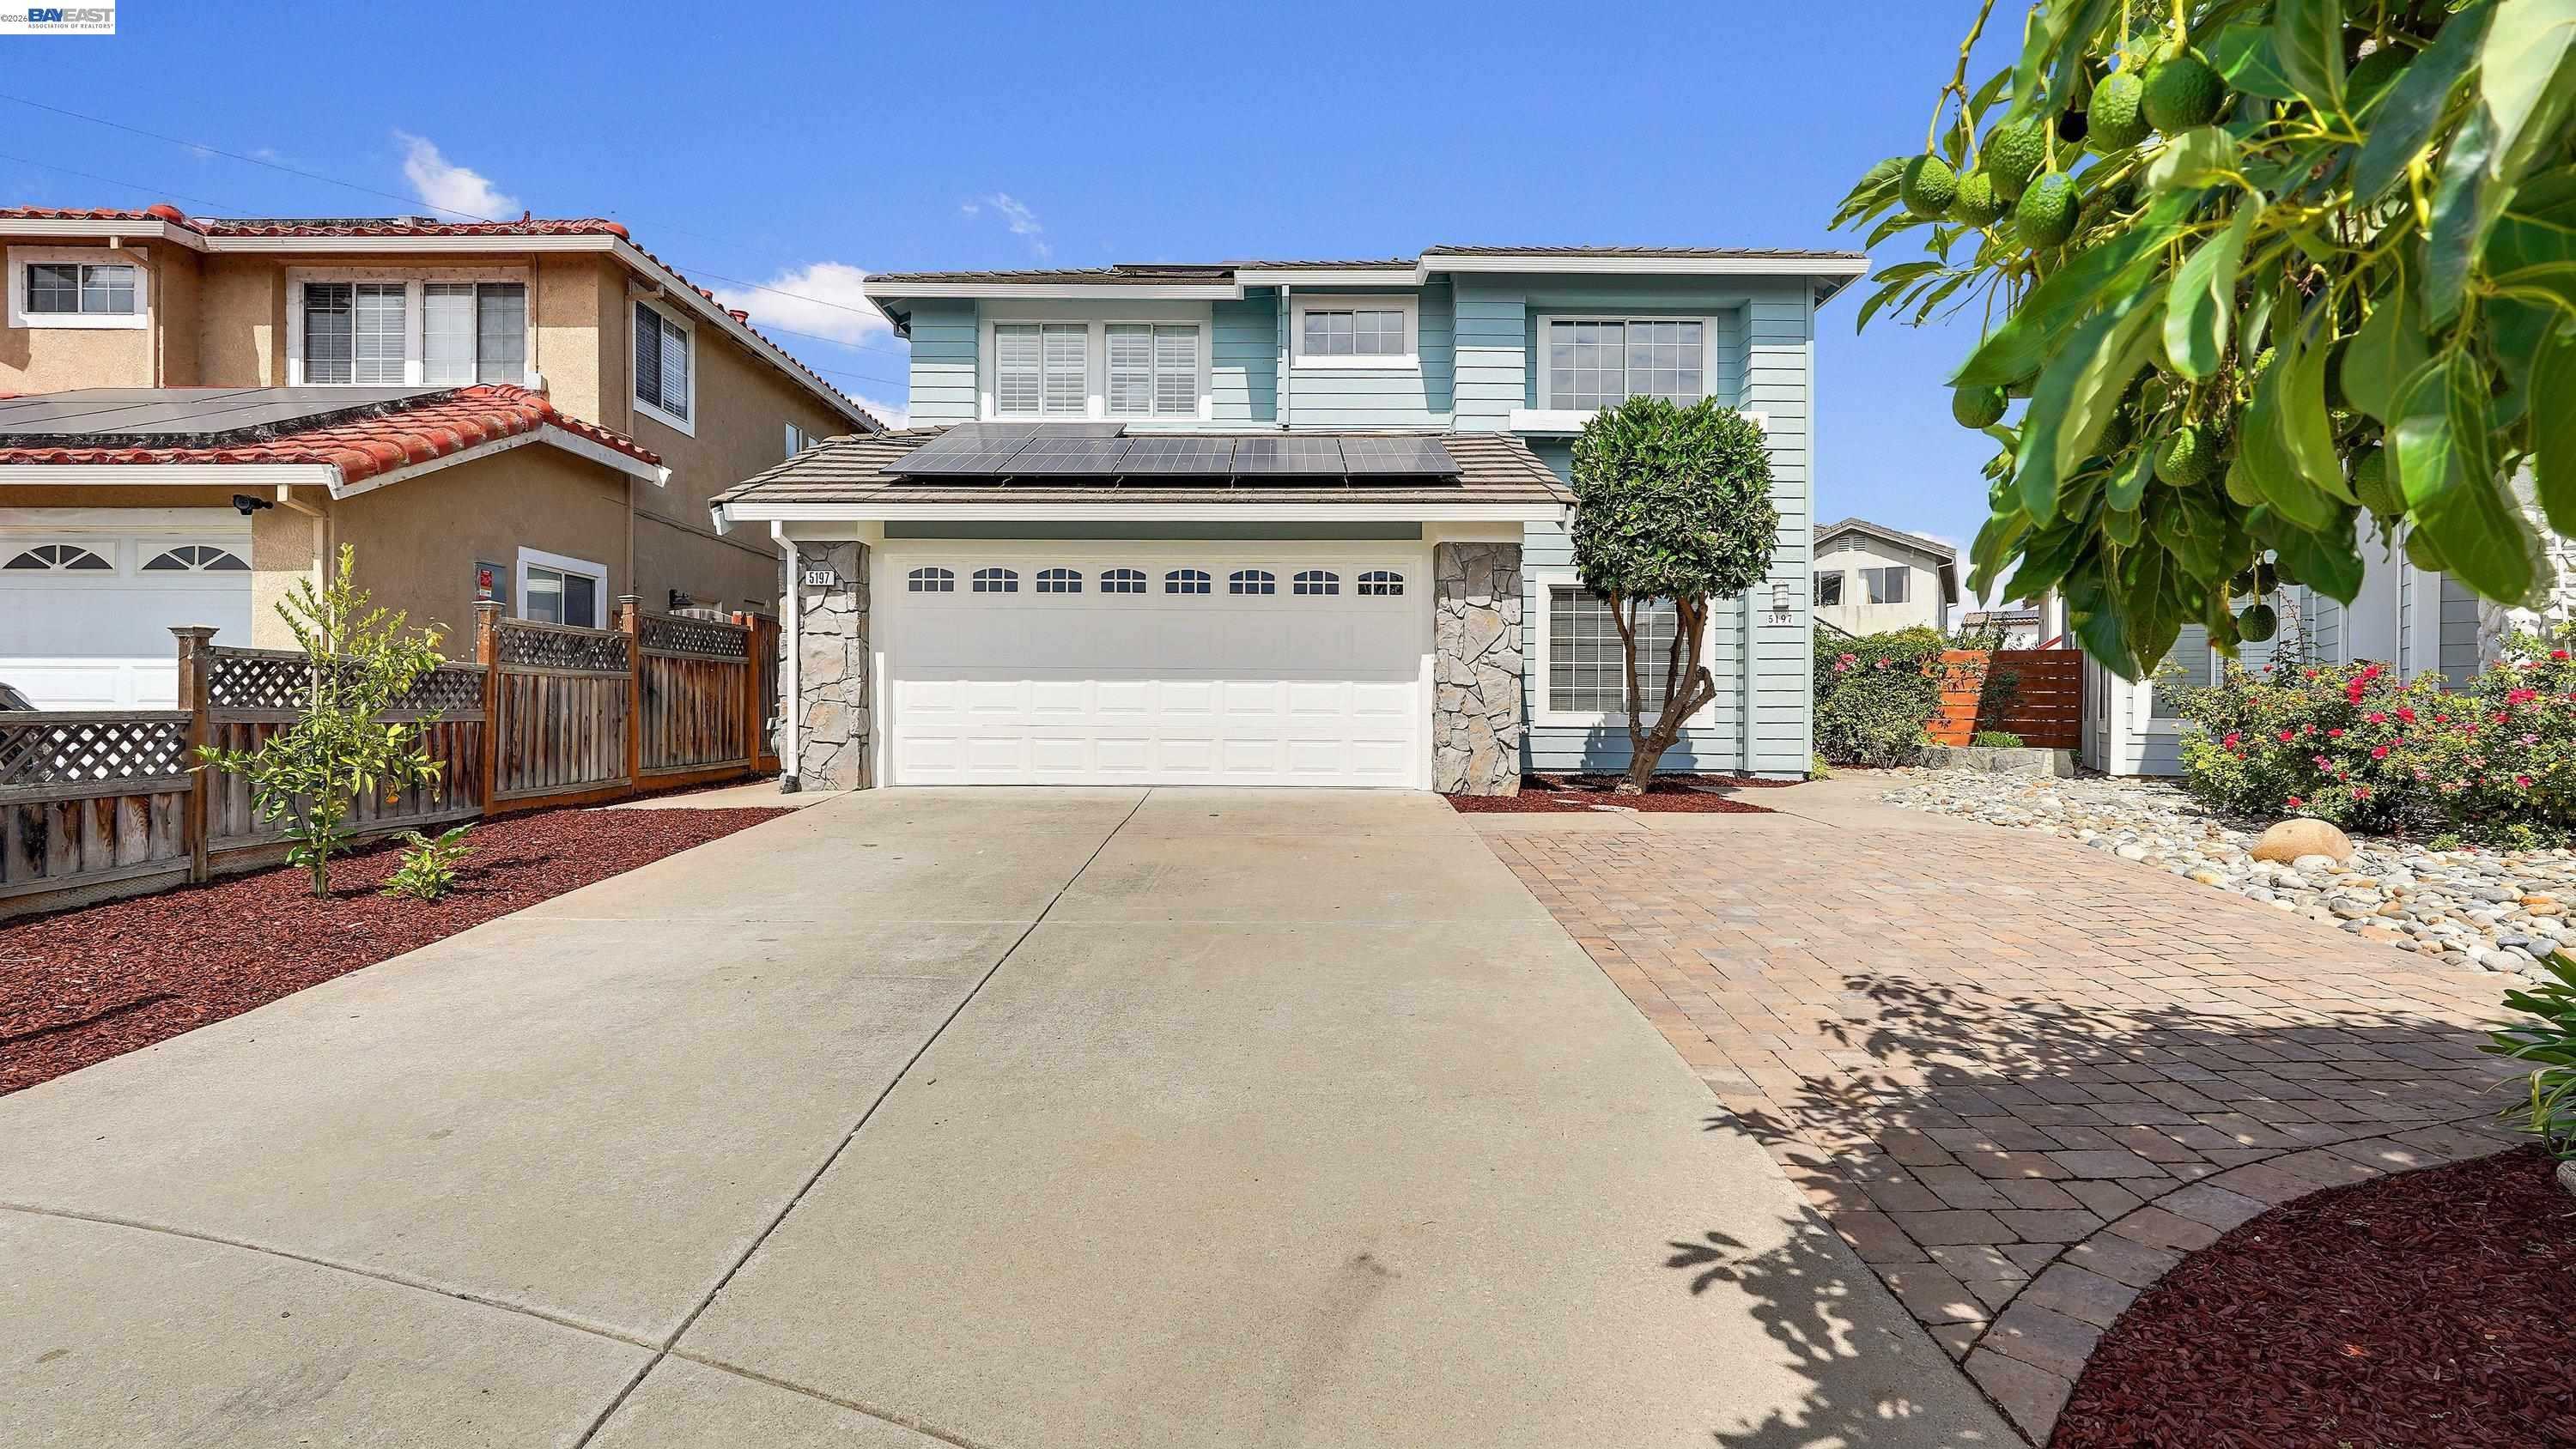
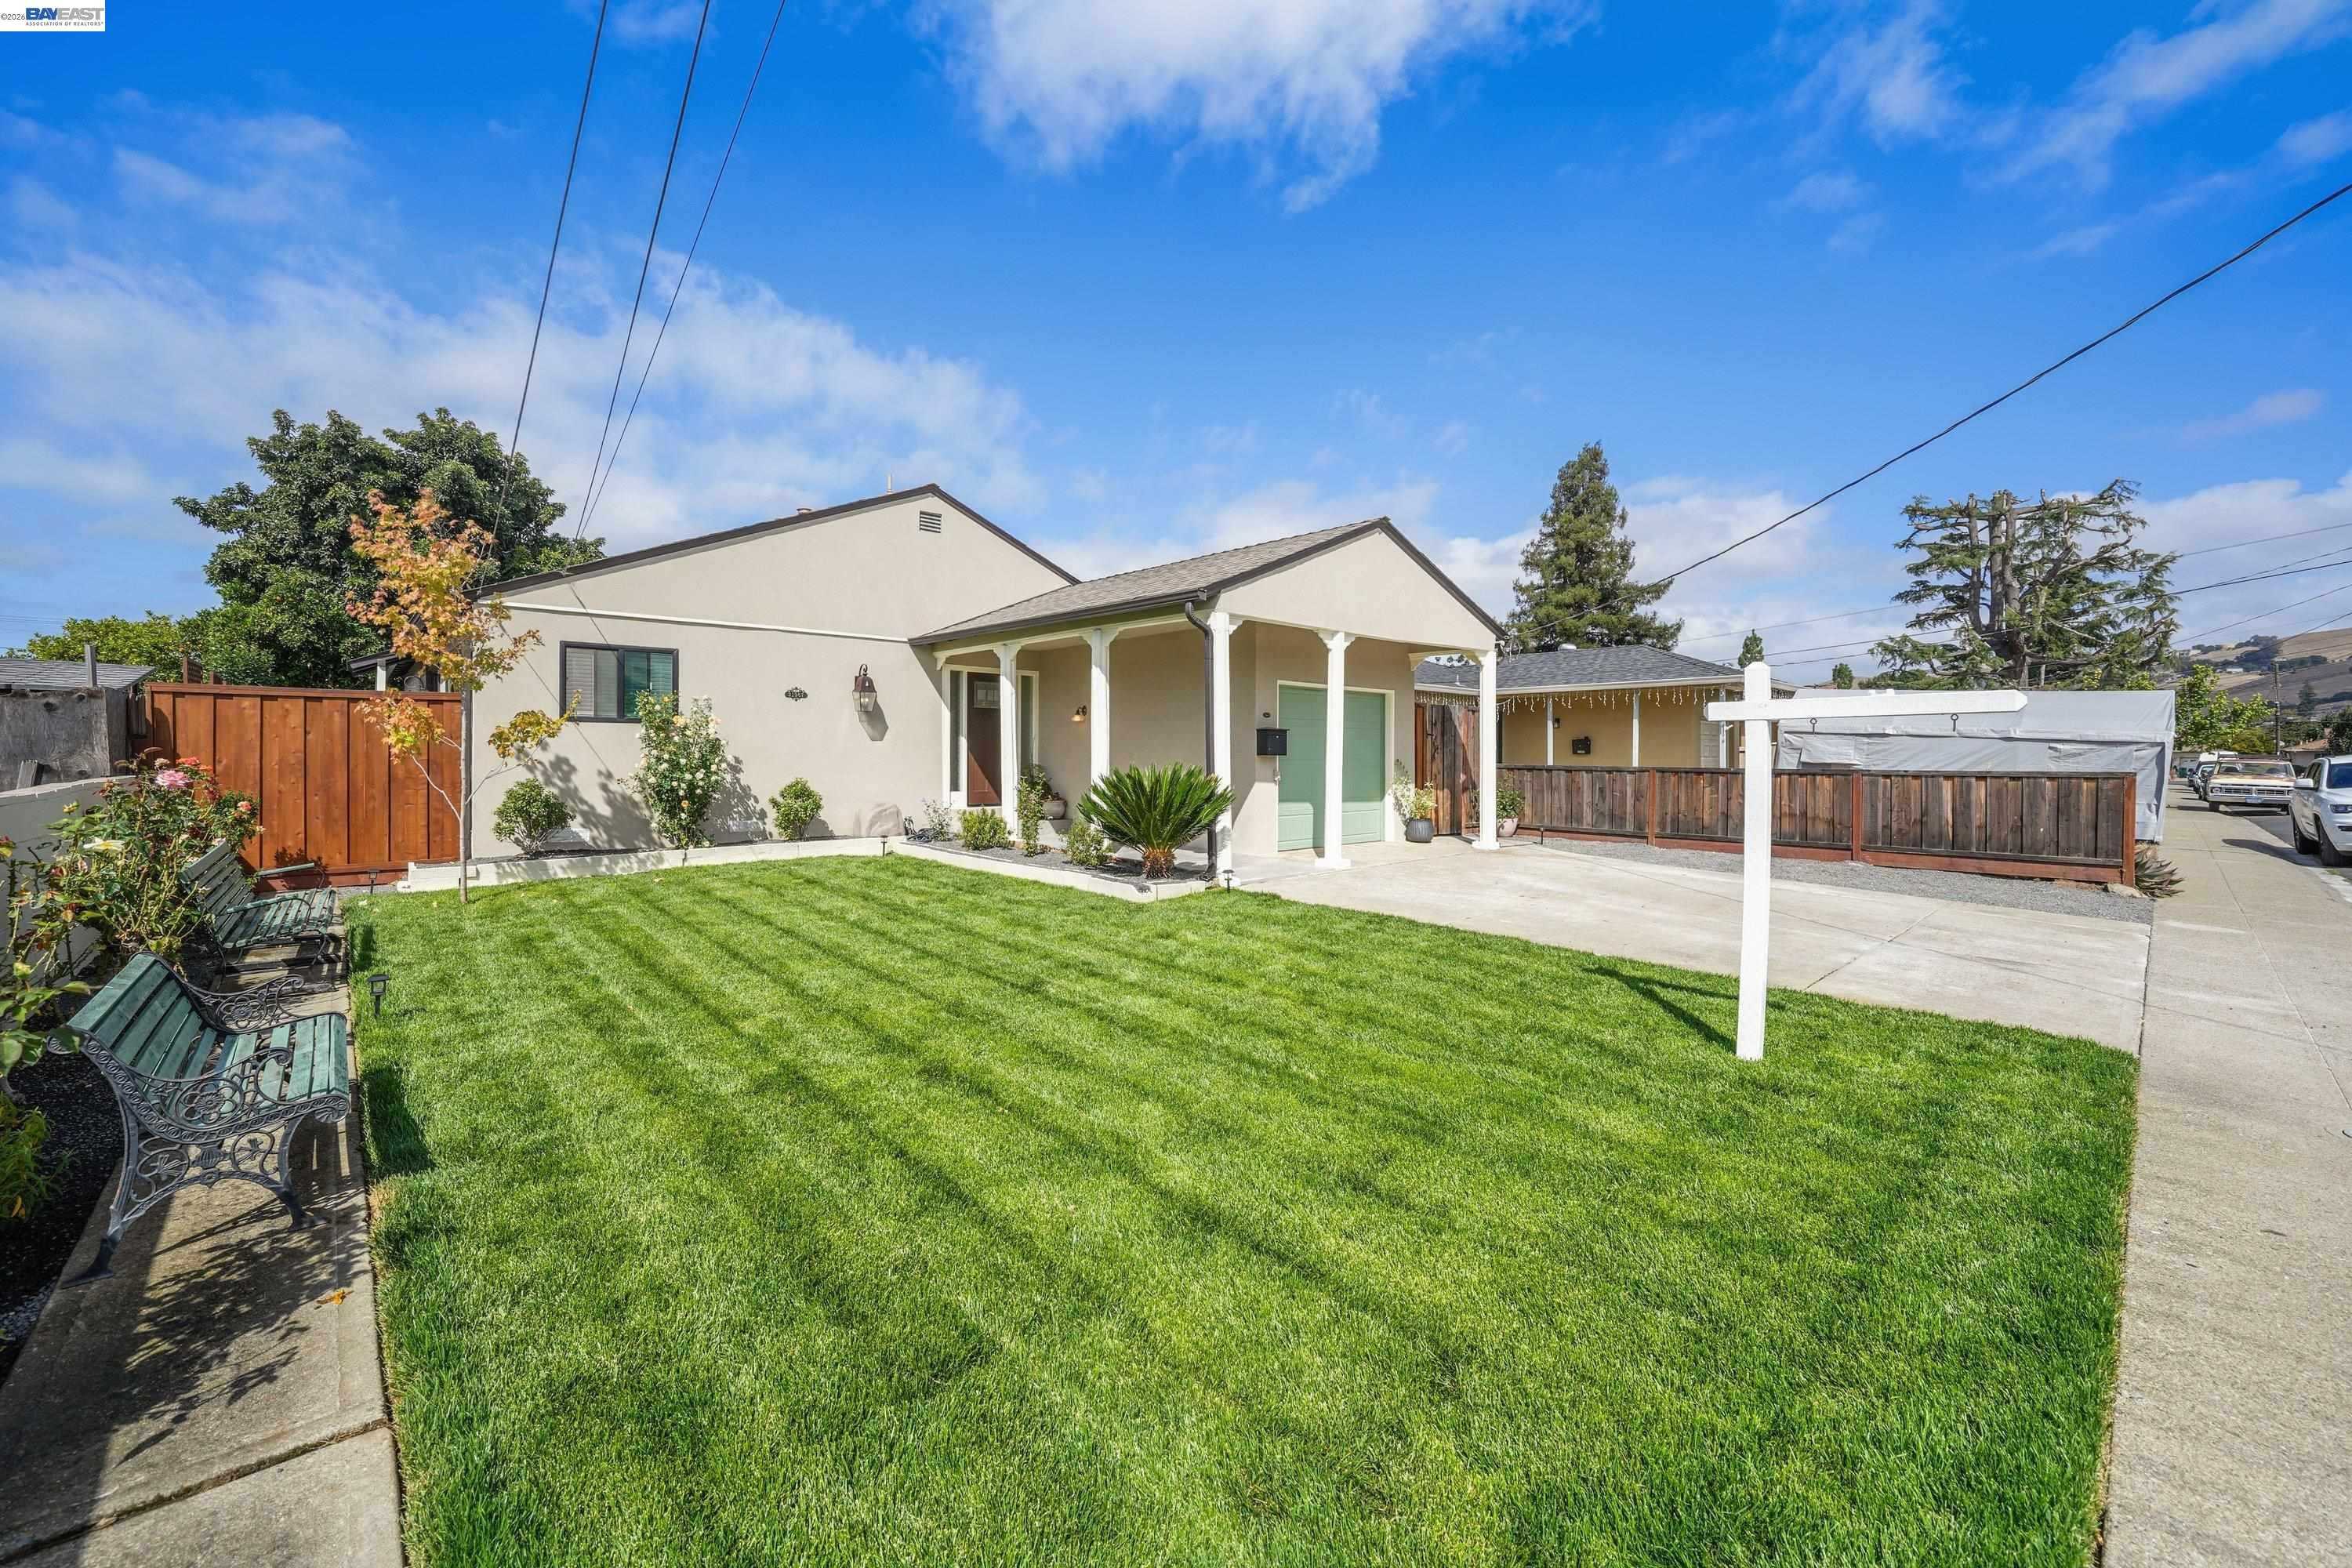
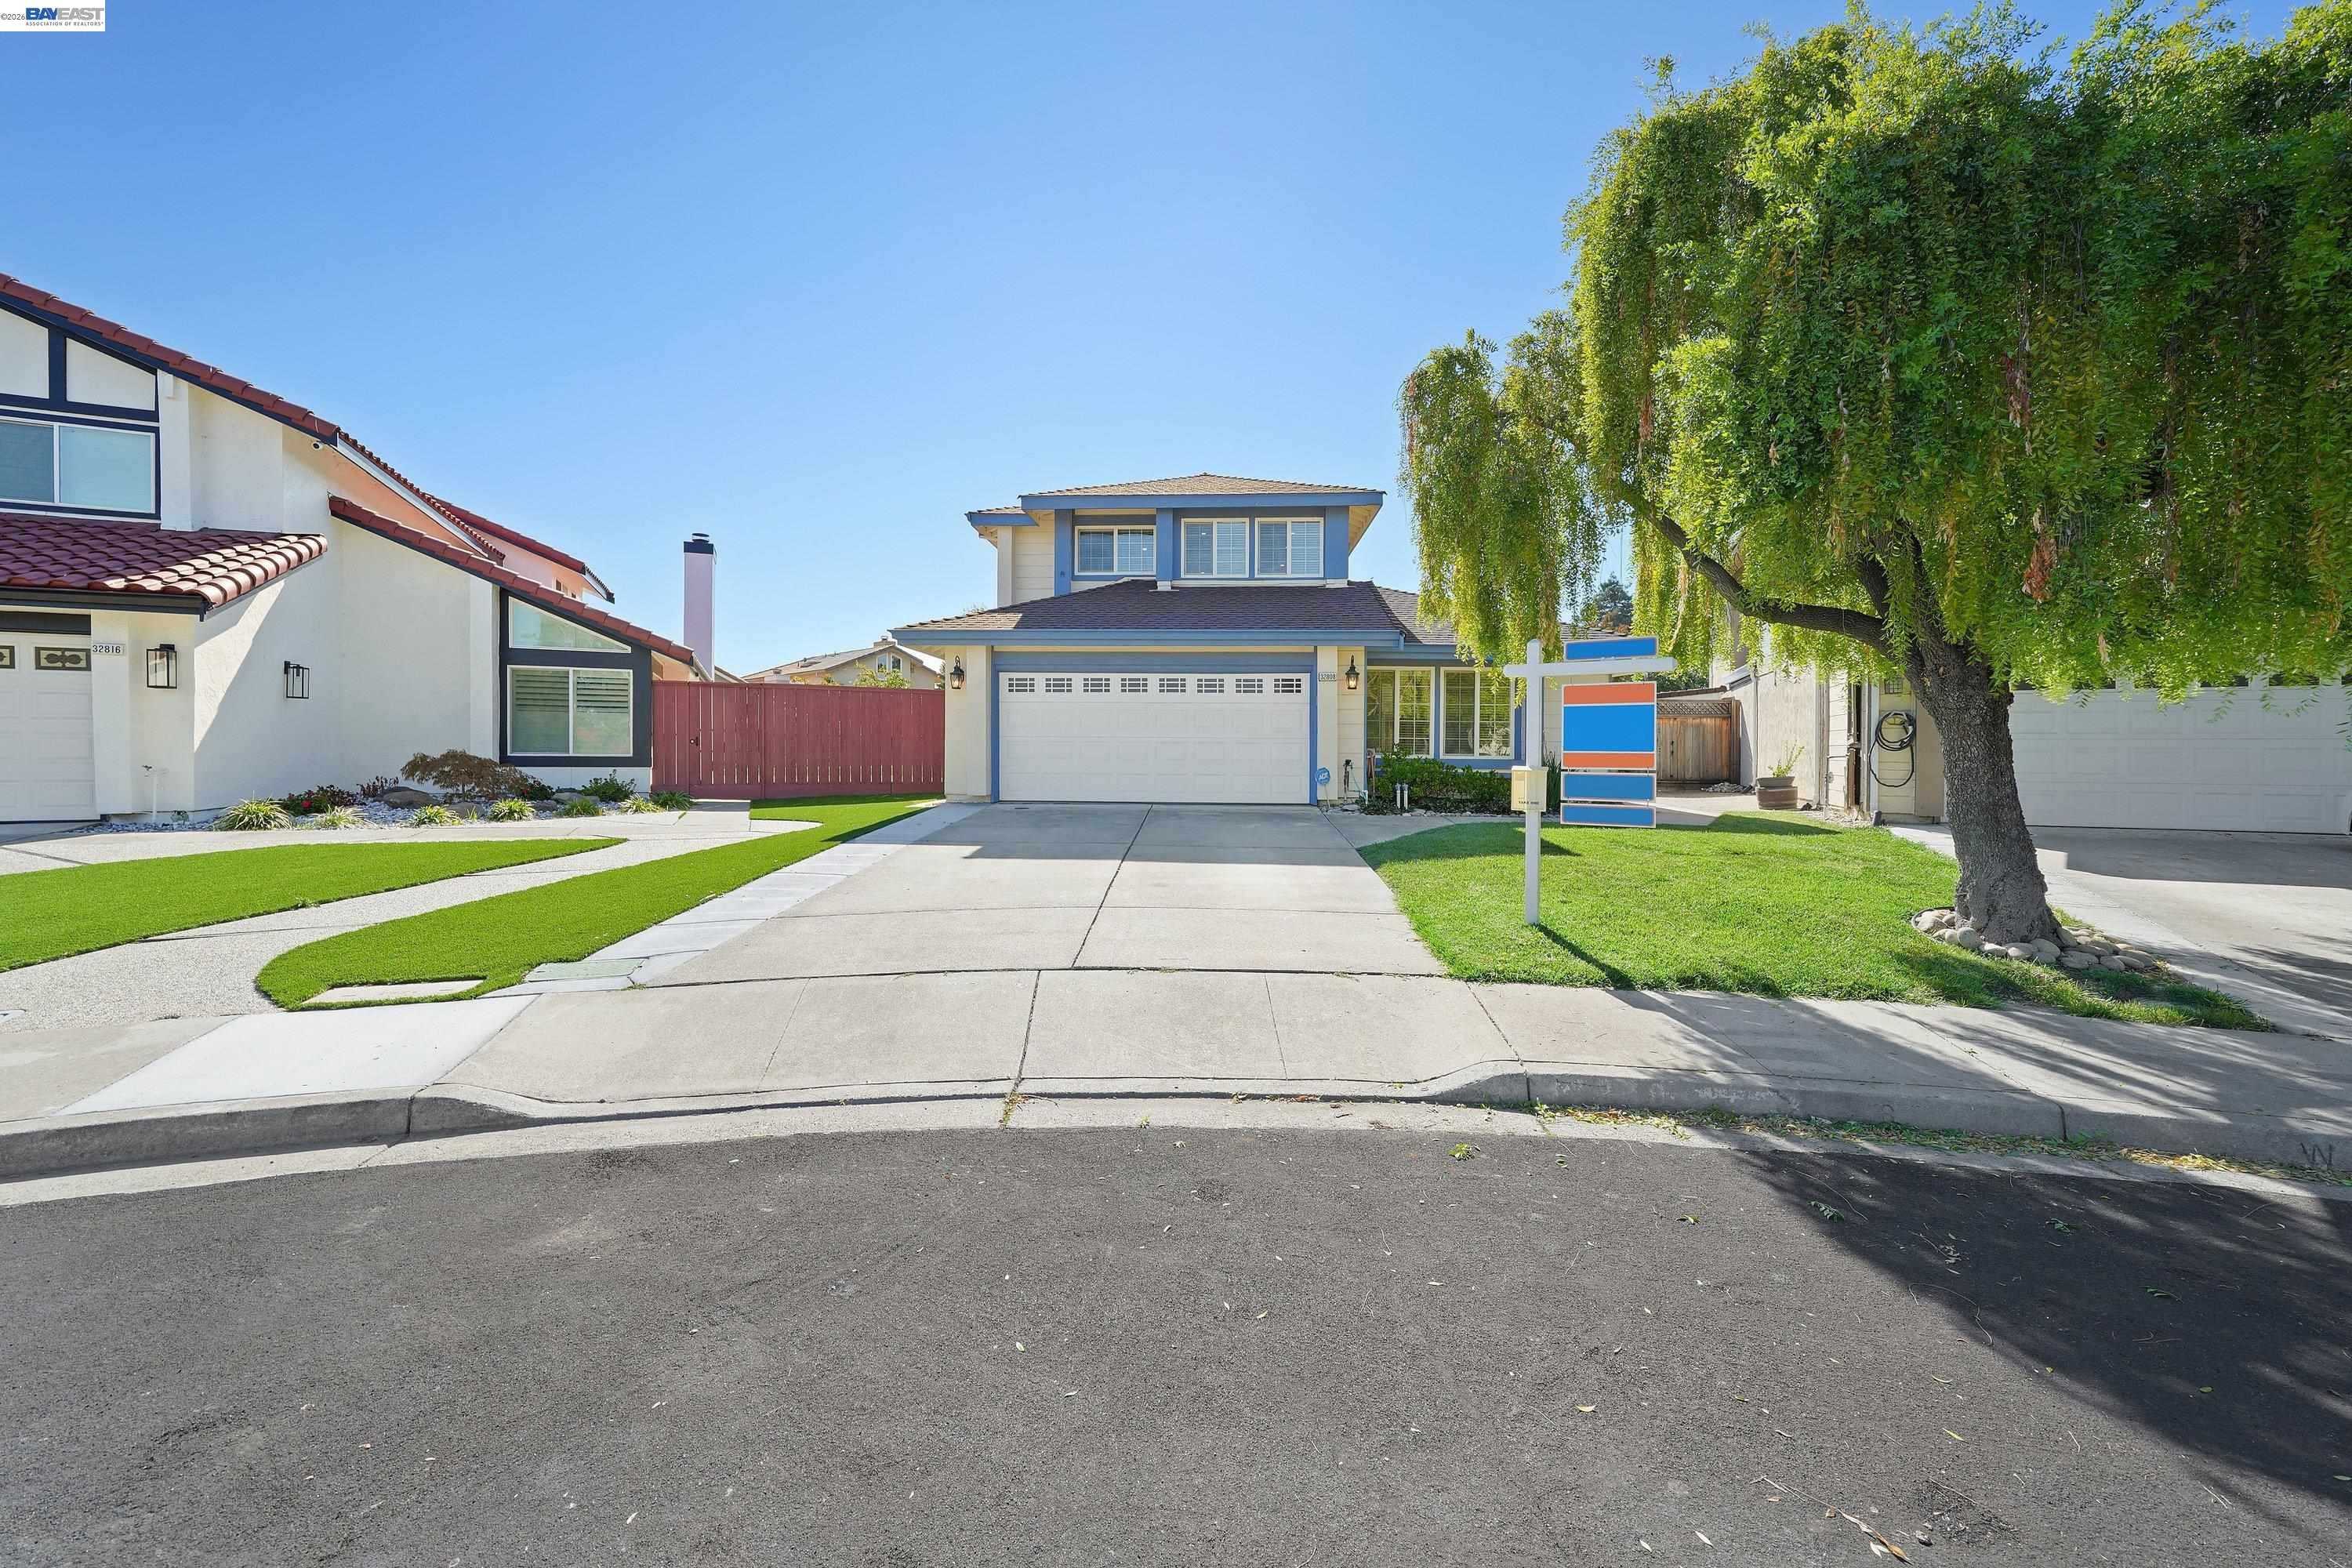
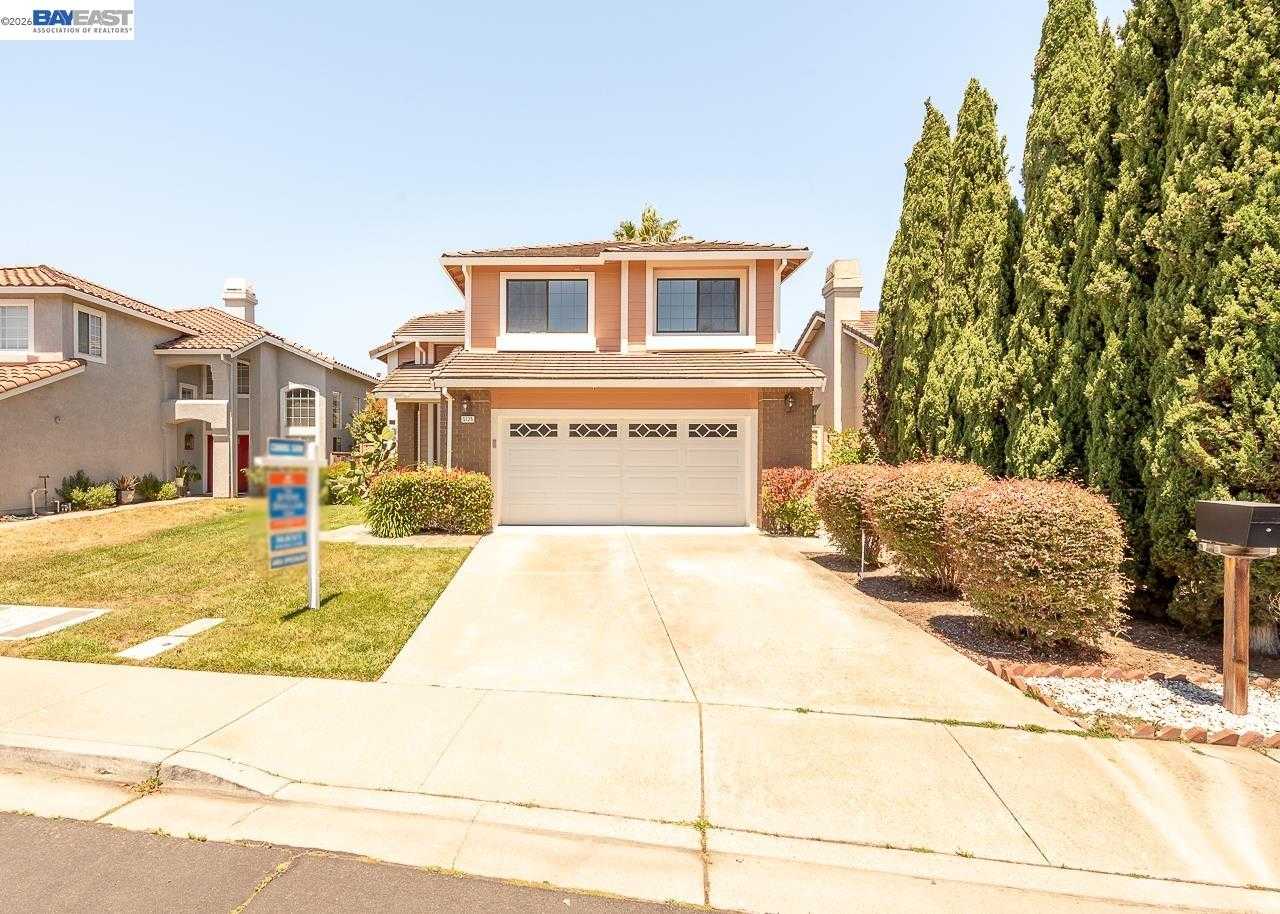
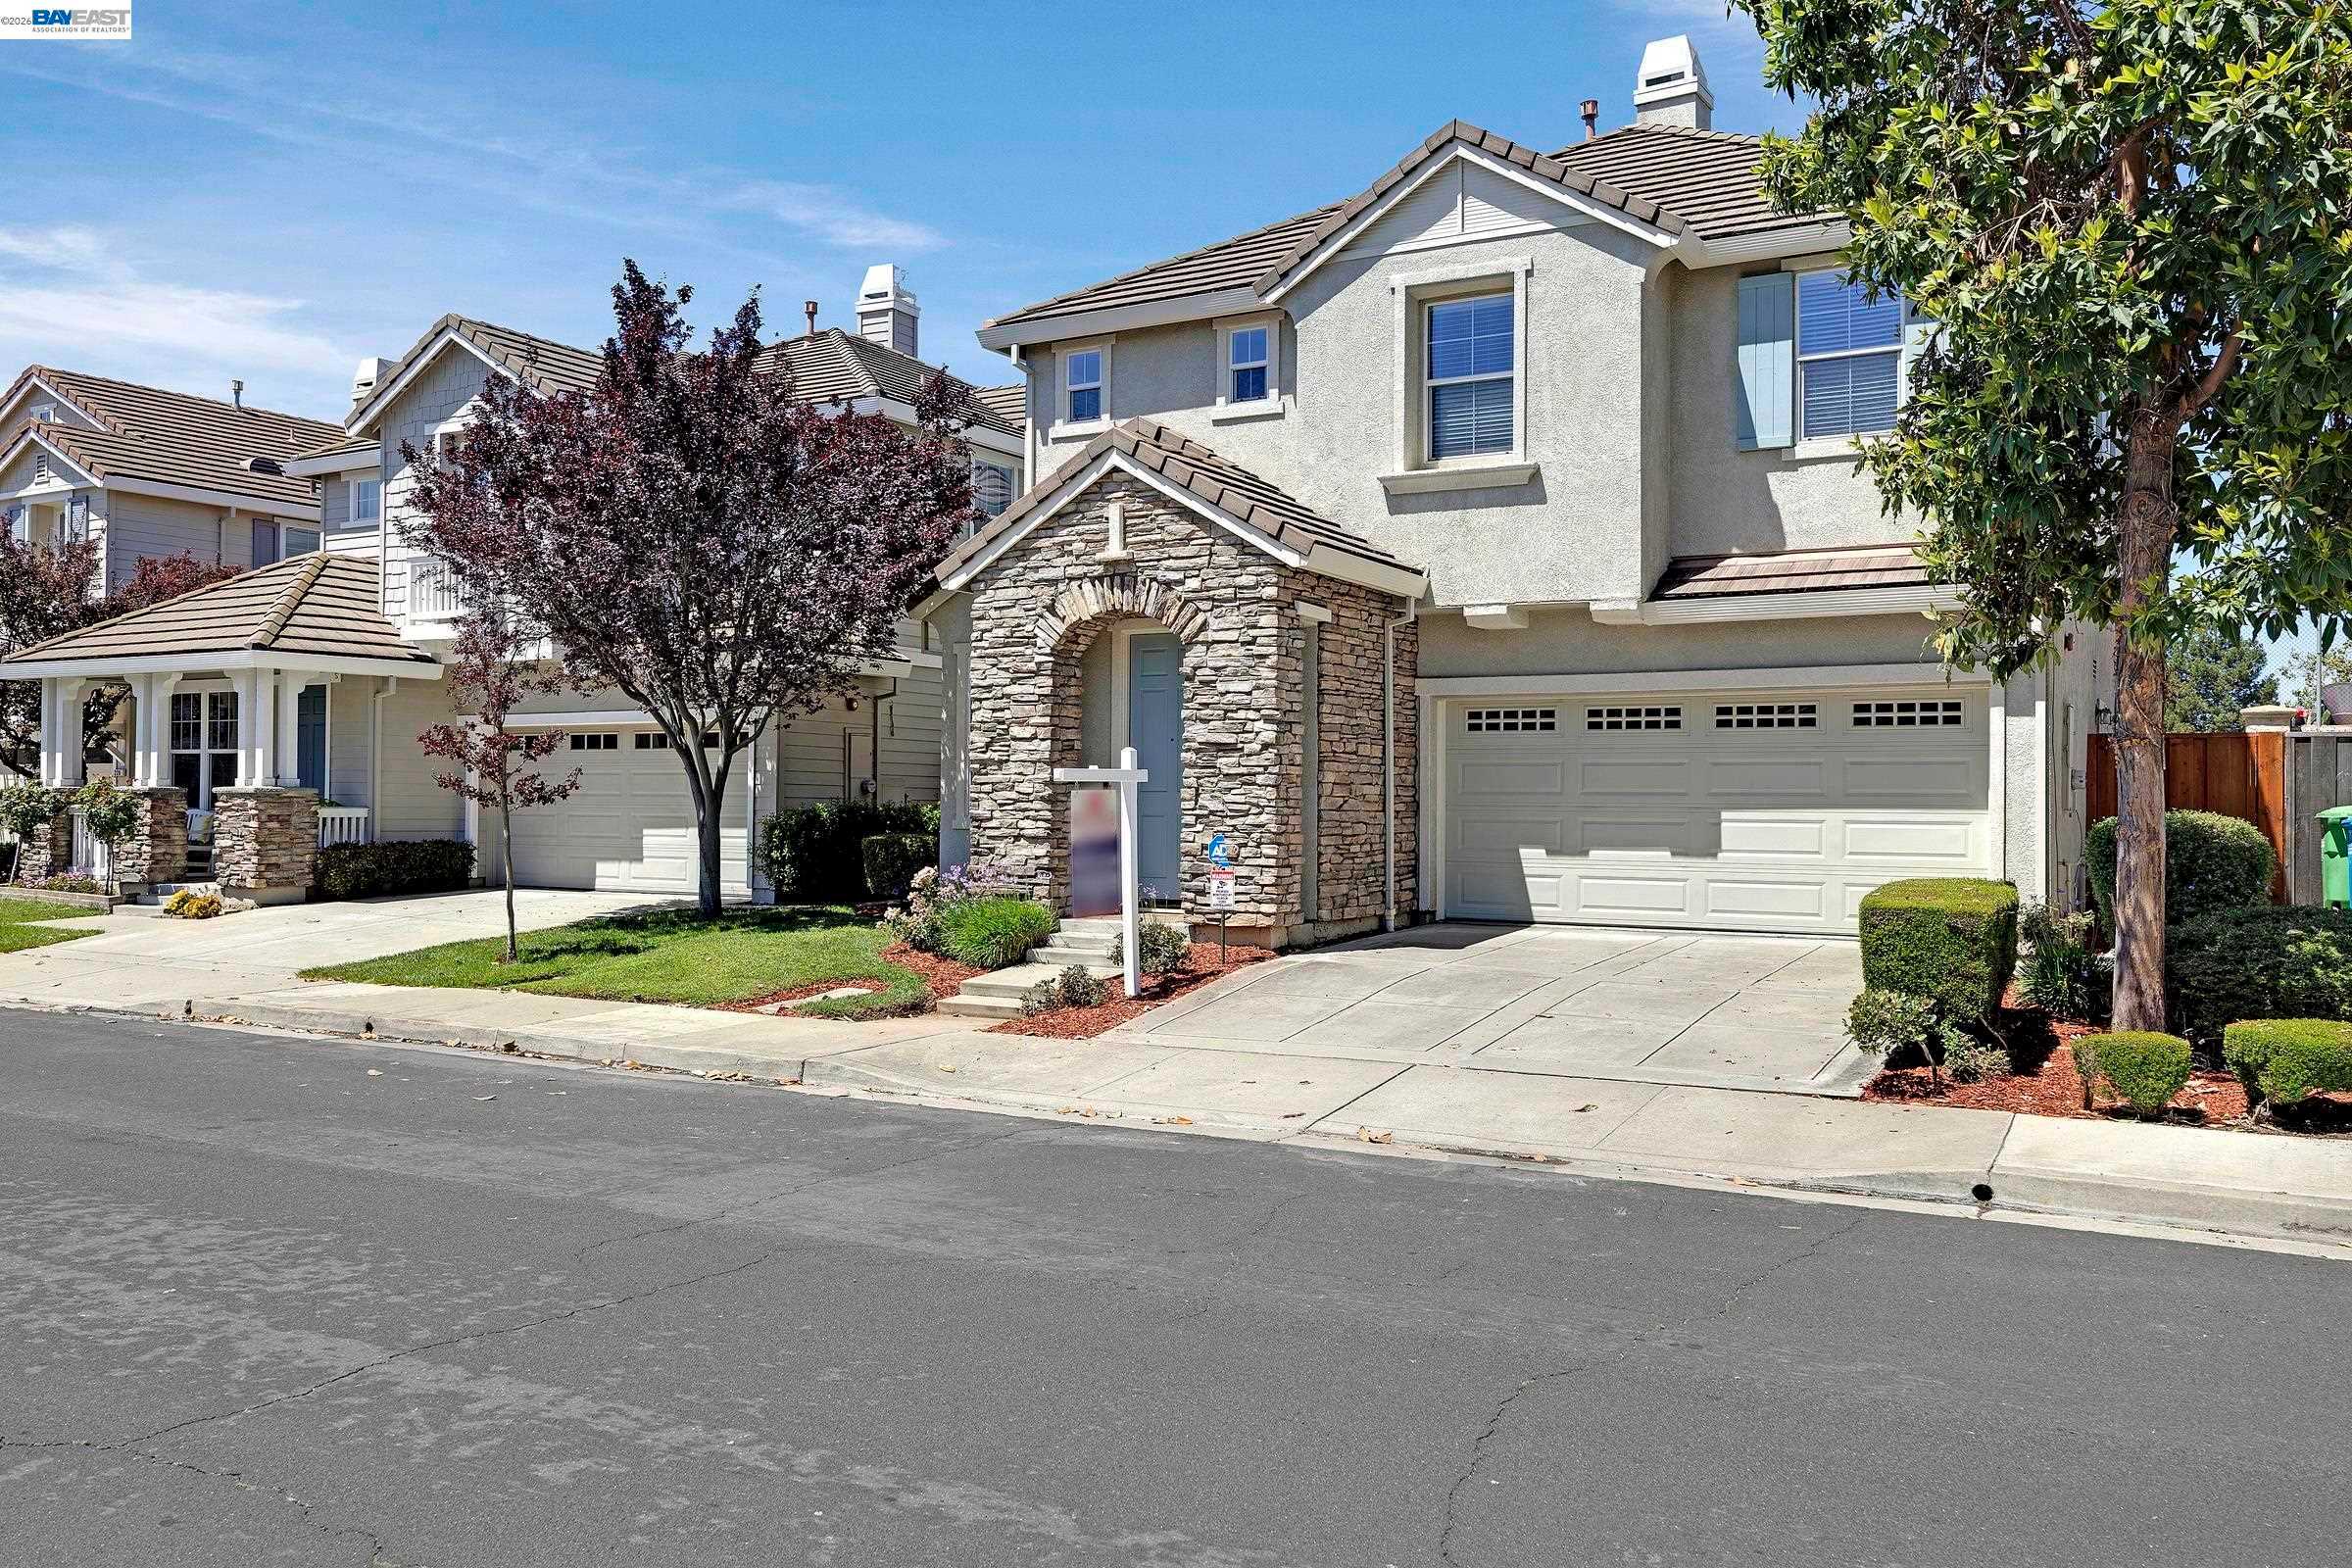
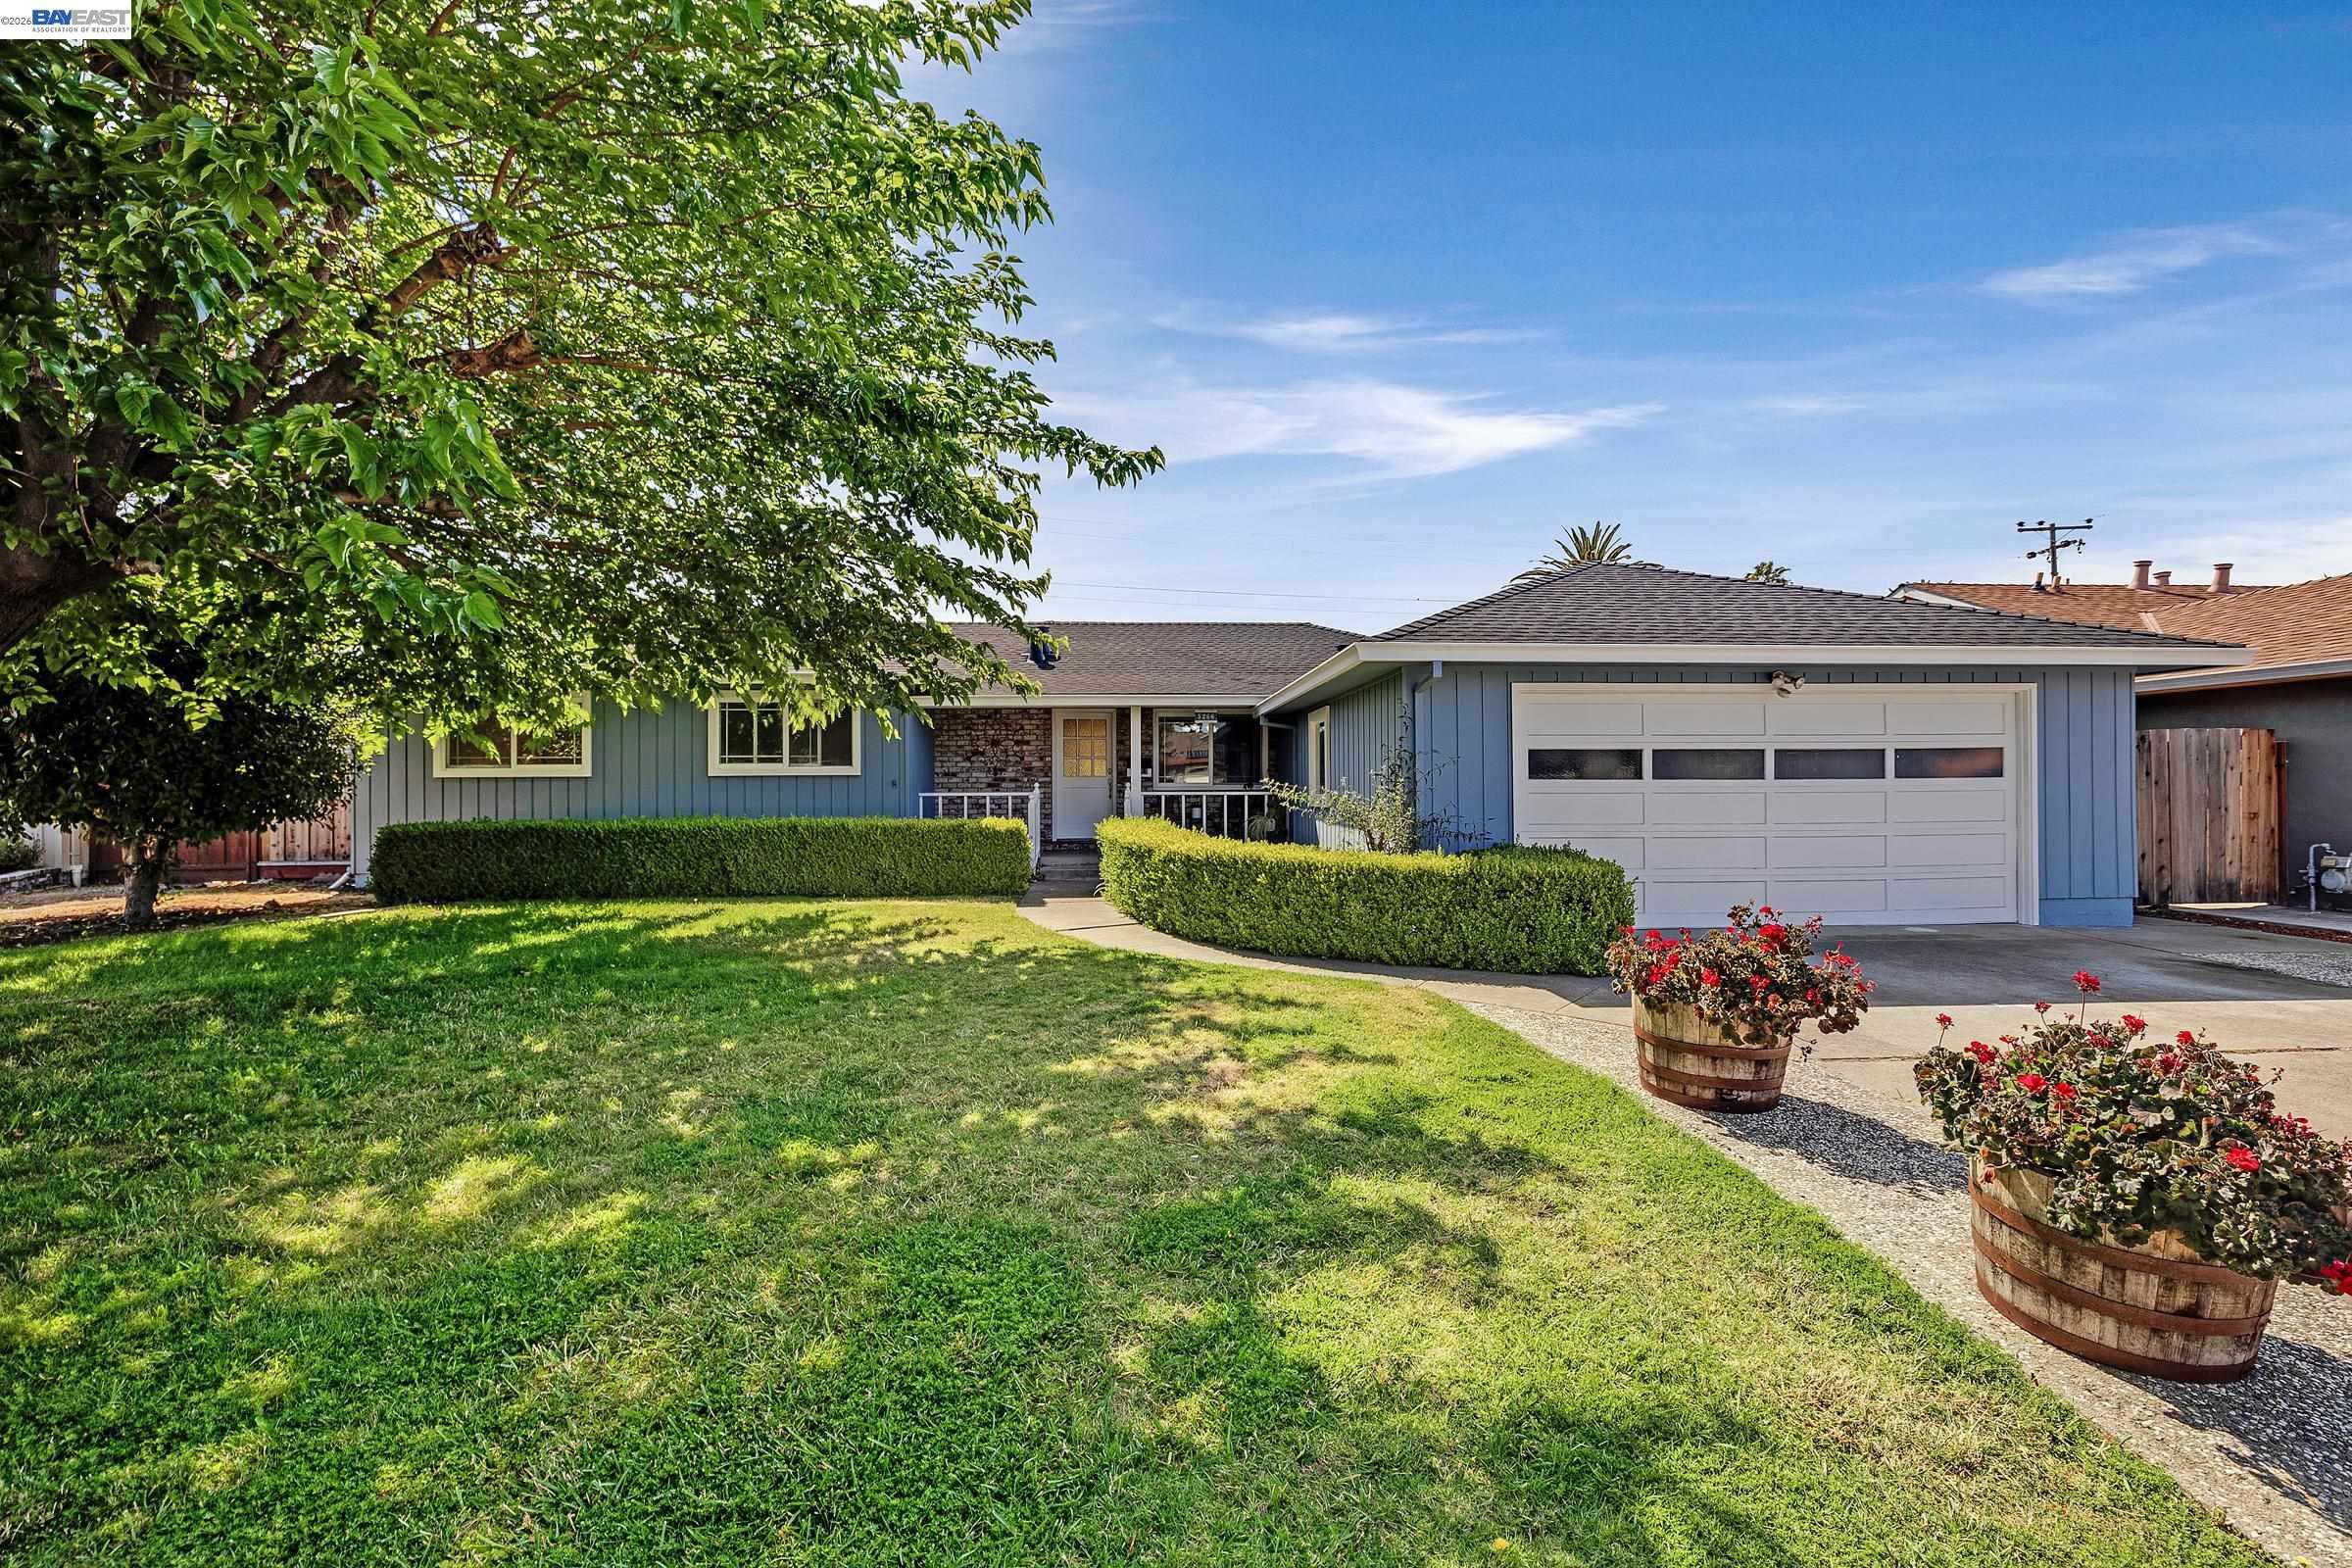
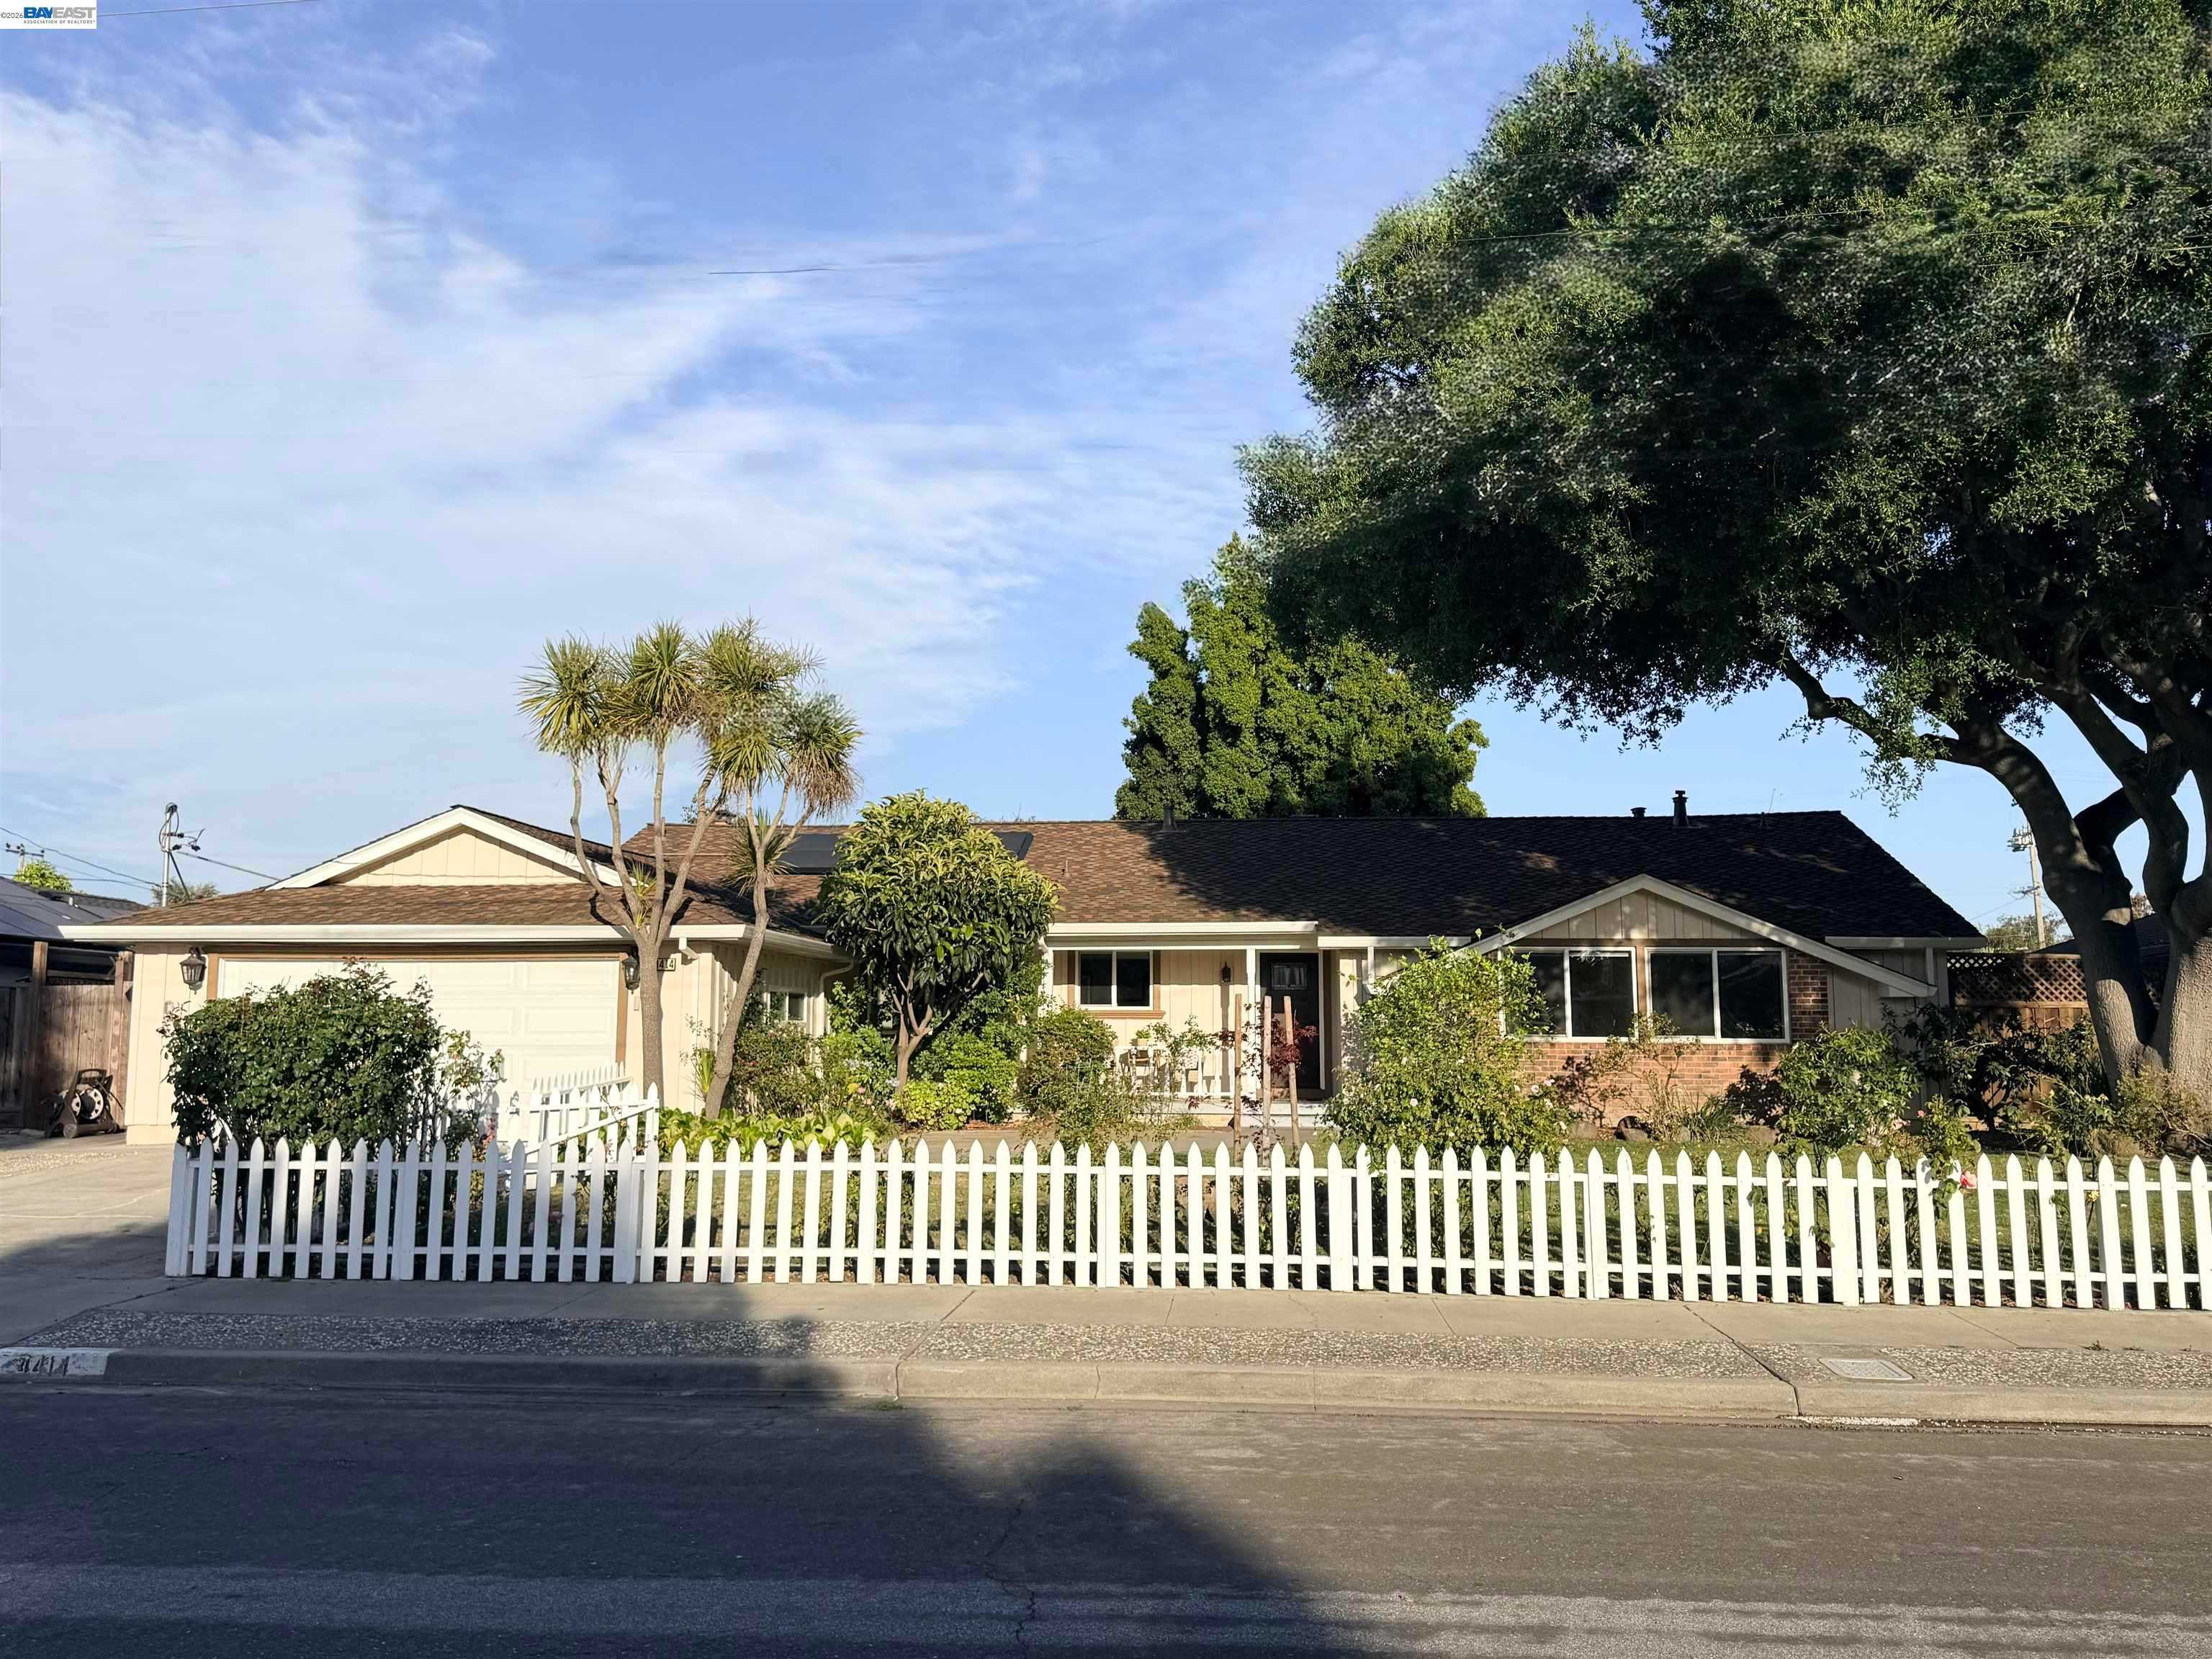
Behind these county totals: hundreds of homes still for sale in Fremont, Hayward, Union City, Newark and Milpitas, counted, priced and sorted every morning from the same MLS export, with a map search for the homes themselves.
30-Year Fixed: 7.58% +0.08 | 15-Year Fixed: 7.20% +0.08
Rates rose for a second day. Mortgage News Daily's 30-year reached 7.58% on Tuesday, the highest since November 2023, and the 15-year is 7.20%, the highest since October 2023. The 30-year started September at 6.89%, so on a $1,079,500 home with 20% down the payment is about $404 a month higher than it was four weeks ago.
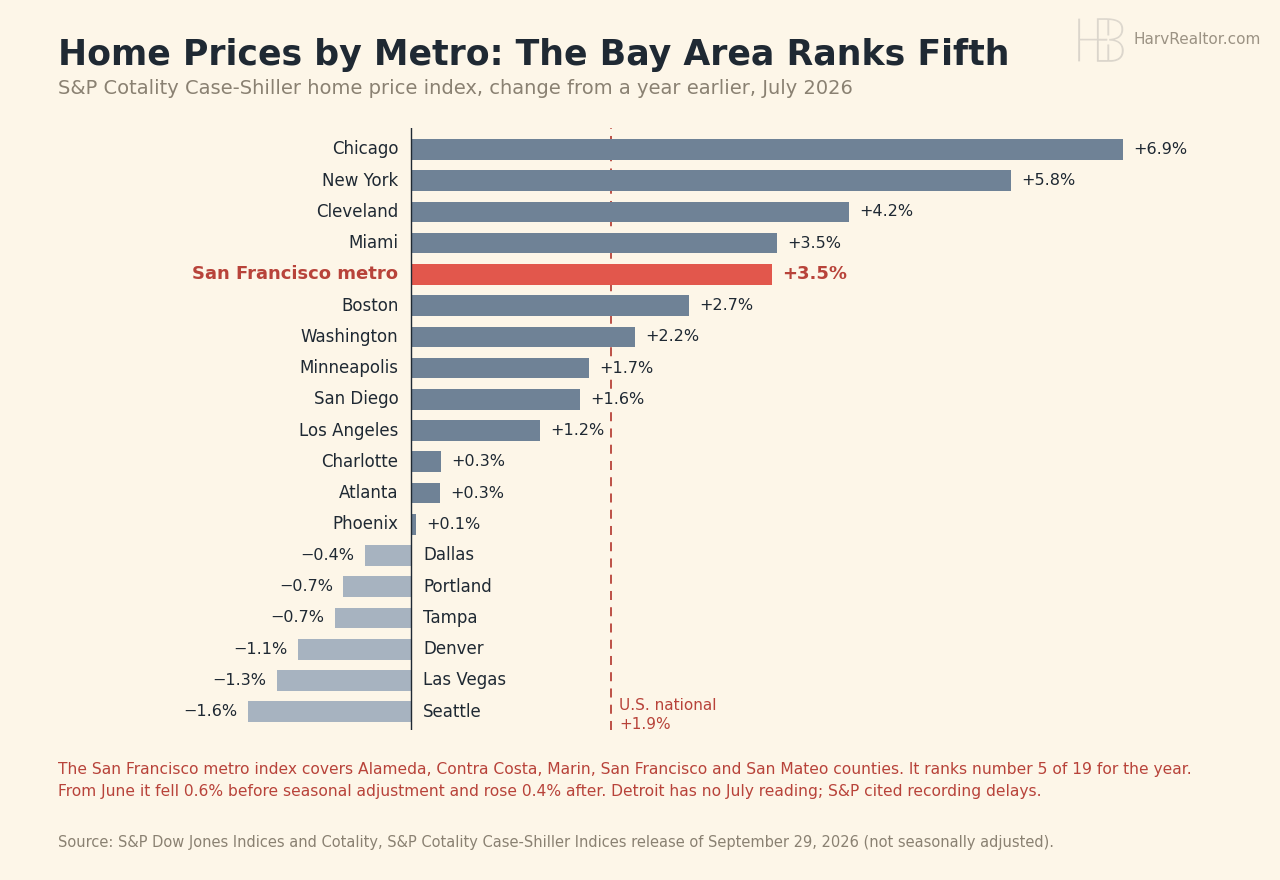
The Bay Area ranks fifth for home prices. Tuesday's S&P Cotality Case-Shiller report put U.S. home prices up 1.9% in July from a year earlier, while consumer prices rose 3.4%. The San Francisco metro index, which includes Alameda County, rose 3.5%, fifth of the 19 metros reported, behind Chicago, New York, Cleveland and Miami and ahead of San Diego and Los Angeles. One caution: July's reading averages sales that closed May through July, when the 30-year averaged 6.63%. It is a postcard from a cheaper summer.
Owners have a cushion. Cotality puts the average California borrower's home equity at $623,000 as of the second quarter, second only to Hawaii and about double the national $310,000.
Today's count. Board wide: 2,700 listings across the 15 city table, counting active and in contract together, with 174 coming soon and 184 brand new. The five city ledger carries 691 live listings across Fremont, Hayward, Milpitas, Newark and Union City, 606 on the market and 85 coming soon, down from 703 on Tuesday.
Fremont holds 249 live listings: 192 active, 32 coming soon, 24 brand new and 1 back on market, with a median on market list price of $1,199,990 at $764 a square foot and a typical listing out 29 days. Hayward carries 179, Milpitas 110, Newark 89 and Union City 64. Across all five cities the median is $1,079,500 at $671 a square foot, 285 homes are priced under a million, and 158 have been sitting 60 days or longer.
What it means for you. If you are buying, the same median home costs about $404 a month more than it did on September 1, so a price cut or a seller credit is worth asking for; 158 of the 606 homes on the market across these five cities have been listed 60 days or longer. If you are selling, you likely have the equity, but a July price index will not set an October price. Price for 7.58% money.
S&P 500: 7,670.84 -0.17% | Dow: 51,349.92 -0.26% | Nasdaq: 26,797.54 -0.09%
A second soft day, then a bounce. These are Tuesday's closes. The Conference Board's consumer confidence index fell 6.7 points to 81.9 in September, and job openings dropped to 7.1 million in August from 7.3 million in July. At 8:08 AM PT Wednesday, the last session of the third quarter, the S&P was up 0.51%, the Dow up 0.07% and the Nasdaq up 0.92%.
Netflix's rough year. The Los Gatos company's shares are down 25% in 2026, even after Tuesday's 1.55% gain, and HSBC and Wells Fargo both cut their ratings this month on signs that subscribers are watching less. YouTube took 14.2% of U.S. TV viewing in July against 7.8% for Netflix, per Bloomberg and The Wrap. The worry is not subscribers leaving; it is subscribers staying and watching YouTube.
10-Year Treasury: 5.26% +0.02 | Gold: $4,179.70 +0.27% | Silver: $61.15 -0.92% | Brent Crude: $102.59 -2.56%
The 10-Year matches its 2007 peak. It closed at 5.26% Tuesday, equal to its June 12, 2007 close; the last higher one was in May 2002. Britain sold 10-year bonds the same day at 5.383%, its highest auction yield since 1999, Bloomberg reports. In the Conference Board's September survey, 68.4% of consumers expect interest rates to be higher in a year, and plans to buy homes slipped.
A heads up on oil. Brent's November contract settled down 2.56% at $102.59 and expires today. December takes over tomorrow, trading about $5 lower, so tomorrow's lower number will be the calendar, not a crash. The cards are Tuesday's closes and settlements; at 8:08 AM PT Wednesday gold was up 0.48% and silver down 0.57%.
Bitcoin: $83,834 +0.94% | Ethereum: $2,678.86 +0.19% | XRP: $1.50 -1.27%
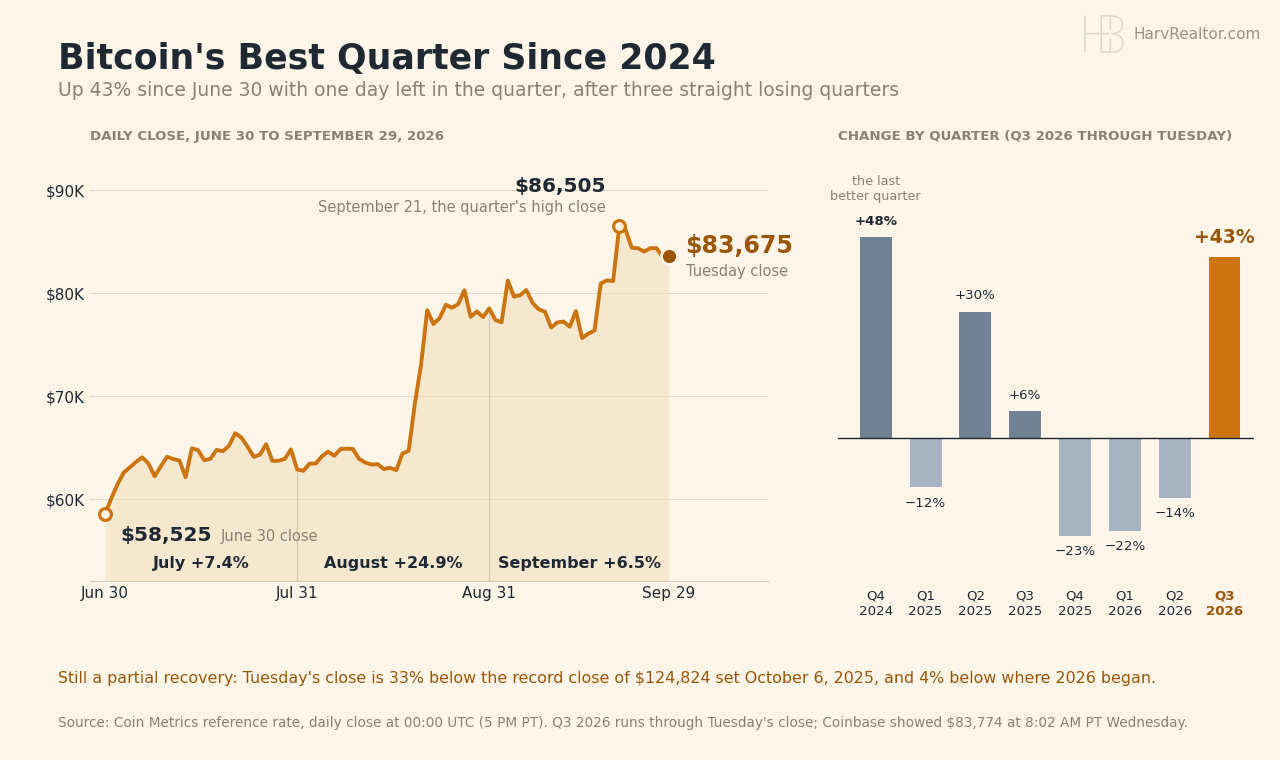
Bitcoin's best quarter since 2024. Bitcoin closed Tuesday at $83,675, up 43% since June 30, its best quarter since the last three months of 2024 and its first winning quarter in a year. It follows three losing quarters, so Bitcoin is still 33% below last October's record close and 4% below where it started 2026. The quarter ends at 5 PM PT today. Separately, Bitget, the exchange that lost about $387 million to a hack last week, is reopening withdrawals in phases. Prices are live from Coinbase at 8:08 AM PT.
Sources
- Mortgage News Daily (30 and 15 year fixed, September 29 reading)
- U.S. Treasury (10-Year daily yield curve, September 28 and 29)
- S&P Dow Jones Indices and Cotality (S&P Cotality Case-Shiller Indices, July 2026, released September 29)
- Cotality (Homeowner Equity Insights, second quarter 2026)
- The Conference Board (Consumer Confidence Survey, September 2026)
- U.S. Bureau of Labor Statistics (job openings, August 2026)
- Bloomberg (Netflix; the U.K. bond auction)
- The Wrap (HSBC and Wells Fargo ratings on Netflix)
- Yahoo Finance (Brent November contract settlement)
- CNBC quotes (index levels, COMEX settlements, live Wednesday prices)
- Coin Metrics (Bitcoin daily closes and quarterly changes)
- DefiLlama (Bitget hack record and reserves)
- Coinbase (live crypto, 8:08 AM PT September 30)
- REALTY EXPERTS® Live Inventory (five city ledger, September 30)
Disclaimer: The market data, rates, and information provided are for informational purposes only and should not be considered financial advice. Always verify rates and data with your lender or financial advisor before making any decisions.
Based on information from the Bay East Association of REALTORS® (Bay East MLS) as of September 30, 2026. All data, including all measurements and calculations of area, is obtained from various sources and has not been, and will not be, verified by broker or MLS. All information should be independently reviewed and verified for accuracy. Properties may or may not be listed by the office/agent presenting the information.