



"At a Glance" Local Housing STATS and News 09/27/26
September 27, 2026 · Alameda County Market Dashboard
TODAY'S LIVE INVENTORY
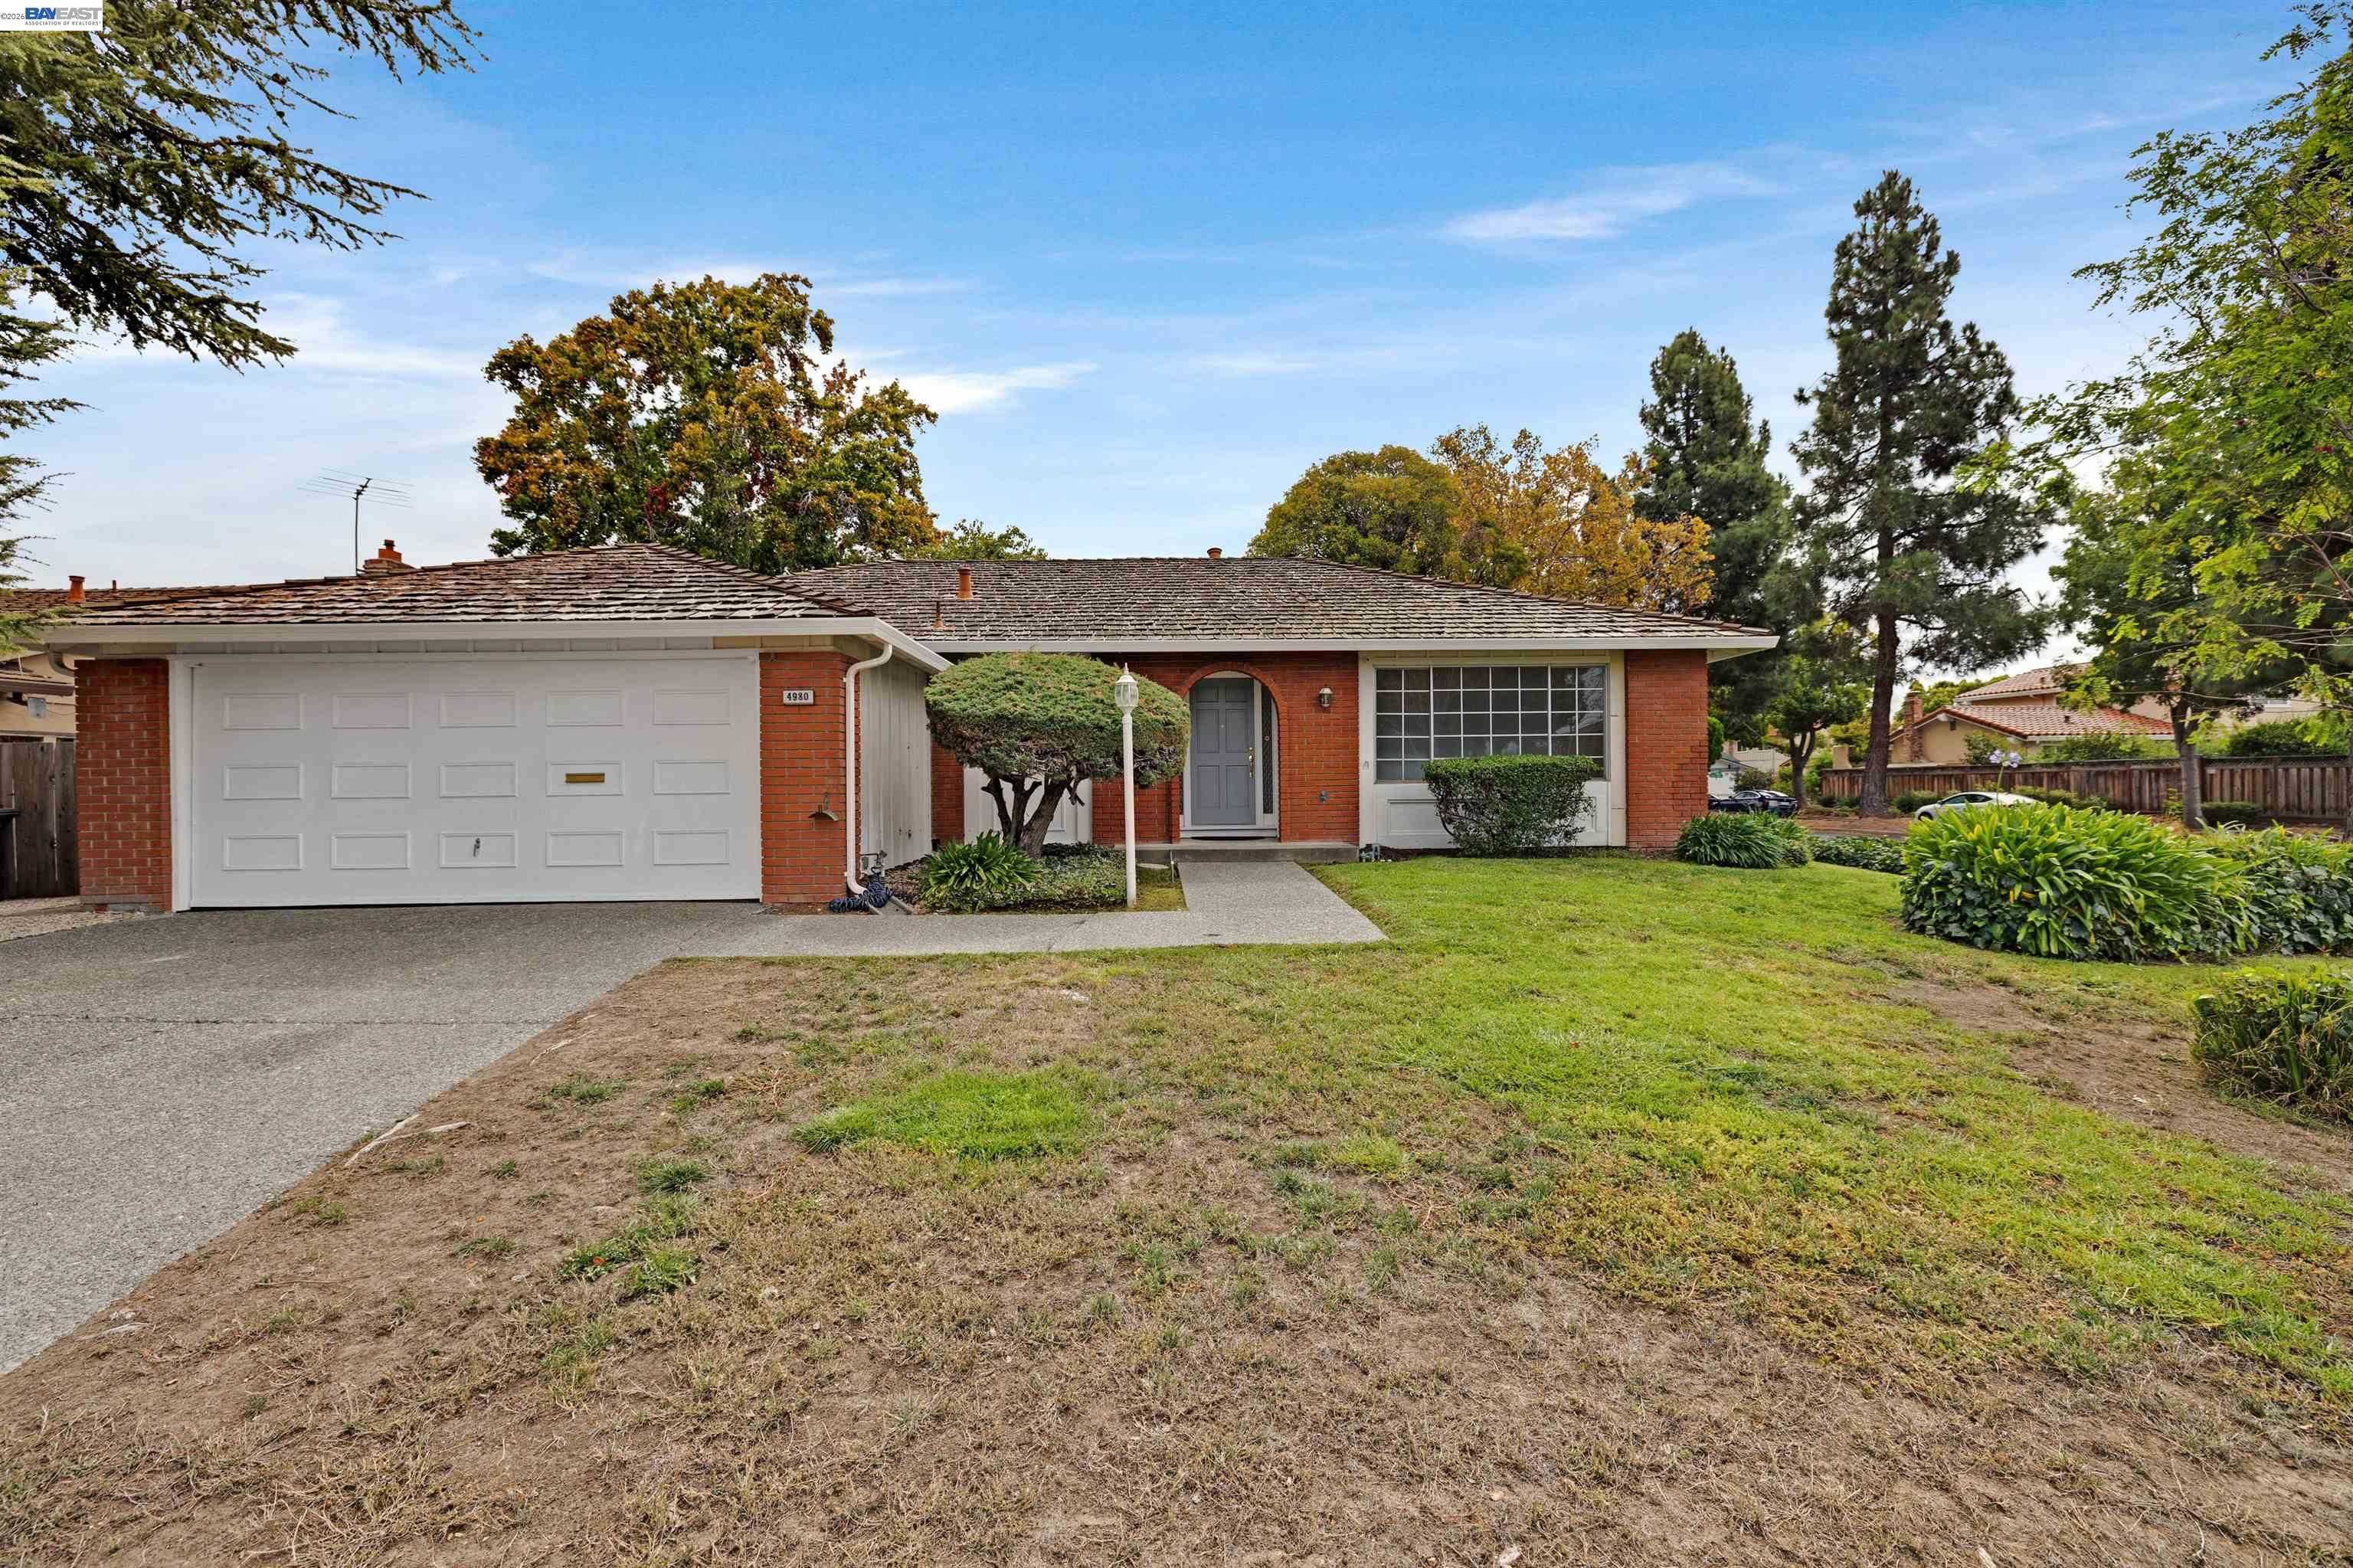
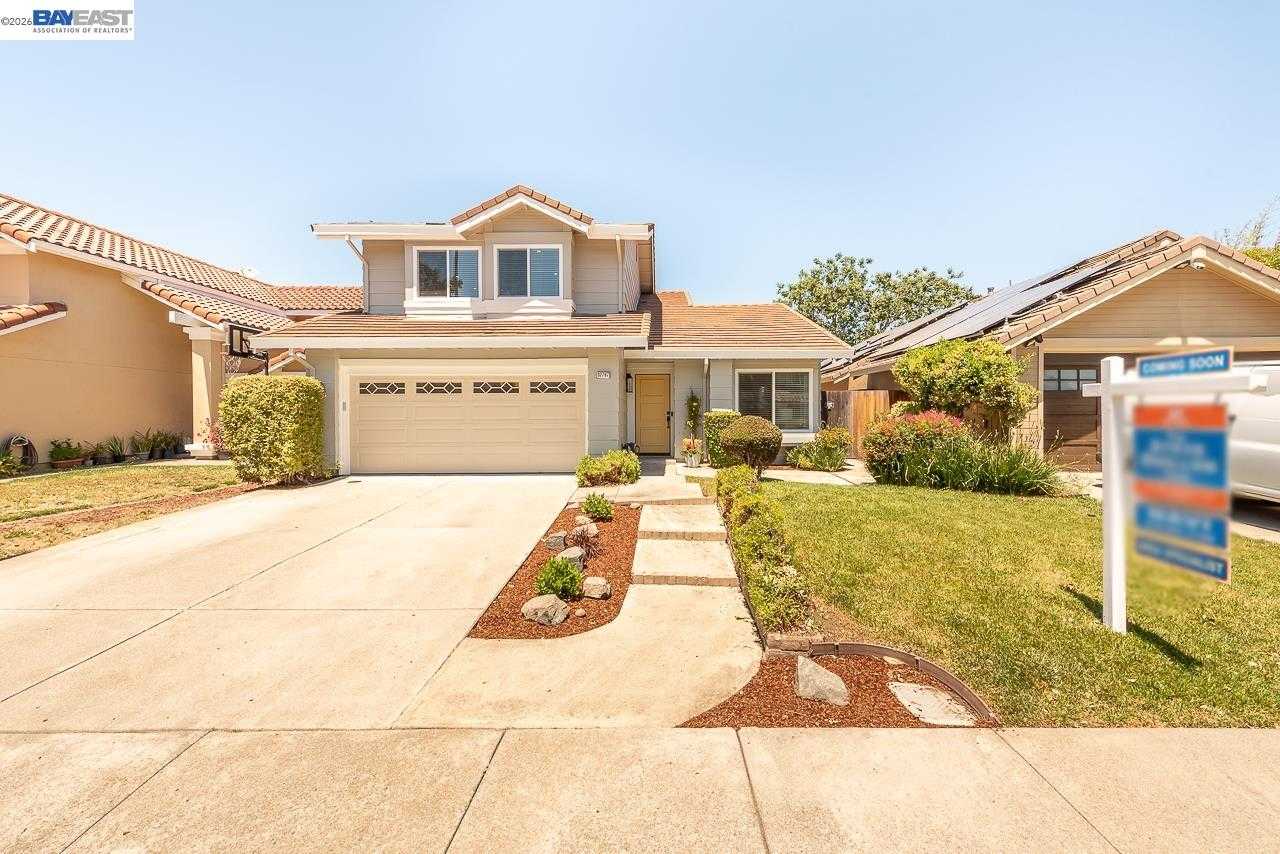
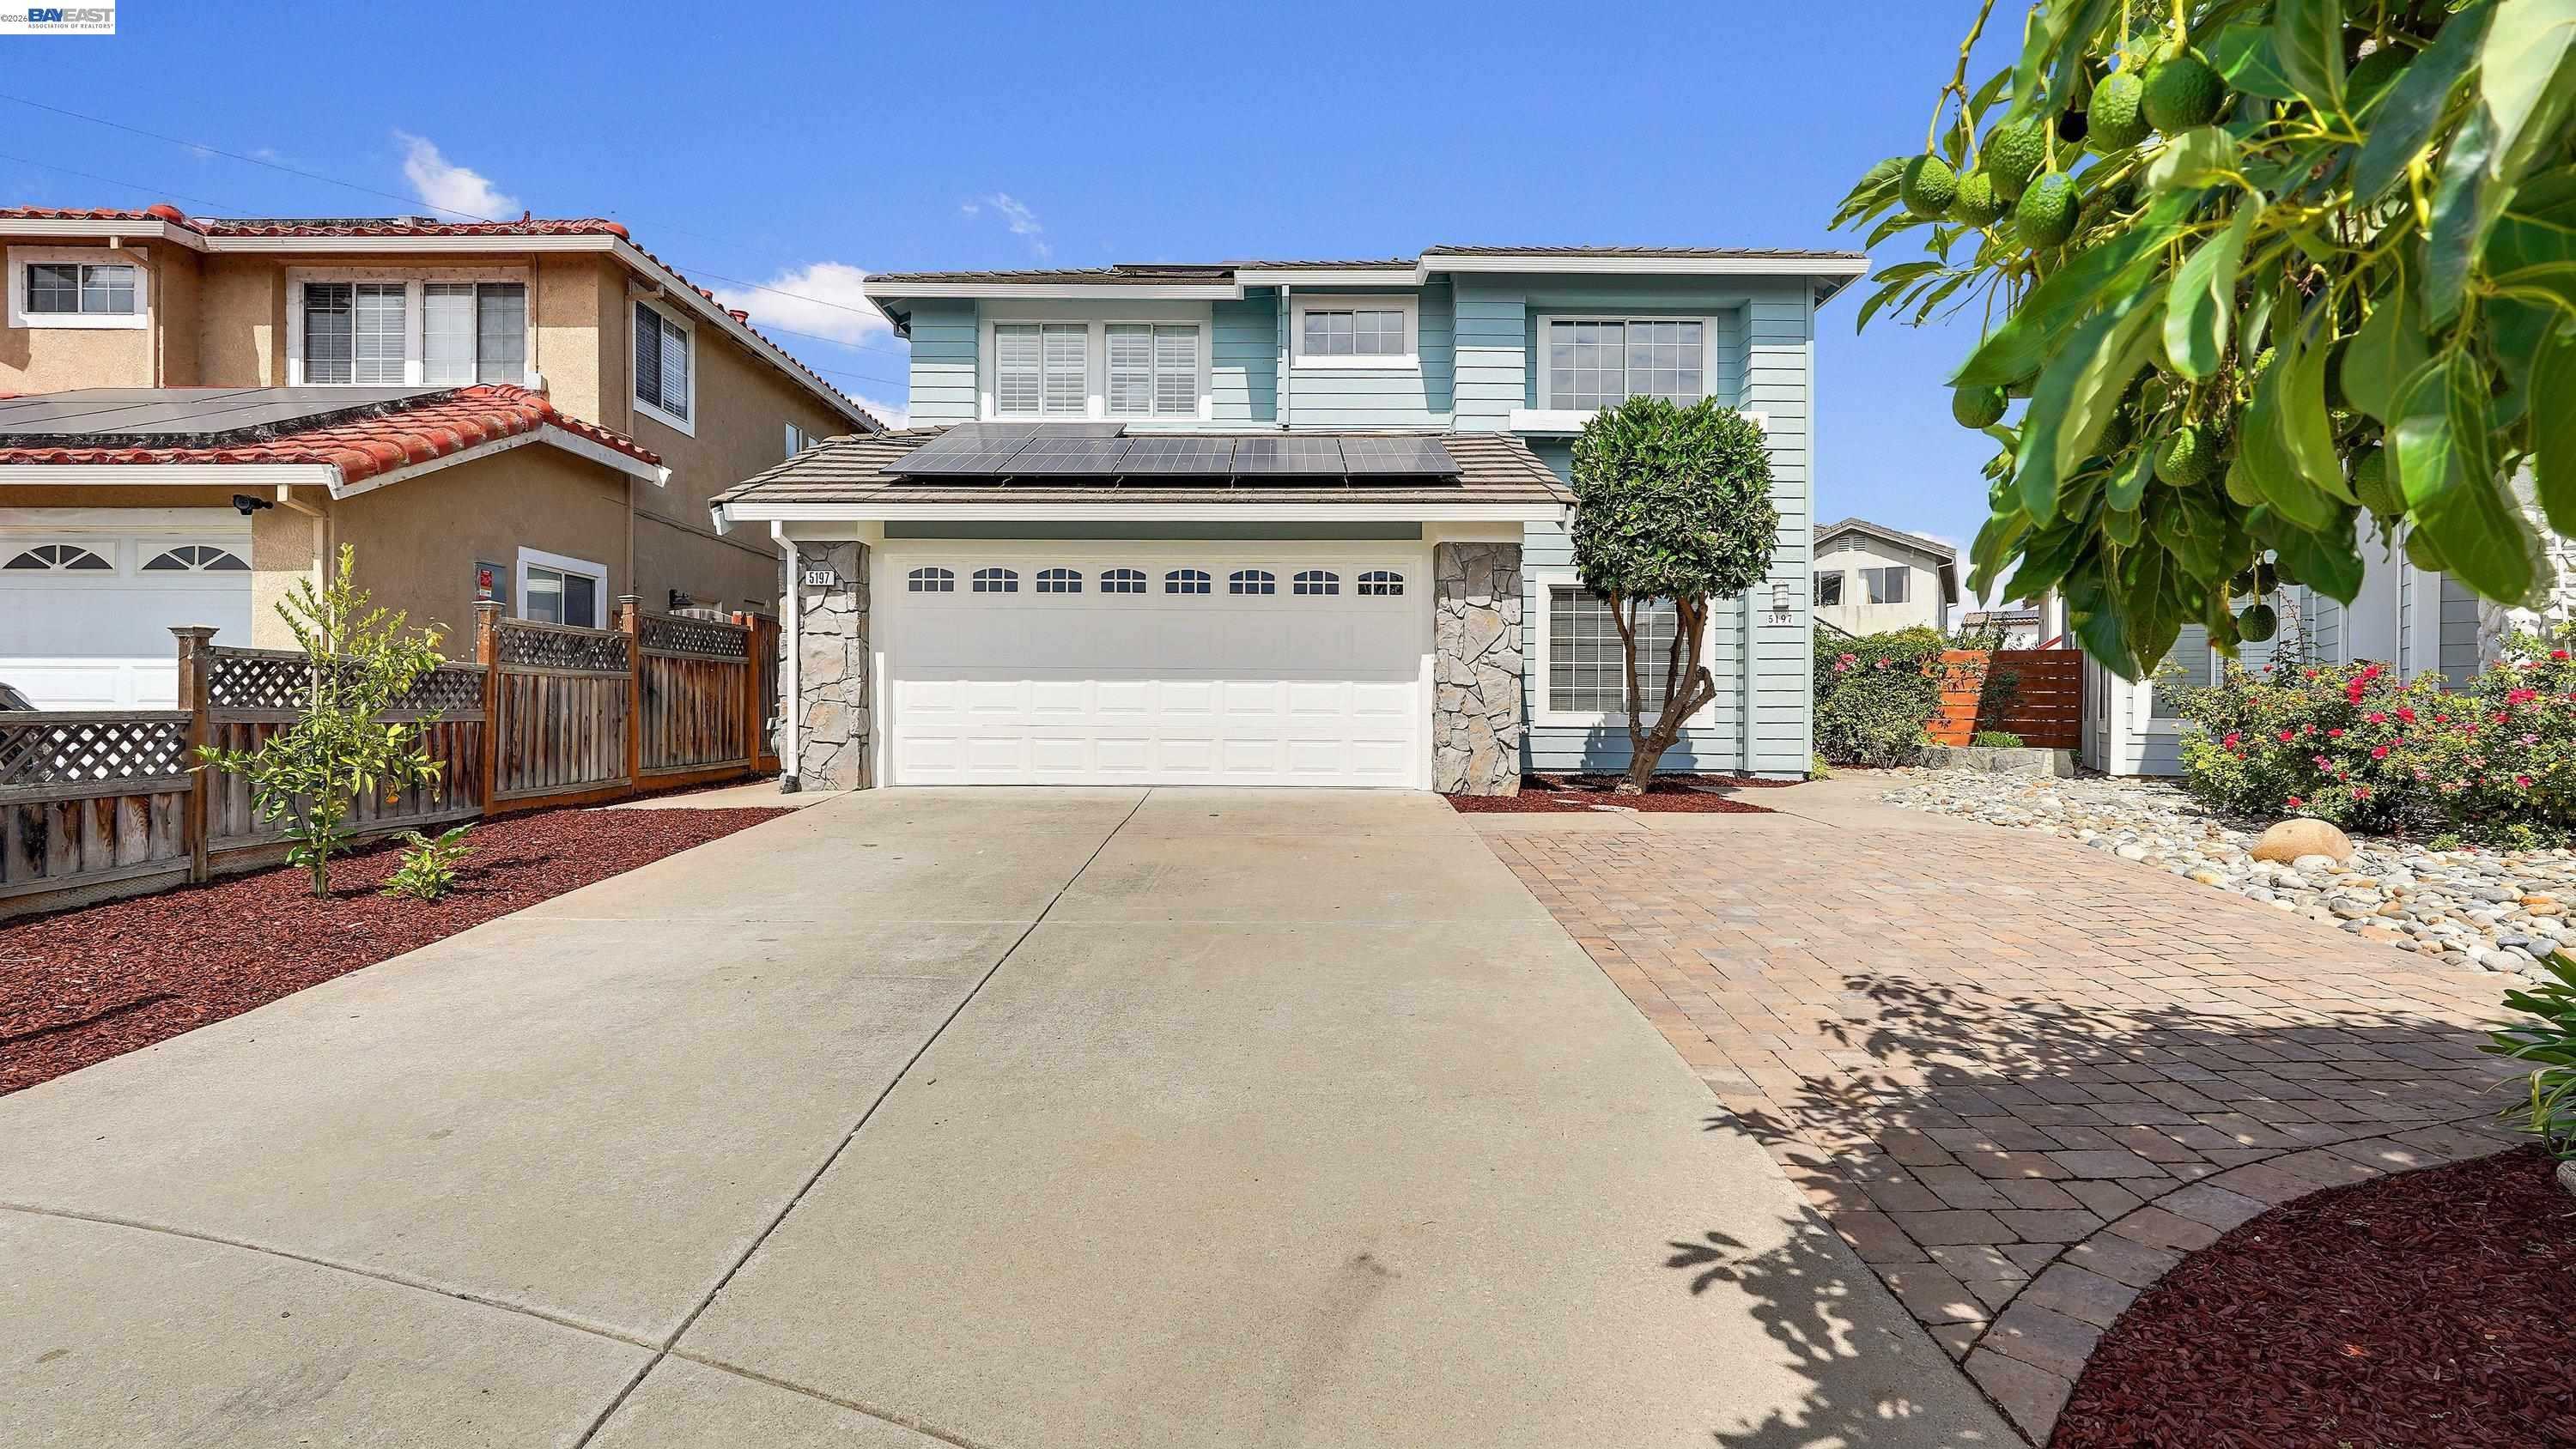
Behind these county totals: hundreds of homes still for sale in Fremont, Hayward, Union City, Newark and Milpitas, counted, priced and sorted every morning from the same MLS export, with a map search for the homes themselves.
30-Year Fixed: 7.43% -0.02 | 15-Year Fixed: 7.10% 0.00
Rates are where Friday left them. Mortgage News Daily has the 30-year at 7.43% and the 15-year at 7.10%, a step off Thursday's 52 week highs. Lenders do not reprice over the weekend.
A year of our own MLS data, in three charts. Fremont, Newark and Union City have 412 homes for sale today, counting active, new, back on market and coming soon. That is 25% more than the 329 on October 7, 2025, the earliest export I have saved, and about the same as the 408 a month ago.
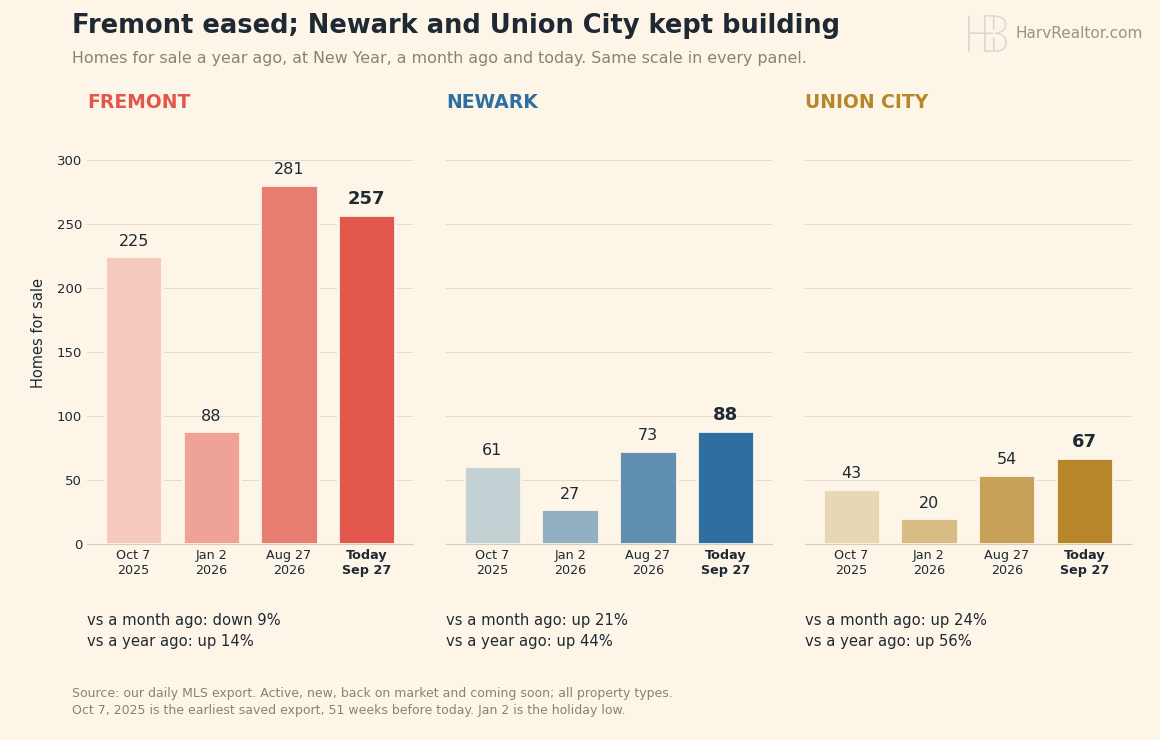
The total held, but the mix moved. Fremont eased 9% in a month to 257, while Newark rose 21% to 88 and Union City 24% to 67. All three are above a year ago: Fremont up 14%, Newark up 44%, Union City up 56%.
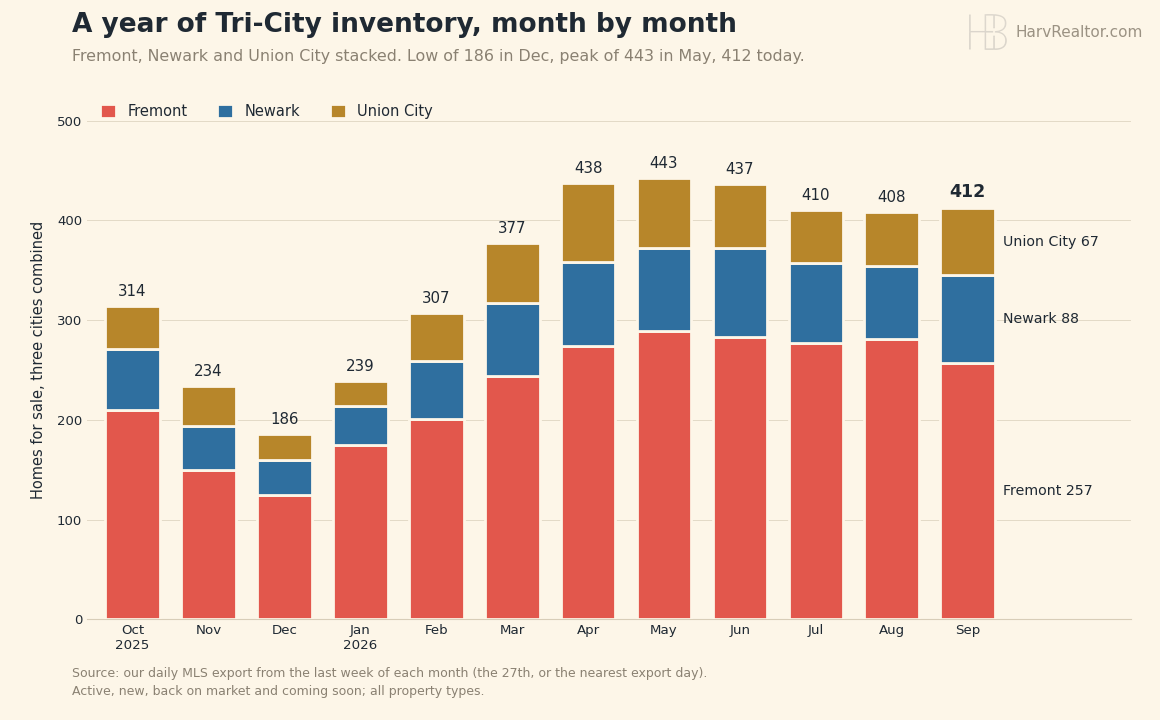
The usual seasonal shape, with a slower drain. The three cities bottomed at 135 homes on January 2, peaked at 443 in late May, and sit 7% below that peak now. What is different is the pace: 143 homes are pending, against 158 a month ago and 152 a year ago, so there are 2.9 homes for sale for every one in contract, up from 2.2 a year ago.
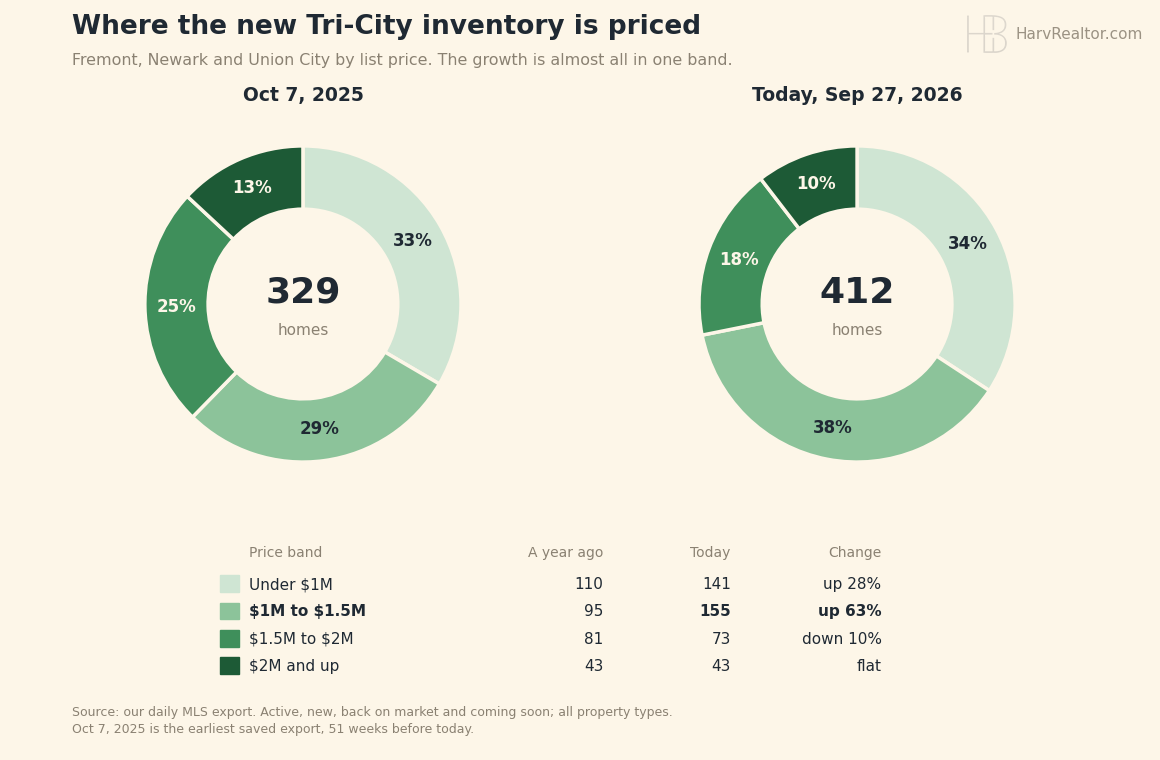
The new supply is priced $1M to $1.5M. That band went from 95 listings a year ago to 155 today, up 63%, and now makes up 38% of the Tri-City inventory. Under $1M rose 28% to 141, $1.5M to $2M slipped to 73 from 81, and $2M and up held at 43.
Today's count. Board wide: 2,761 listings across the 15 city table, counting active and in contract together, with 183 coming soon and 232 brand new. The five city ledger carries 713 live listings across Fremont, Hayward, Milpitas, Newark and Union City, 627 on the market and 86 coming soon.
Fremont holds 257 live listings, 198 active, 37 coming soon and 22 brand new, with a median on market list price of $1,199,400 at $777 a square foot and a typical listing out 29 days. Hayward carries 182, Milpitas 119, Newark 88 and Union City 67. Across all five cities the median is $1,089,000 at $679 a square foot, 290 homes are priced under a million, and 164 have been sitting 60 days or longer.
What it means for you. If you are buying between $1M and $1.5M, you have nearly as much choice as at the May peak, and more time to compare. On Fremont's median of $1,199,400 with 20% down, the $959,520 loan is high balance conforming here, and principal and interest runs $6,663 a month at 7.43%, against $5,747 at the 5.99% 52 week low. If you are selling in that band, you are competing with more listings than any other band, so price for it on day one.
S&P 500: 7,743.41 +0.51% | Dow: 51,828.62 +0.93% | Nasdaq: 27,068.72 +0.48%
A winning week, and a quiet weekend. These are Friday's closes. The S&P 500 rose 1.21% on the week and the Nasdaq 2.06%, and the Dow's Friday rally ended a three week losing streak, all with the 10-Year near 5.2%.
The long view. Sunday's reading was a history of the 1970s, when cash lost ground to inflation year after year. Today the S&P 500 has roughly doubled since the end of 2022, from 3,839.50 to 7,743.41. Past performance, as the fine print insists, guarantees nothing.
10-Year Treasury: 5.17% -0.01 | Gold: $4,321.20 +0.54% | Silver: $64.80 +1.25% | Brent Crude: $104.32 -2.14%
Yields, metals and oil. The 10-Year finished the week at 5.17%, just under Thursday's 5.18%, the highest close since 2007. Gold settled Friday at $4,321.20 and silver at $64.80. Brent, on the November contract, gave back 2.14% to $104.32 on hopes that shipping through the Strait of Hormuz could reopen.
Keeping up is not getting ahead. A savings account paying 4.5%, taxed in the 22% bracket, keeps about 3.5%, and consumer prices rose 3.4% in the year to August, per the Bureau of Labor Statistics. Cash is holding its ground, not gaining any.
Bitcoin: $84,462 +0.20% | Ethereum: $2,676.57 -0.44% | XRP: $1.51 -0.76%
The only market open on a Sunday. Bitcoin is at $84,462, up 0.20% over 24 hours, Ether is down 0.44% and XRP down 0.76%. Bitcoin has spent five days near $84,000 since Wednesday's slide from about $86,600. These are live from CoinGecko at 3:08 PM PT.
Sources
- Mortgage News Daily (30 and 15 year fixed, September 25 reading)
- U.S. Treasury (10-Year daily yield curve, September 24 and 25)
- Bureau of Labor Statistics (Consumer Price Index, August 2026)
- CNBC and Yahoo Finance (index closes, COMEX gold and silver settlements, Brent November contract)
- CoinGecko (live crypto, 3:08 PM PT September 27)
- Paragon MLS daily exports, October 7, 2025 through September 27, 2026 (Tri-City inventory charts)
- REALTY EXPERTS® Live Inventory (five city ledger, September 27)
Disclaimer: The market data, rates, and information provided are for informational purposes only and should not be considered financial advice. Always verify rates and data with your lender or financial advisor before making any decisions.