



"At a Glance" Local Housing STATS and News 09/20/26
September 20, 2026 · Alameda County Market Dashboard
TODAY'S LIVE INVENTORY
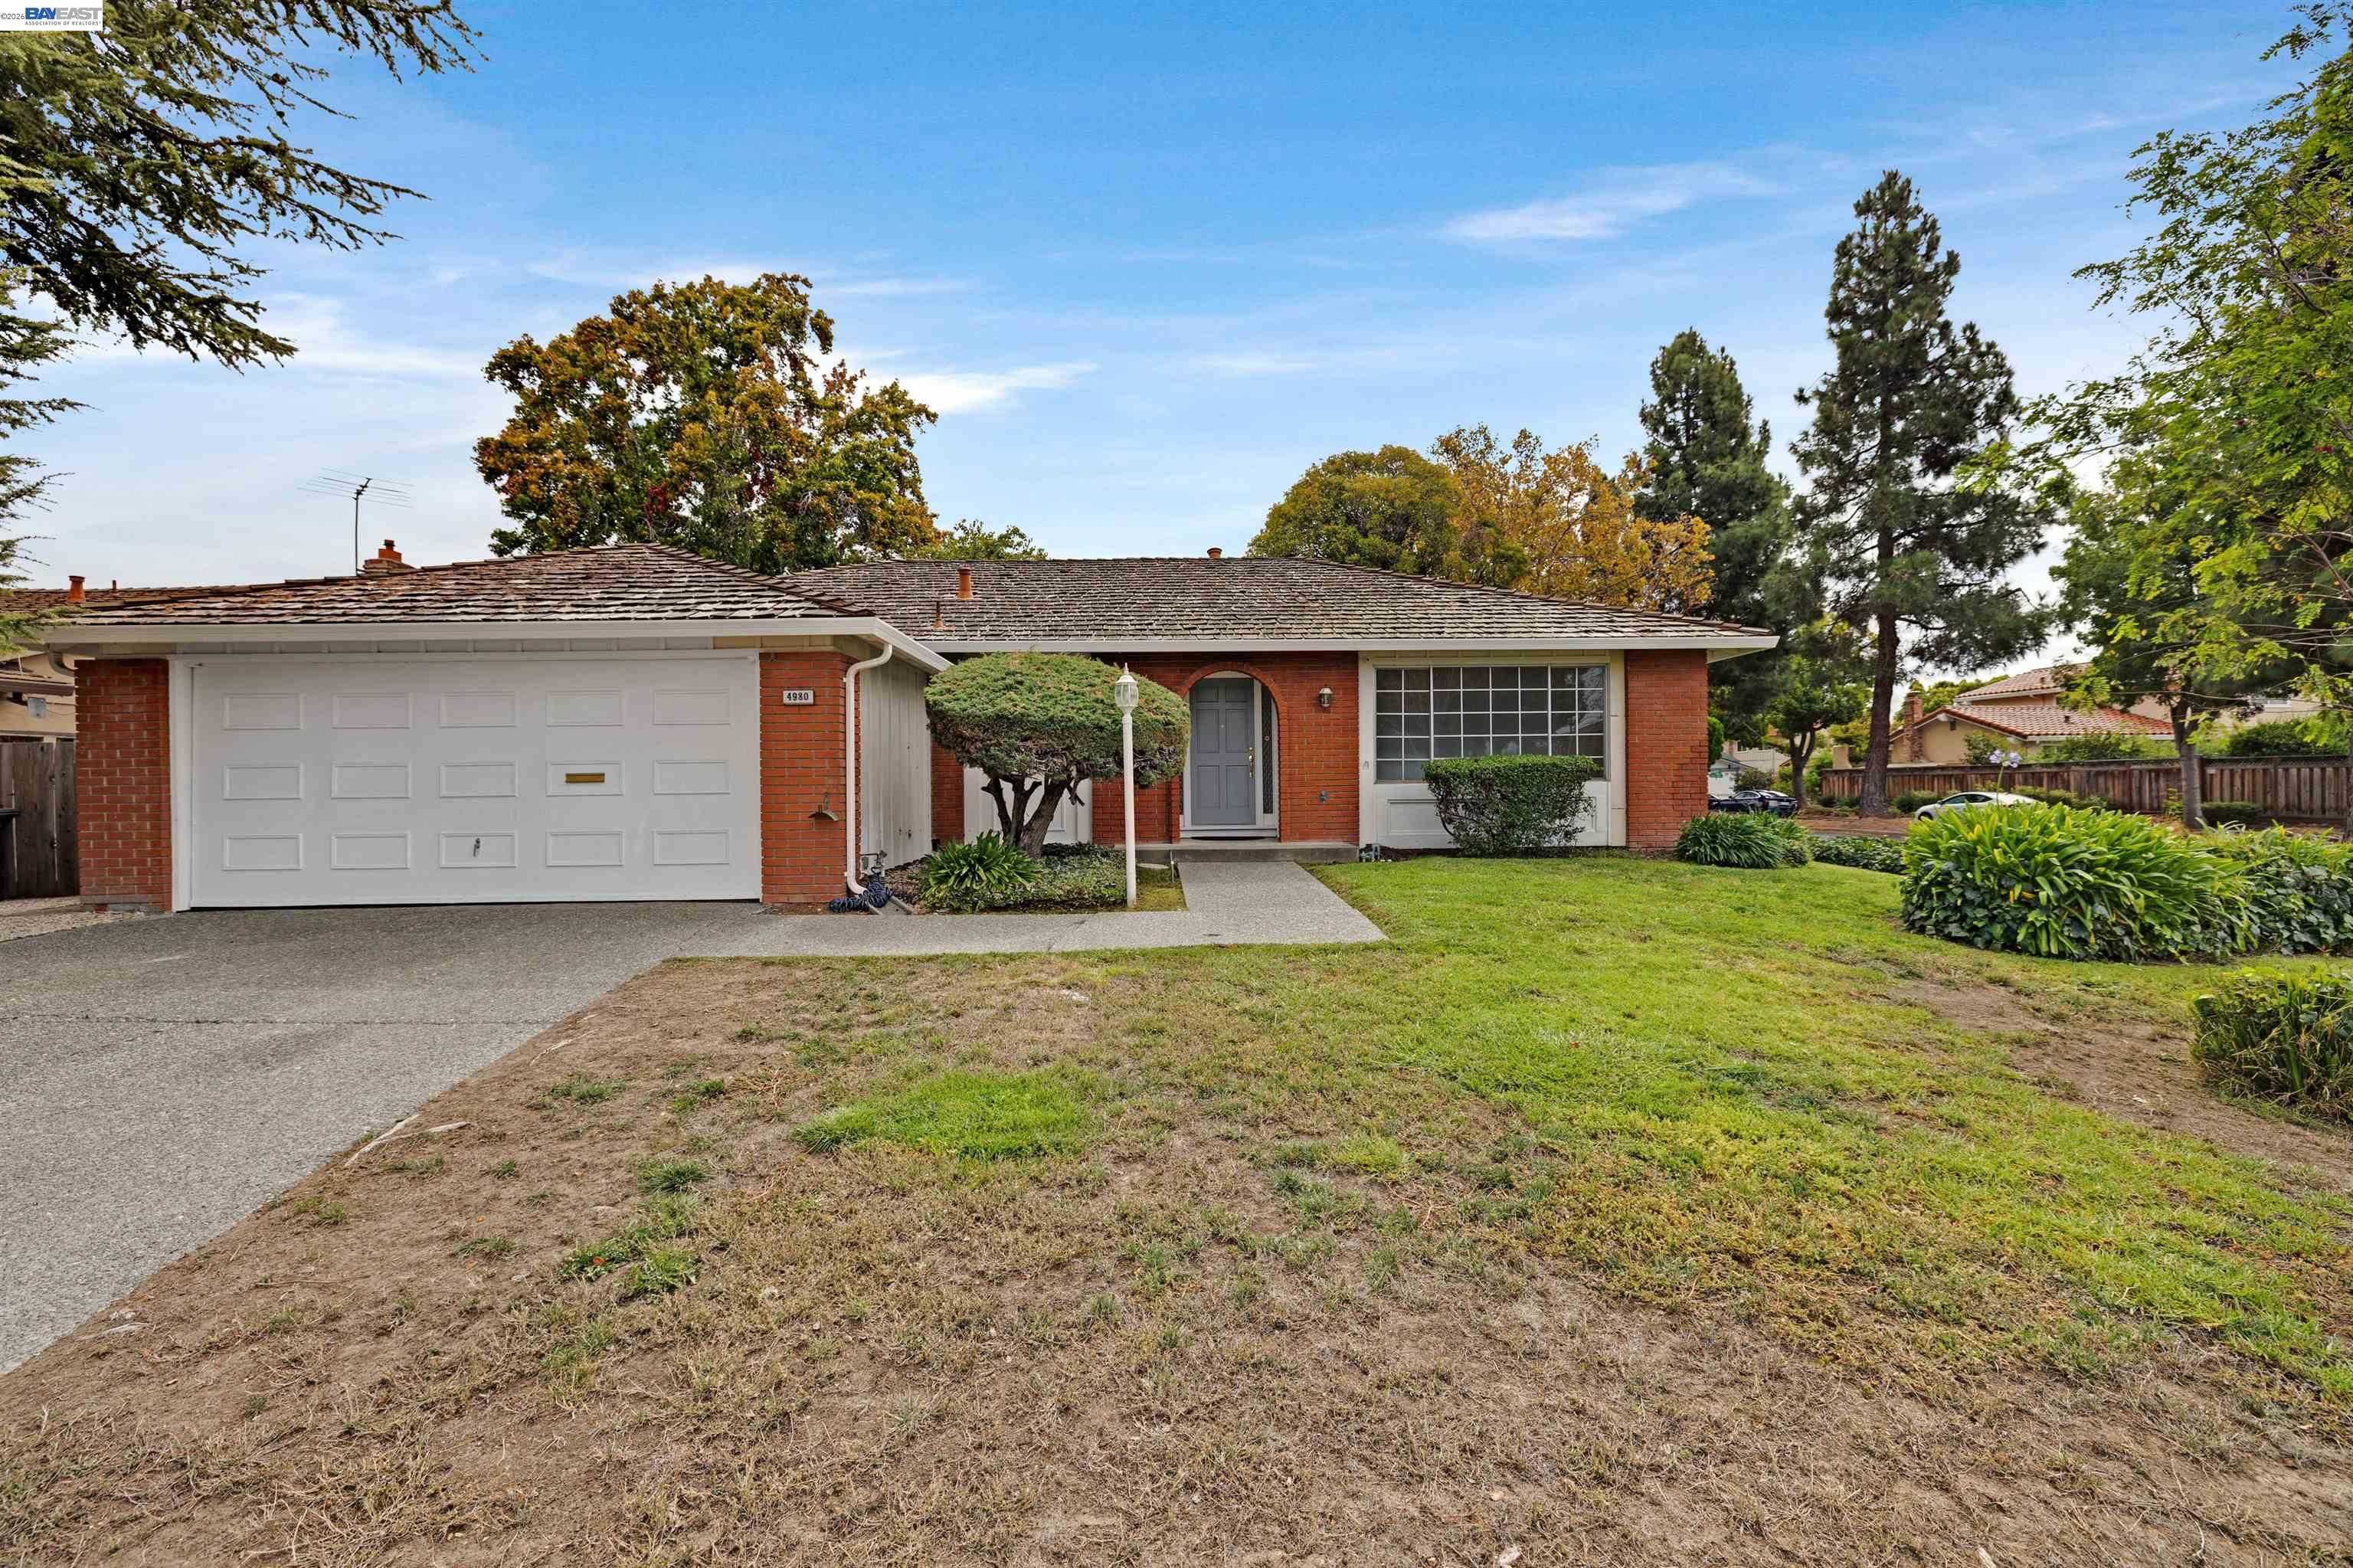
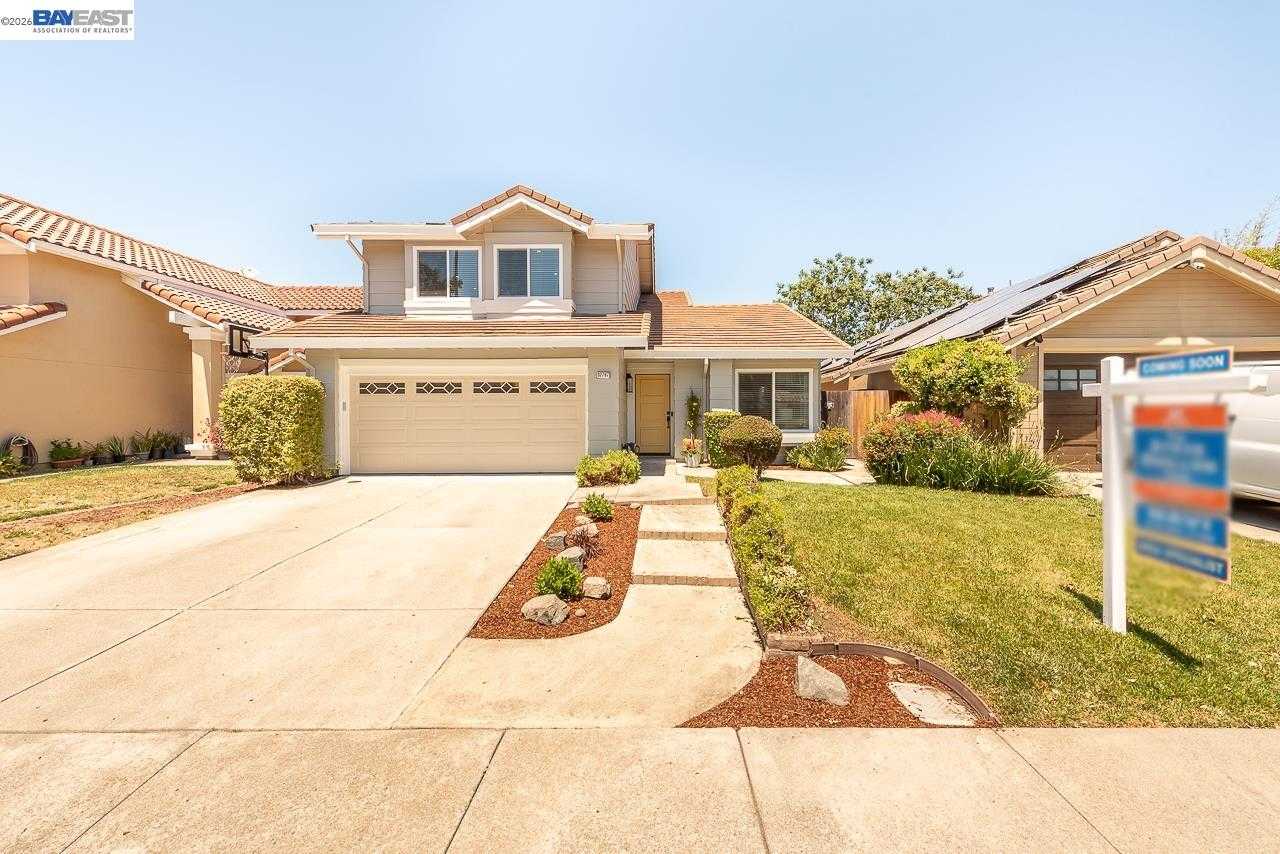
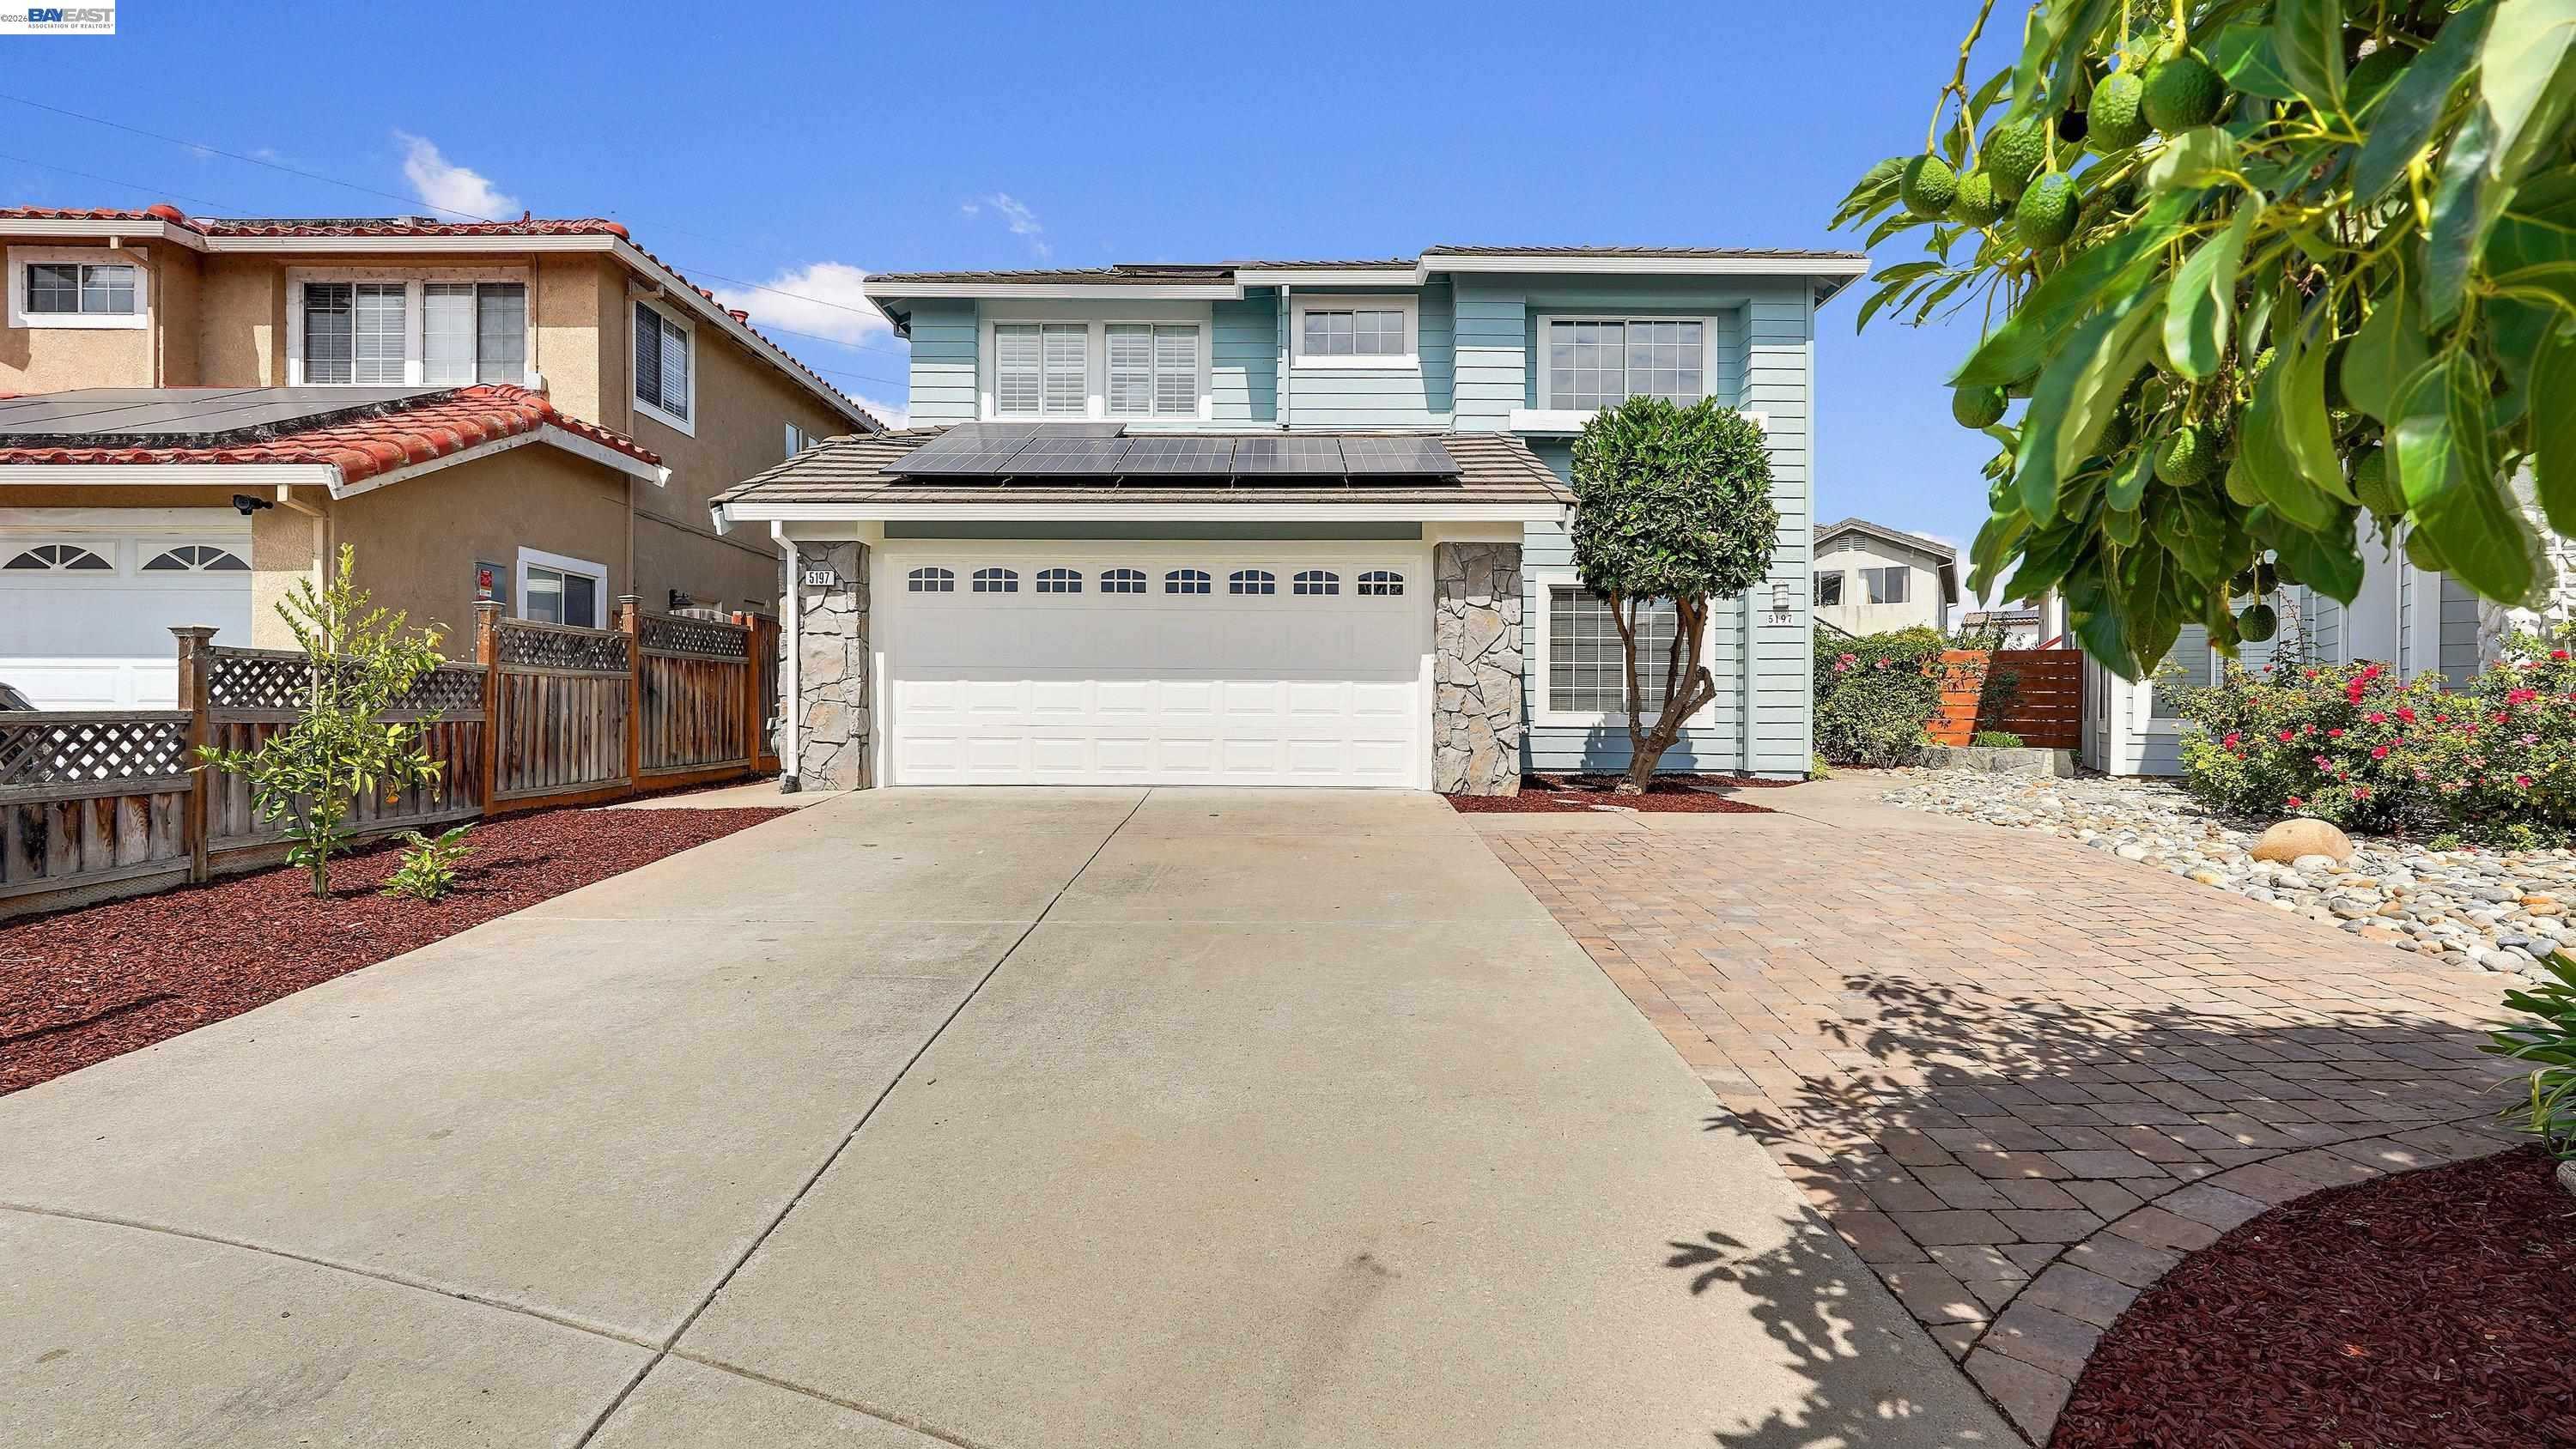
Behind these county totals: hundreds of homes still for sale in Fremont, Hayward, Union City, Newark and Milpitas, counted, priced and sorted every morning from the same MLS export, with a map search for the homes themselves.
30-Year Fixed: 7.20% +0.01 | 15-Year Fixed: 6.83% +0.02
Rates finished the week where they started. Mortgage News Daily had the 30-year at 7.20% and the 15-year at 6.83% as of Friday, September 18, and nothing reprices over a weekend. The 10-Year Treasury closed Friday at 5.01%, the highest a 10-Year has been since July 2007.
So let us talk about inventory instead. I pulled twenty months of it for Fremont, Newark and Union City, and the three cities are not telling the same story at all.
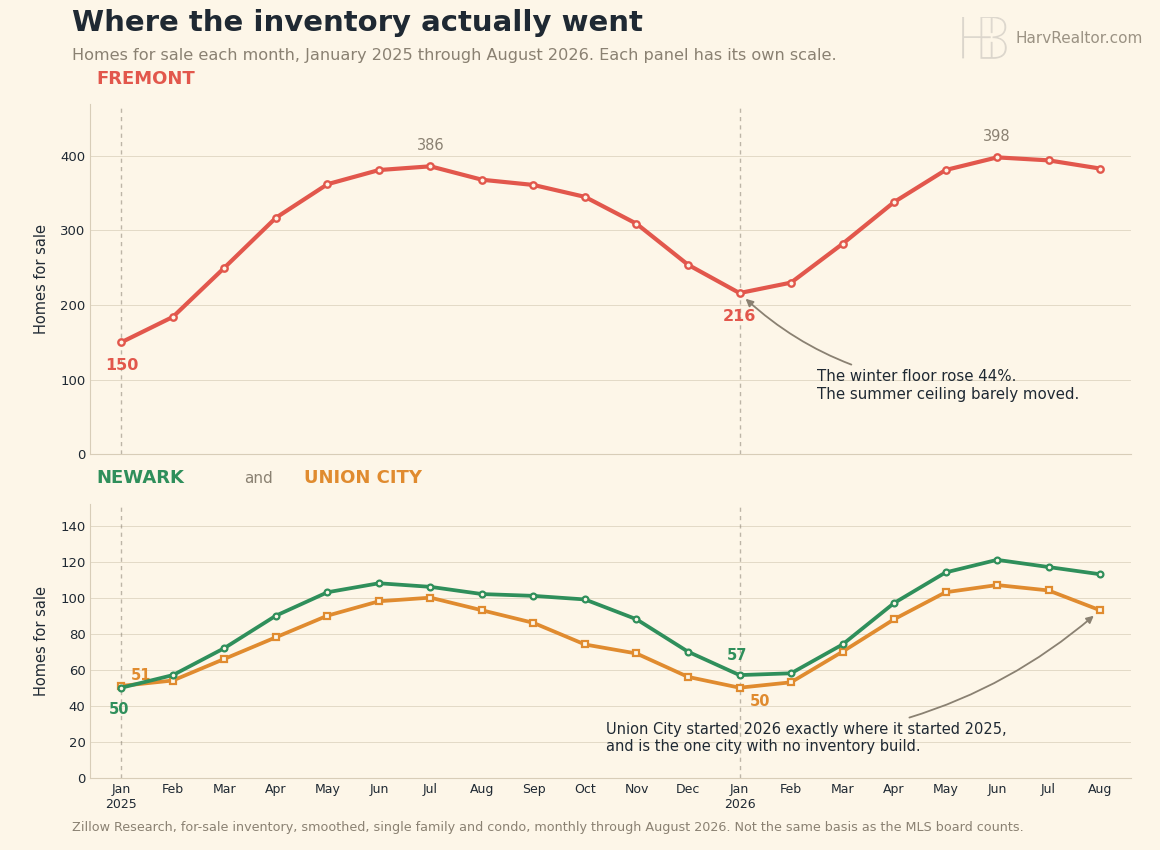
Look at the floor, not the peak. Inventory drains every winter and rebuilds every spring, so the summer peak is the number everyone quotes and the January trough is the number that tells you what actually carried over. Fremont started 2025 with 150 homes for sale and started 2026 with 216, a 44% higher floor, while its summer peak moved only from 386 to 398. Newark went from 50 to 57. Union City went from 51 to 50, which is to say it did not build at all.
Here is the part that surprised me. Across the three cities, 1,699 new listings came to market from January through August this year against 1,708 over the same eight months last year. That is a difference of half a percent. The faucet is running at exactly the rate it always has.
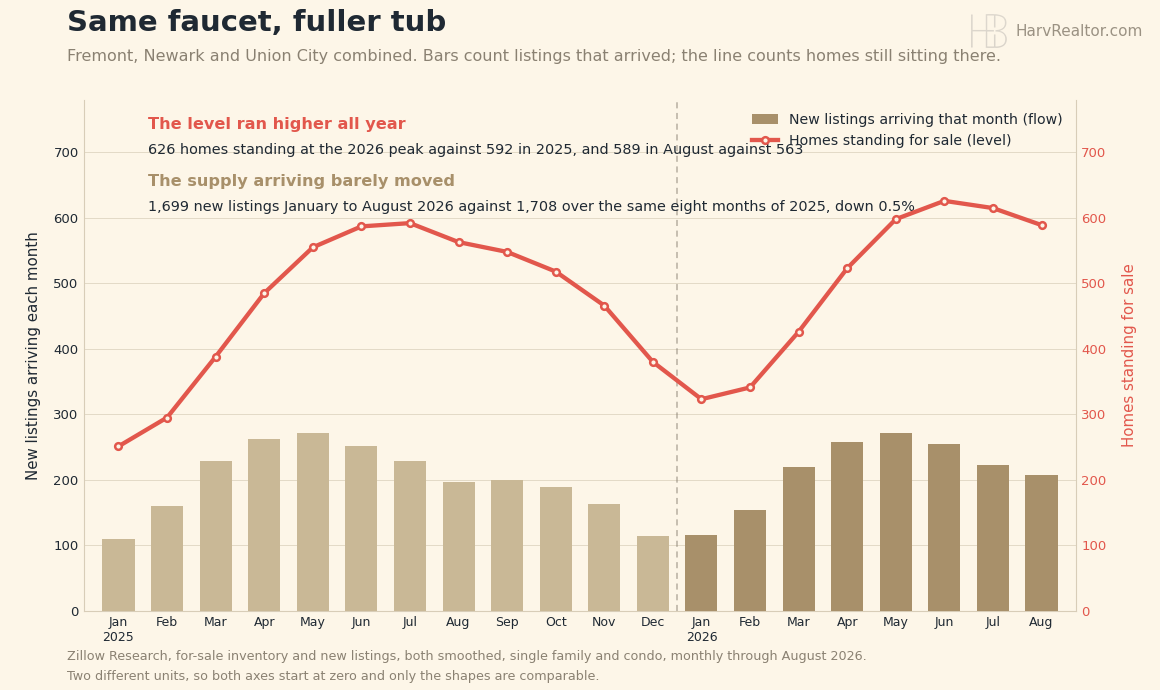
What changed is the drain, not the faucet. The extra inventory in Fremont is not a wave of new sellers arriving. It is the same number of sellers, with their homes staying on the market longer. Union City is the one city of the three that cleared what arrived, and today its typical listing has been out 24 days against Fremont's 30.
The local math. At Fremont's median list price of $1,200,000, a 20% down loan is $960,000, under Alameda County's $1,249,125 high-balance conforming limit. At 7.20%, principal and interest run about $6,516 a month, and every eighth of a point is about $81.
Today's count. Board wide: 2,768 listings across the 15 city table, counting active and in contract together, with 190 coming soon and 237 brand new. The five city ledger carries 716 live listings across Fremont, Hayward, Milpitas, Newark and Union City, 632 already on the market and 84 coming soon.
Fremont holds 255 live listings, 201 active, 36 coming soon and 18 brand new, with a median on market list price of $1,200,000 at $794 a square foot and a typical listing out 30 days. Newark holds 91 live and 79 on the market, median $1,198,000 at $685 a square foot, typical listing out 24 days, with only 12 homes sitting 60 days or longer. Union City holds 68 live and 61 on the market, median $1,250,000 at $767 a square foot, typical listing out 24 days: the highest median of the three on the smallest inventory. Hayward carries 187 and Milpitas 115.
What it means if you are selling this fall. In Fremont you are not competing with more sellers, you are competing with sellers who have already been out a while and are getting tired. That is a pricing conversation, not a timing one. In Newark and Union City the standing inventory is genuinely thinner, so a well priced home still gets its weekend. Either way, price to the 7.2% your buyer is actually quoted, not to the rate anybody hoped for back in June.
S&P 500: 7,650.50 +0.17% | Dow: 51,682.64 -0.18% | Nasdaq: 26,522.54 +0.39%
All three indexes finished Friday within a quarter percent of flat, which is about as quiet as a week ends. The Nasdaq took the only real gain, the Dow the only loss.
These are Friday's closing levels. Saturday and Sunday do not produce new ones, so the next genuine print is Monday's open.
10-Year Treasury: 5.01% +0.07 | Gold: $4,424.90 +1.01% | Silver: $67.15 +2.19% | Brent Crude: $103.87 -0.91%
The 10-Year is the number that matters here. It closed Friday at 5.01%, the highest close since July 19, 2007, which I checked against the Treasury's own daily yield curve rather than taking a newsletter's word for it. Your 30-year mortgage is priced off this, not off the Fed.
Oil eased. Brent's front month settled Friday at $103.87, down 0.91% on the day. Gold and silver went the other way, with silver the stronger of the two at $67.15.
Correction: an earlier version of this post showed Brent at $99.29, down 5.28%. That figure was the December contract, not the front month contract we report.
A note on gold, since the weekend newsletters are full of it. One of them put gold "near $4,350" this morning; it actually settled Friday at $4,424.90. The same piece called $5,600 a January record, which is an intraday tick from January 29 rather than a close. Gold's record close is $5,318.40 from that same day, still a long way above where it sits now.
Bitcoin: $81,325 -0.17% | Ethereum: $2,630.94 -0.47% | XRP: $1.40 -1.38%
Crypto is the one market that actually trades on a Sunday, and it drifted down. All three are off slightly over the past 24 hours, XRP the weakest of them.
These quotes are live as of this morning, so unlike the stock and metals numbers above, they are genuinely today's.
Sources
- Mortgage News Daily (30 and 15 year fixed, as of September 18)
- U.S. Treasury (10-Year daily yield curve, September 18)
- Yahoo Finance (index, metals and Brent closes, September 18)
- CoinGecko (live crypto, morning of September 20)
- Zillow Research (city for-sale inventory and new listings, smoothed, single family and condo, monthly through August 2026)
- REALTY EXPERTS® Live Inventory (five city ledger, September 20)
Disclaimer: The market data, rates, and information provided are for informational purposes only and should not be considered financial advice. Always verify rates and data with your lender or financial advisor before making any decisions.