



"At a Glance" Local Housing STATS and News 09/10/26
September 10, 2026 · Alameda County Market Dashboard
TODAY'S LIVE INVENTORY
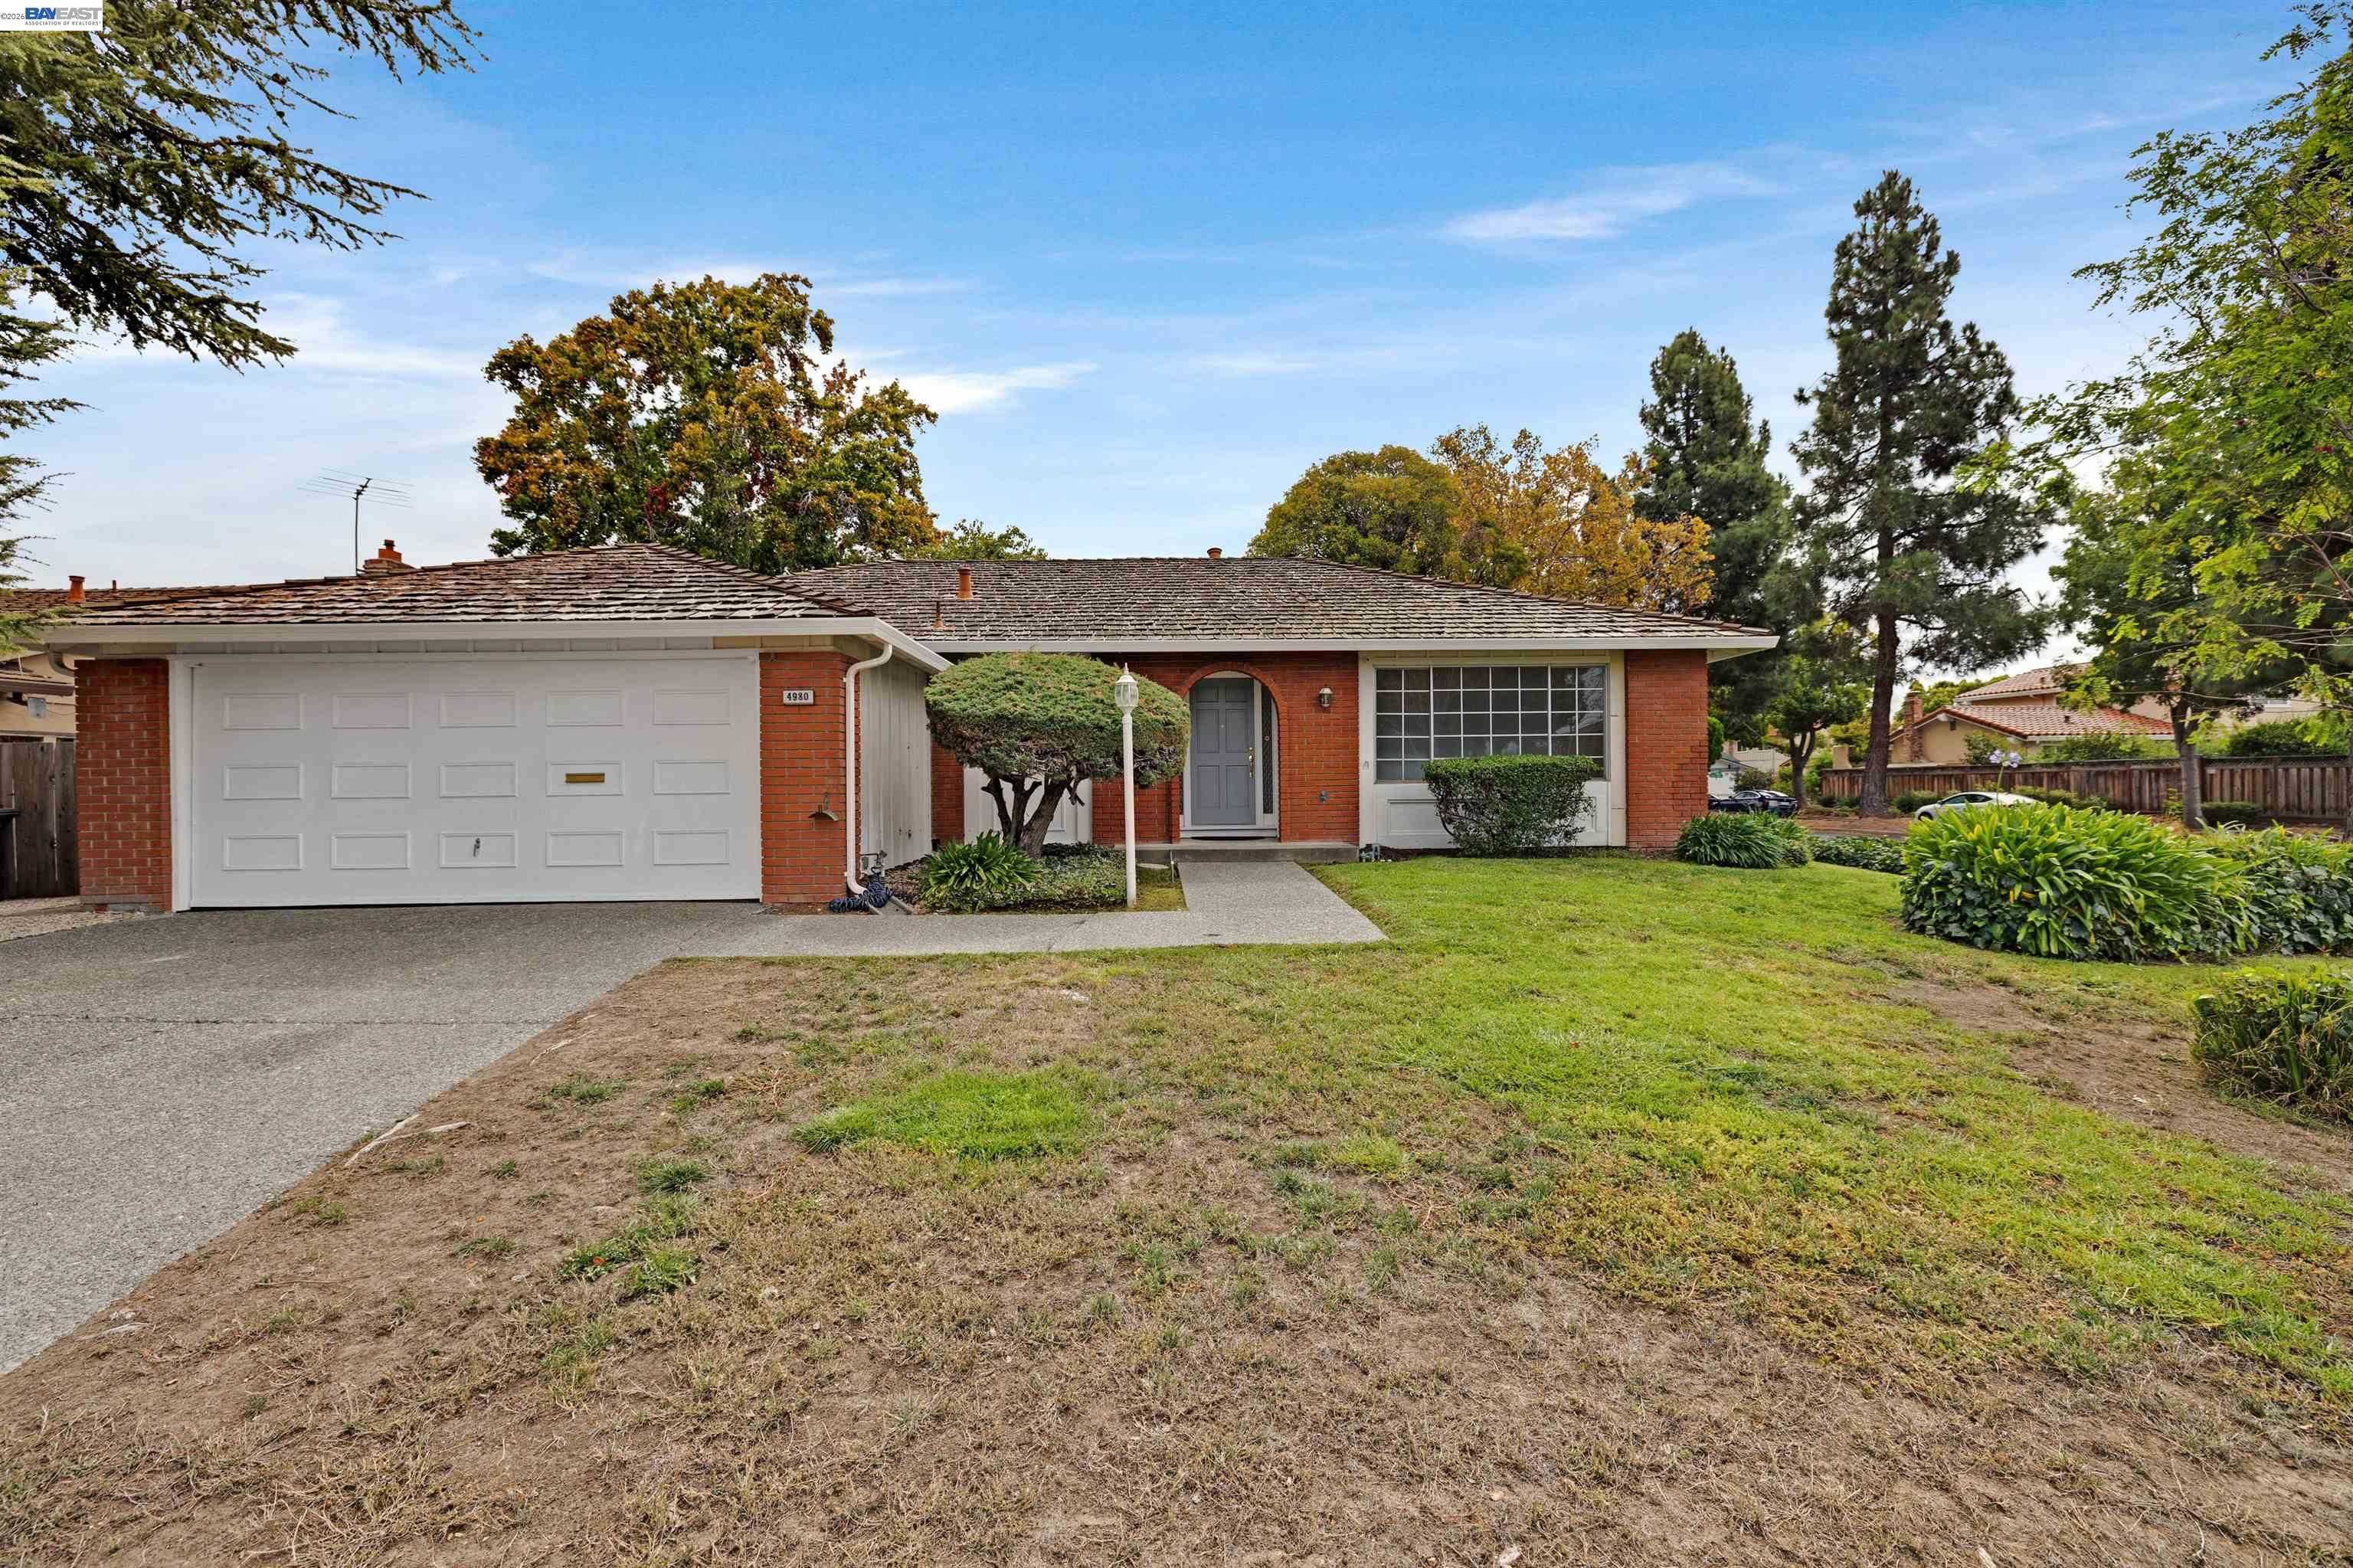
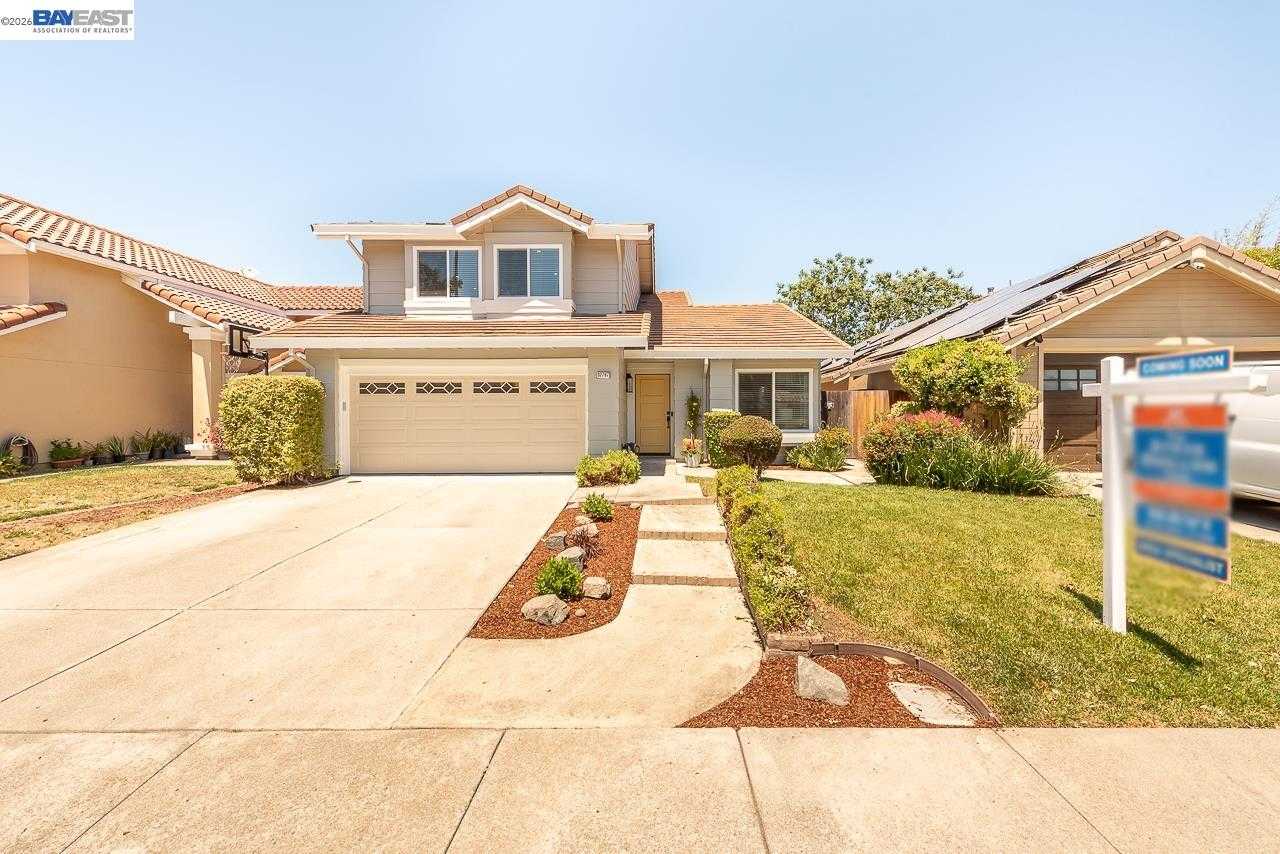
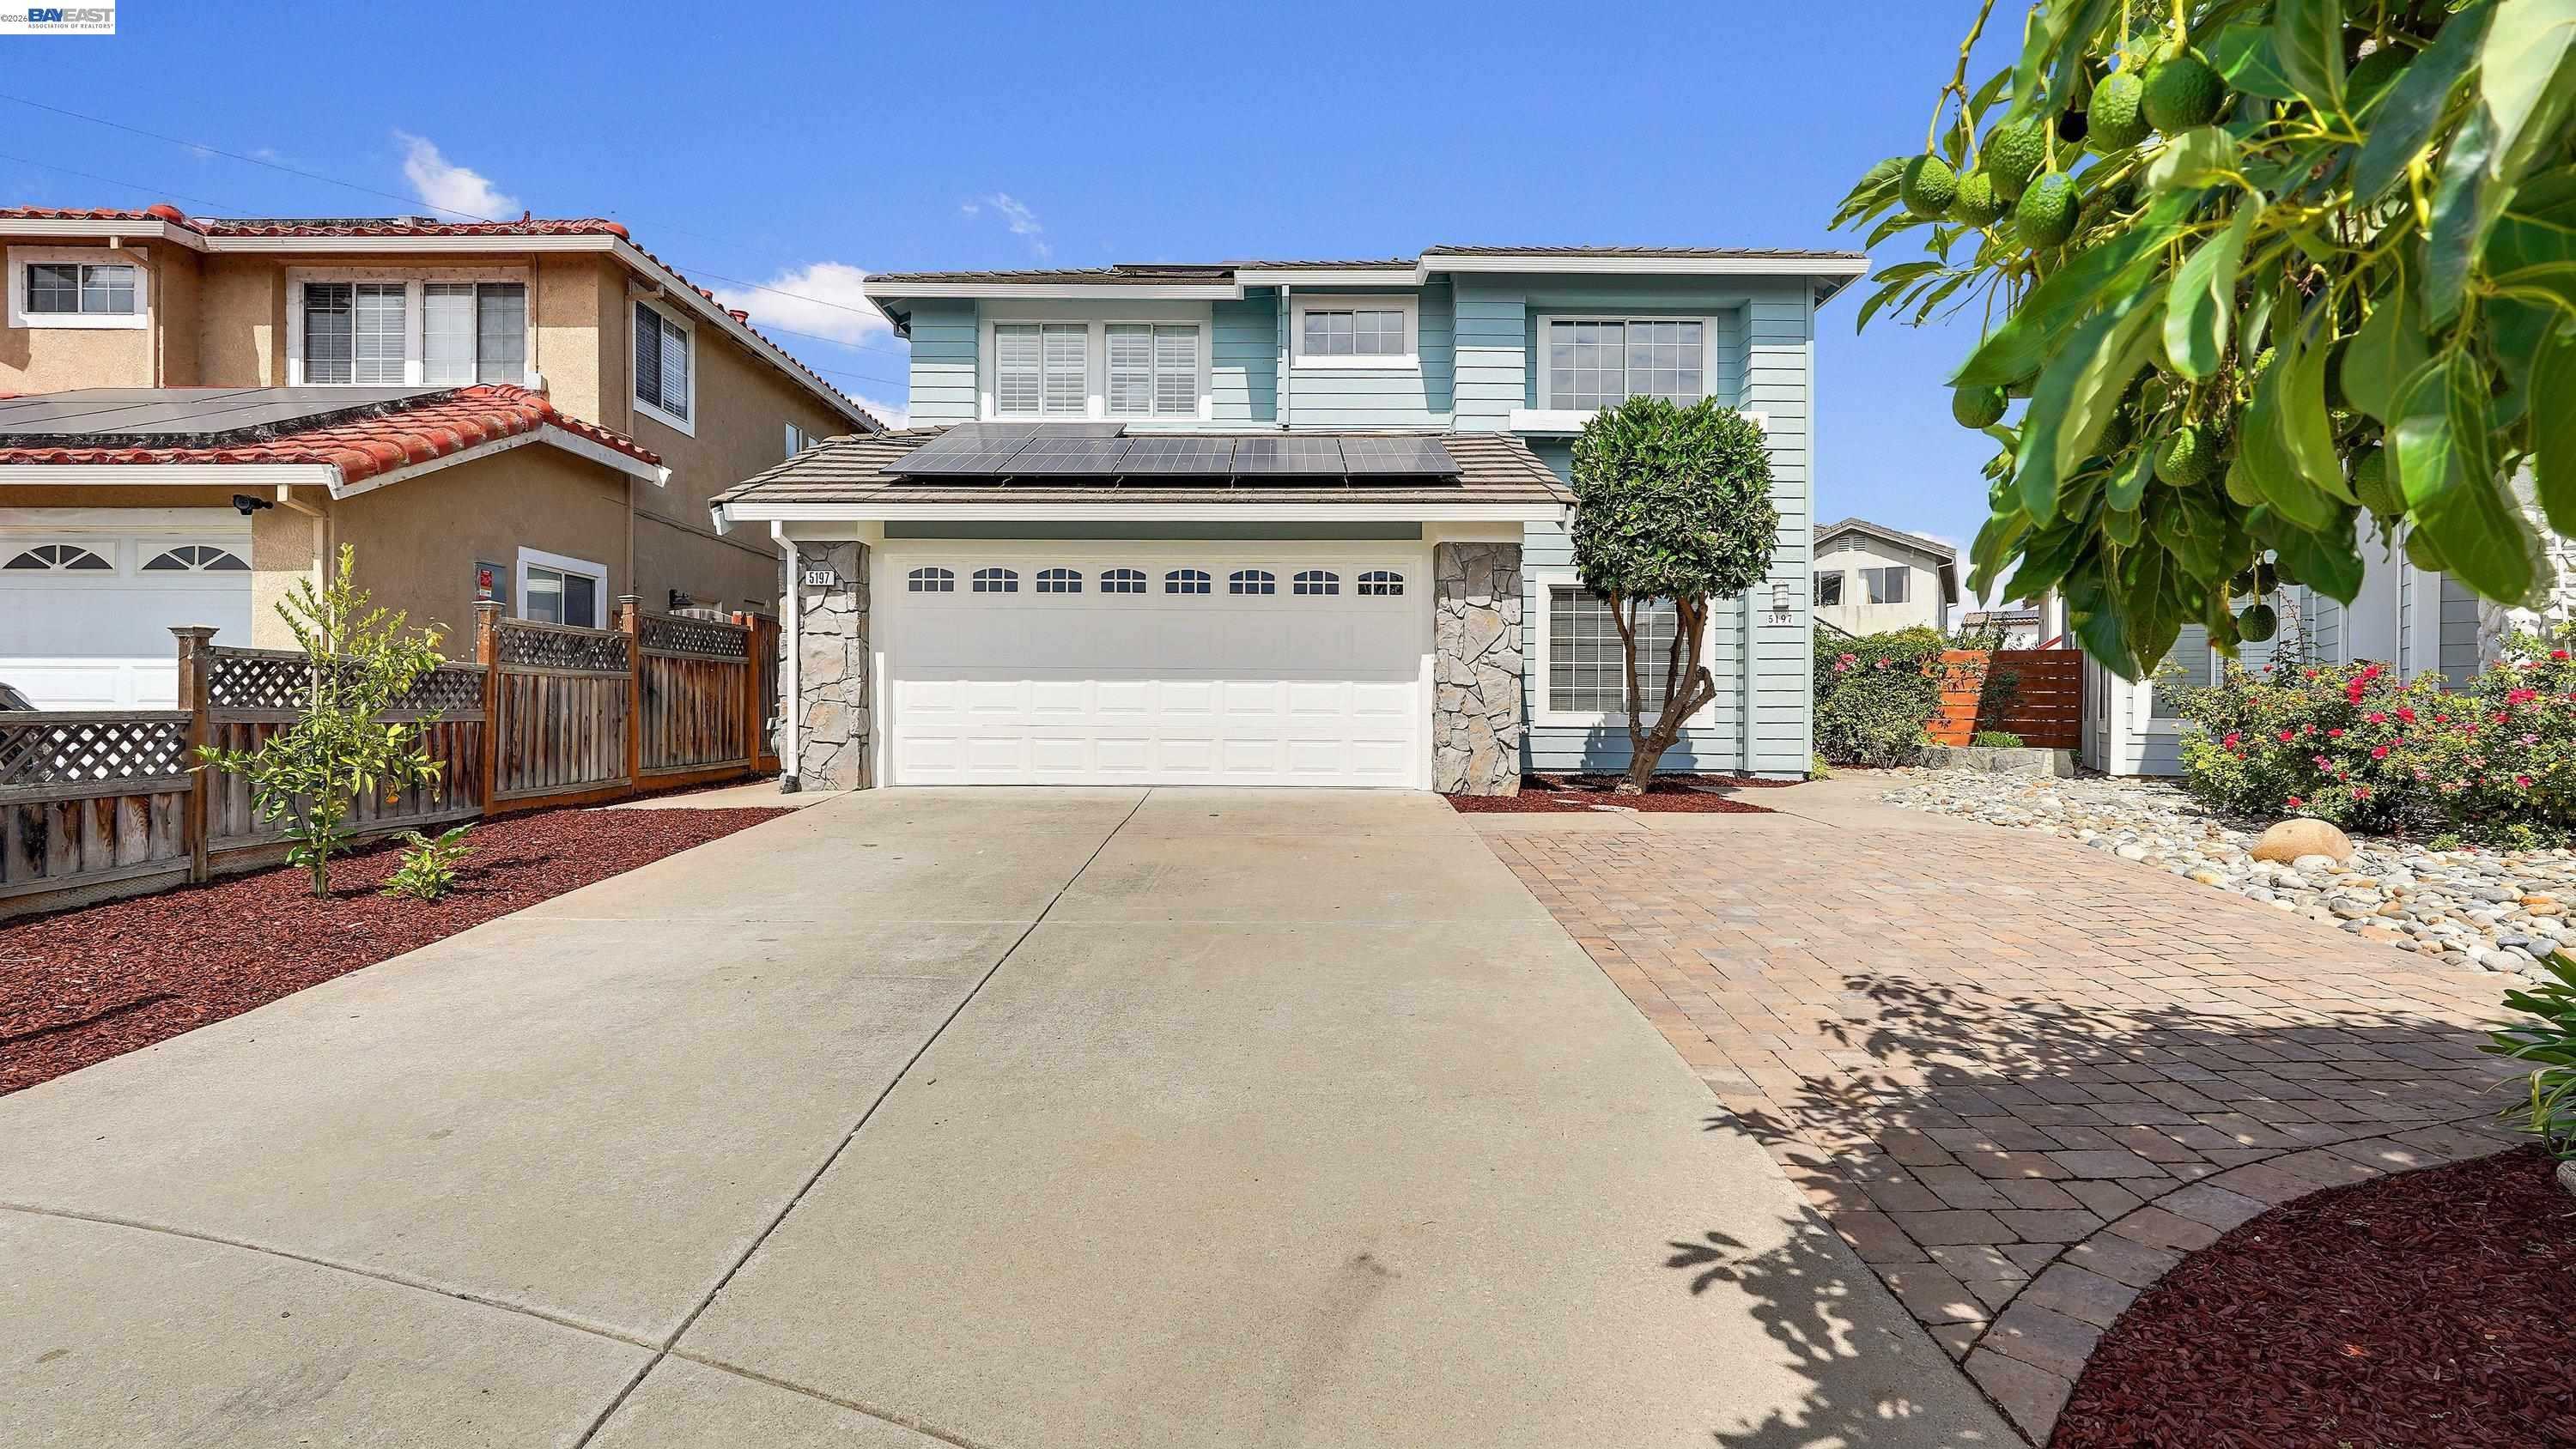
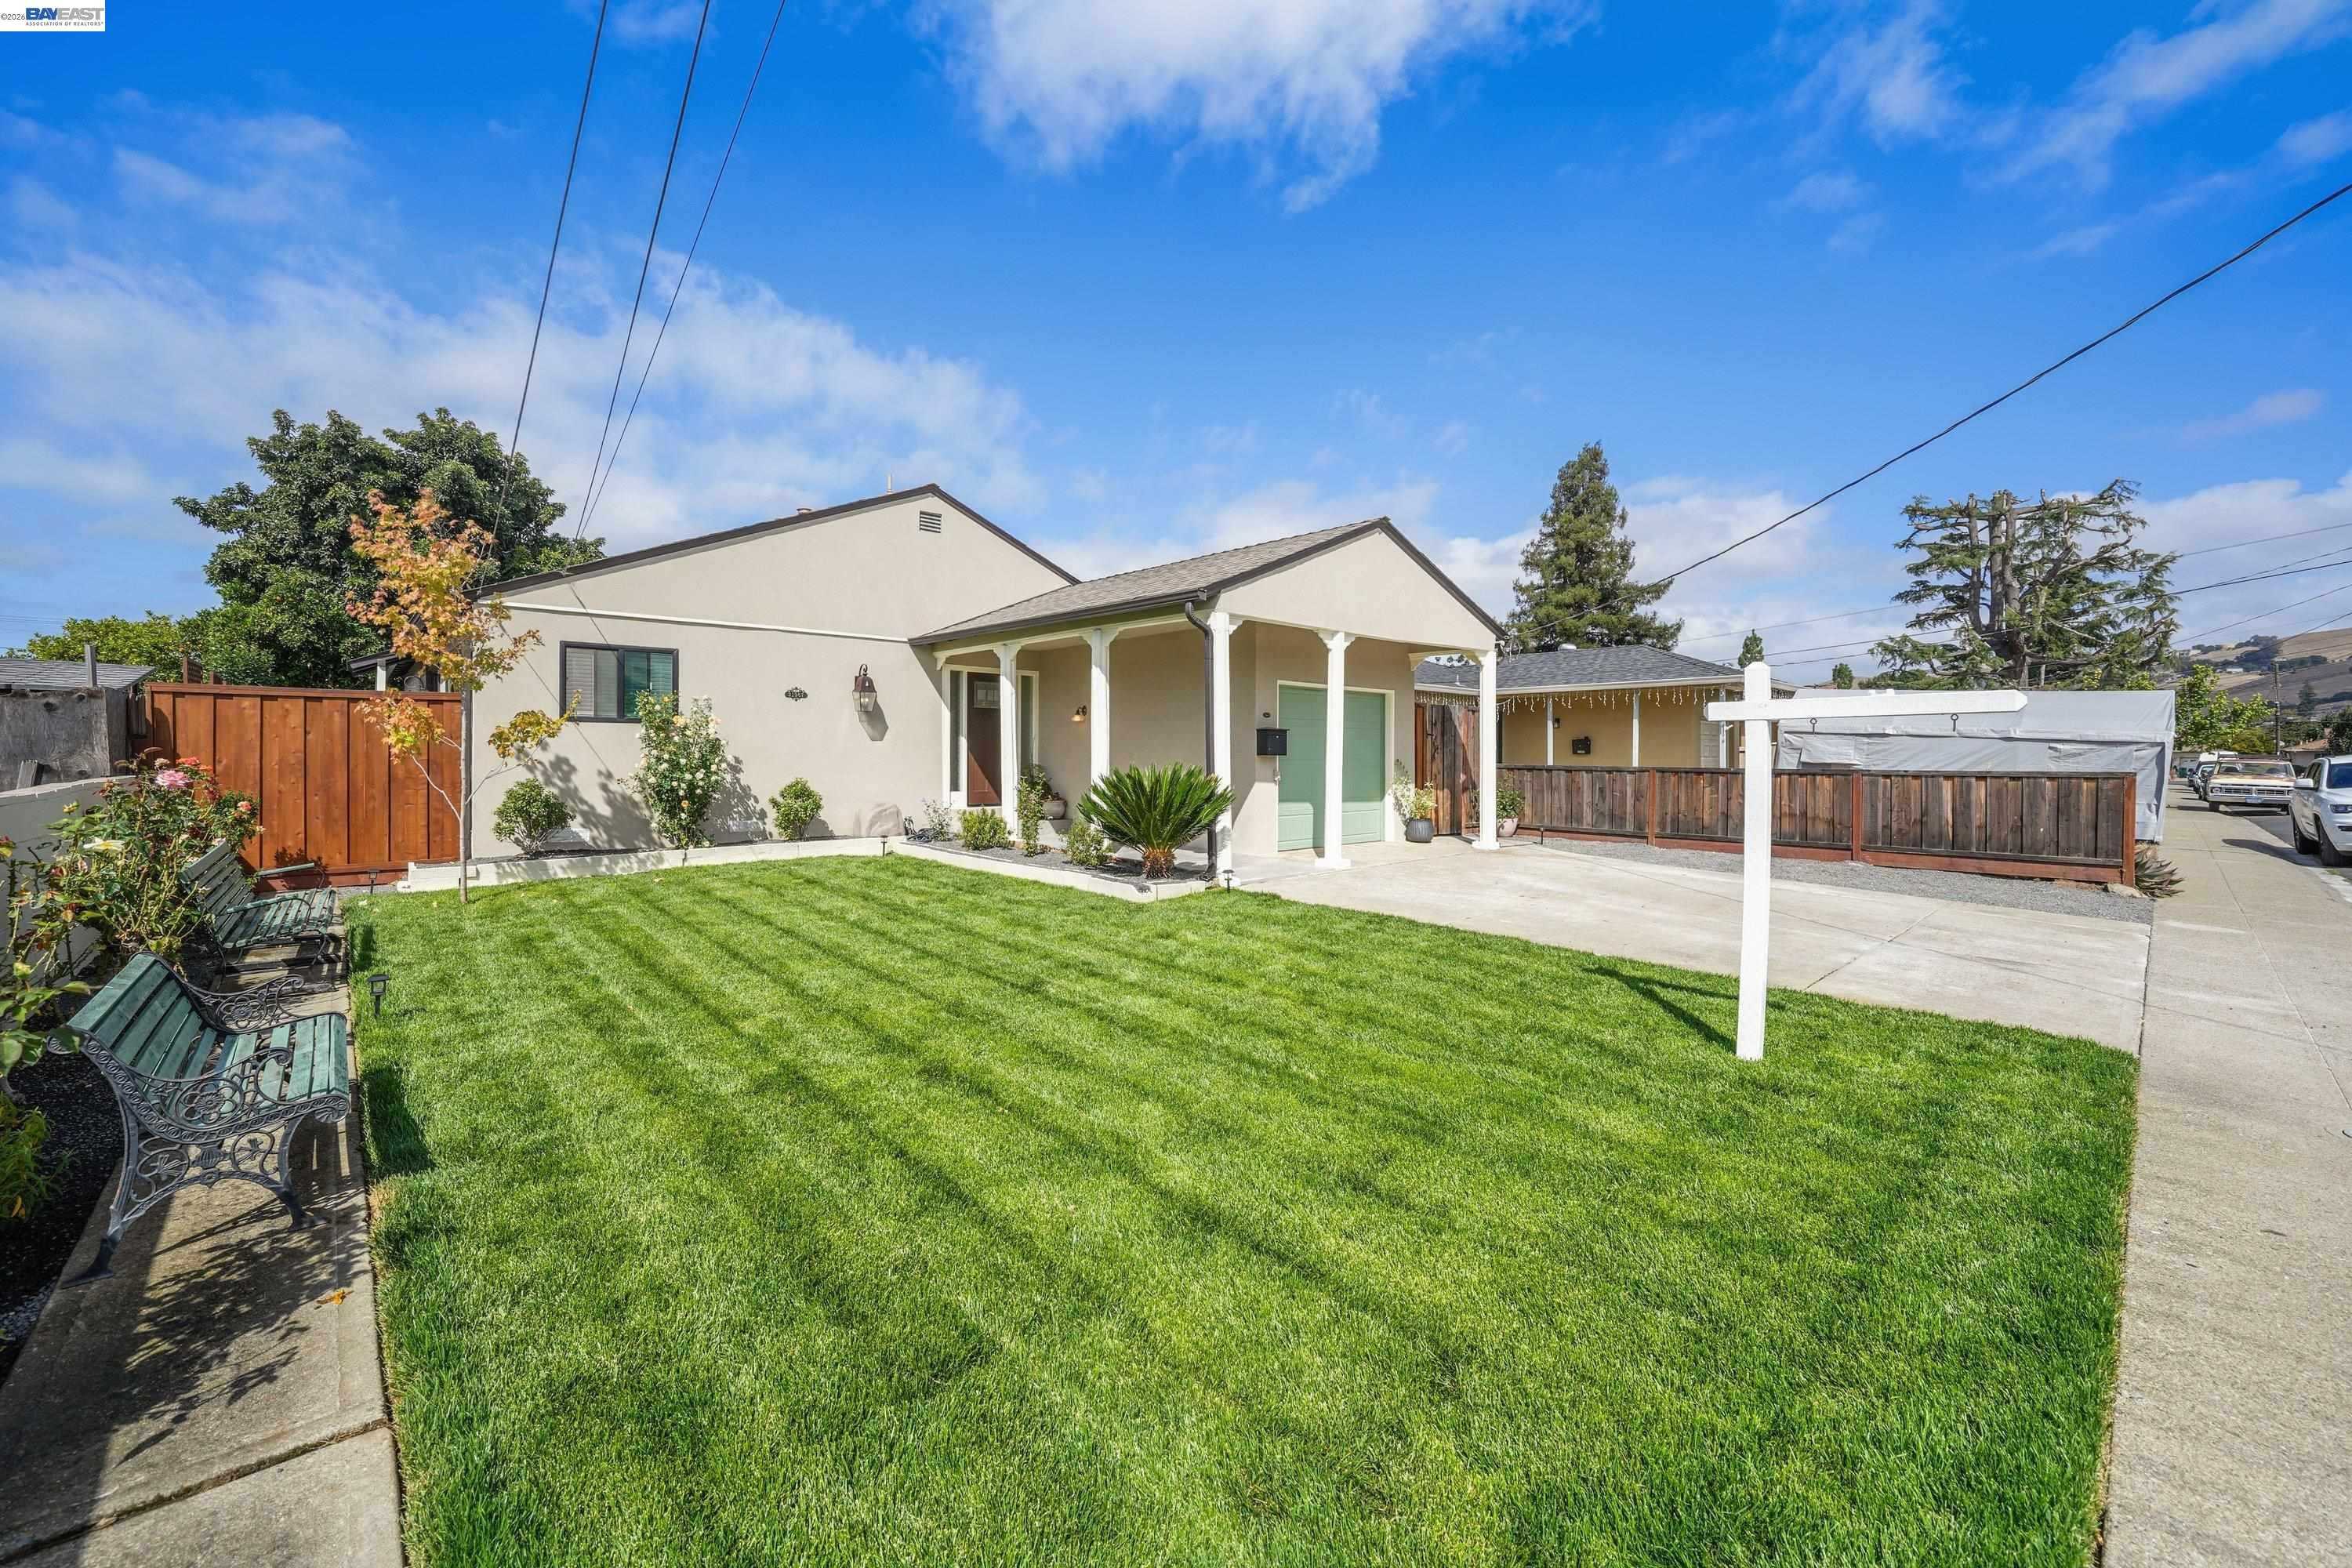
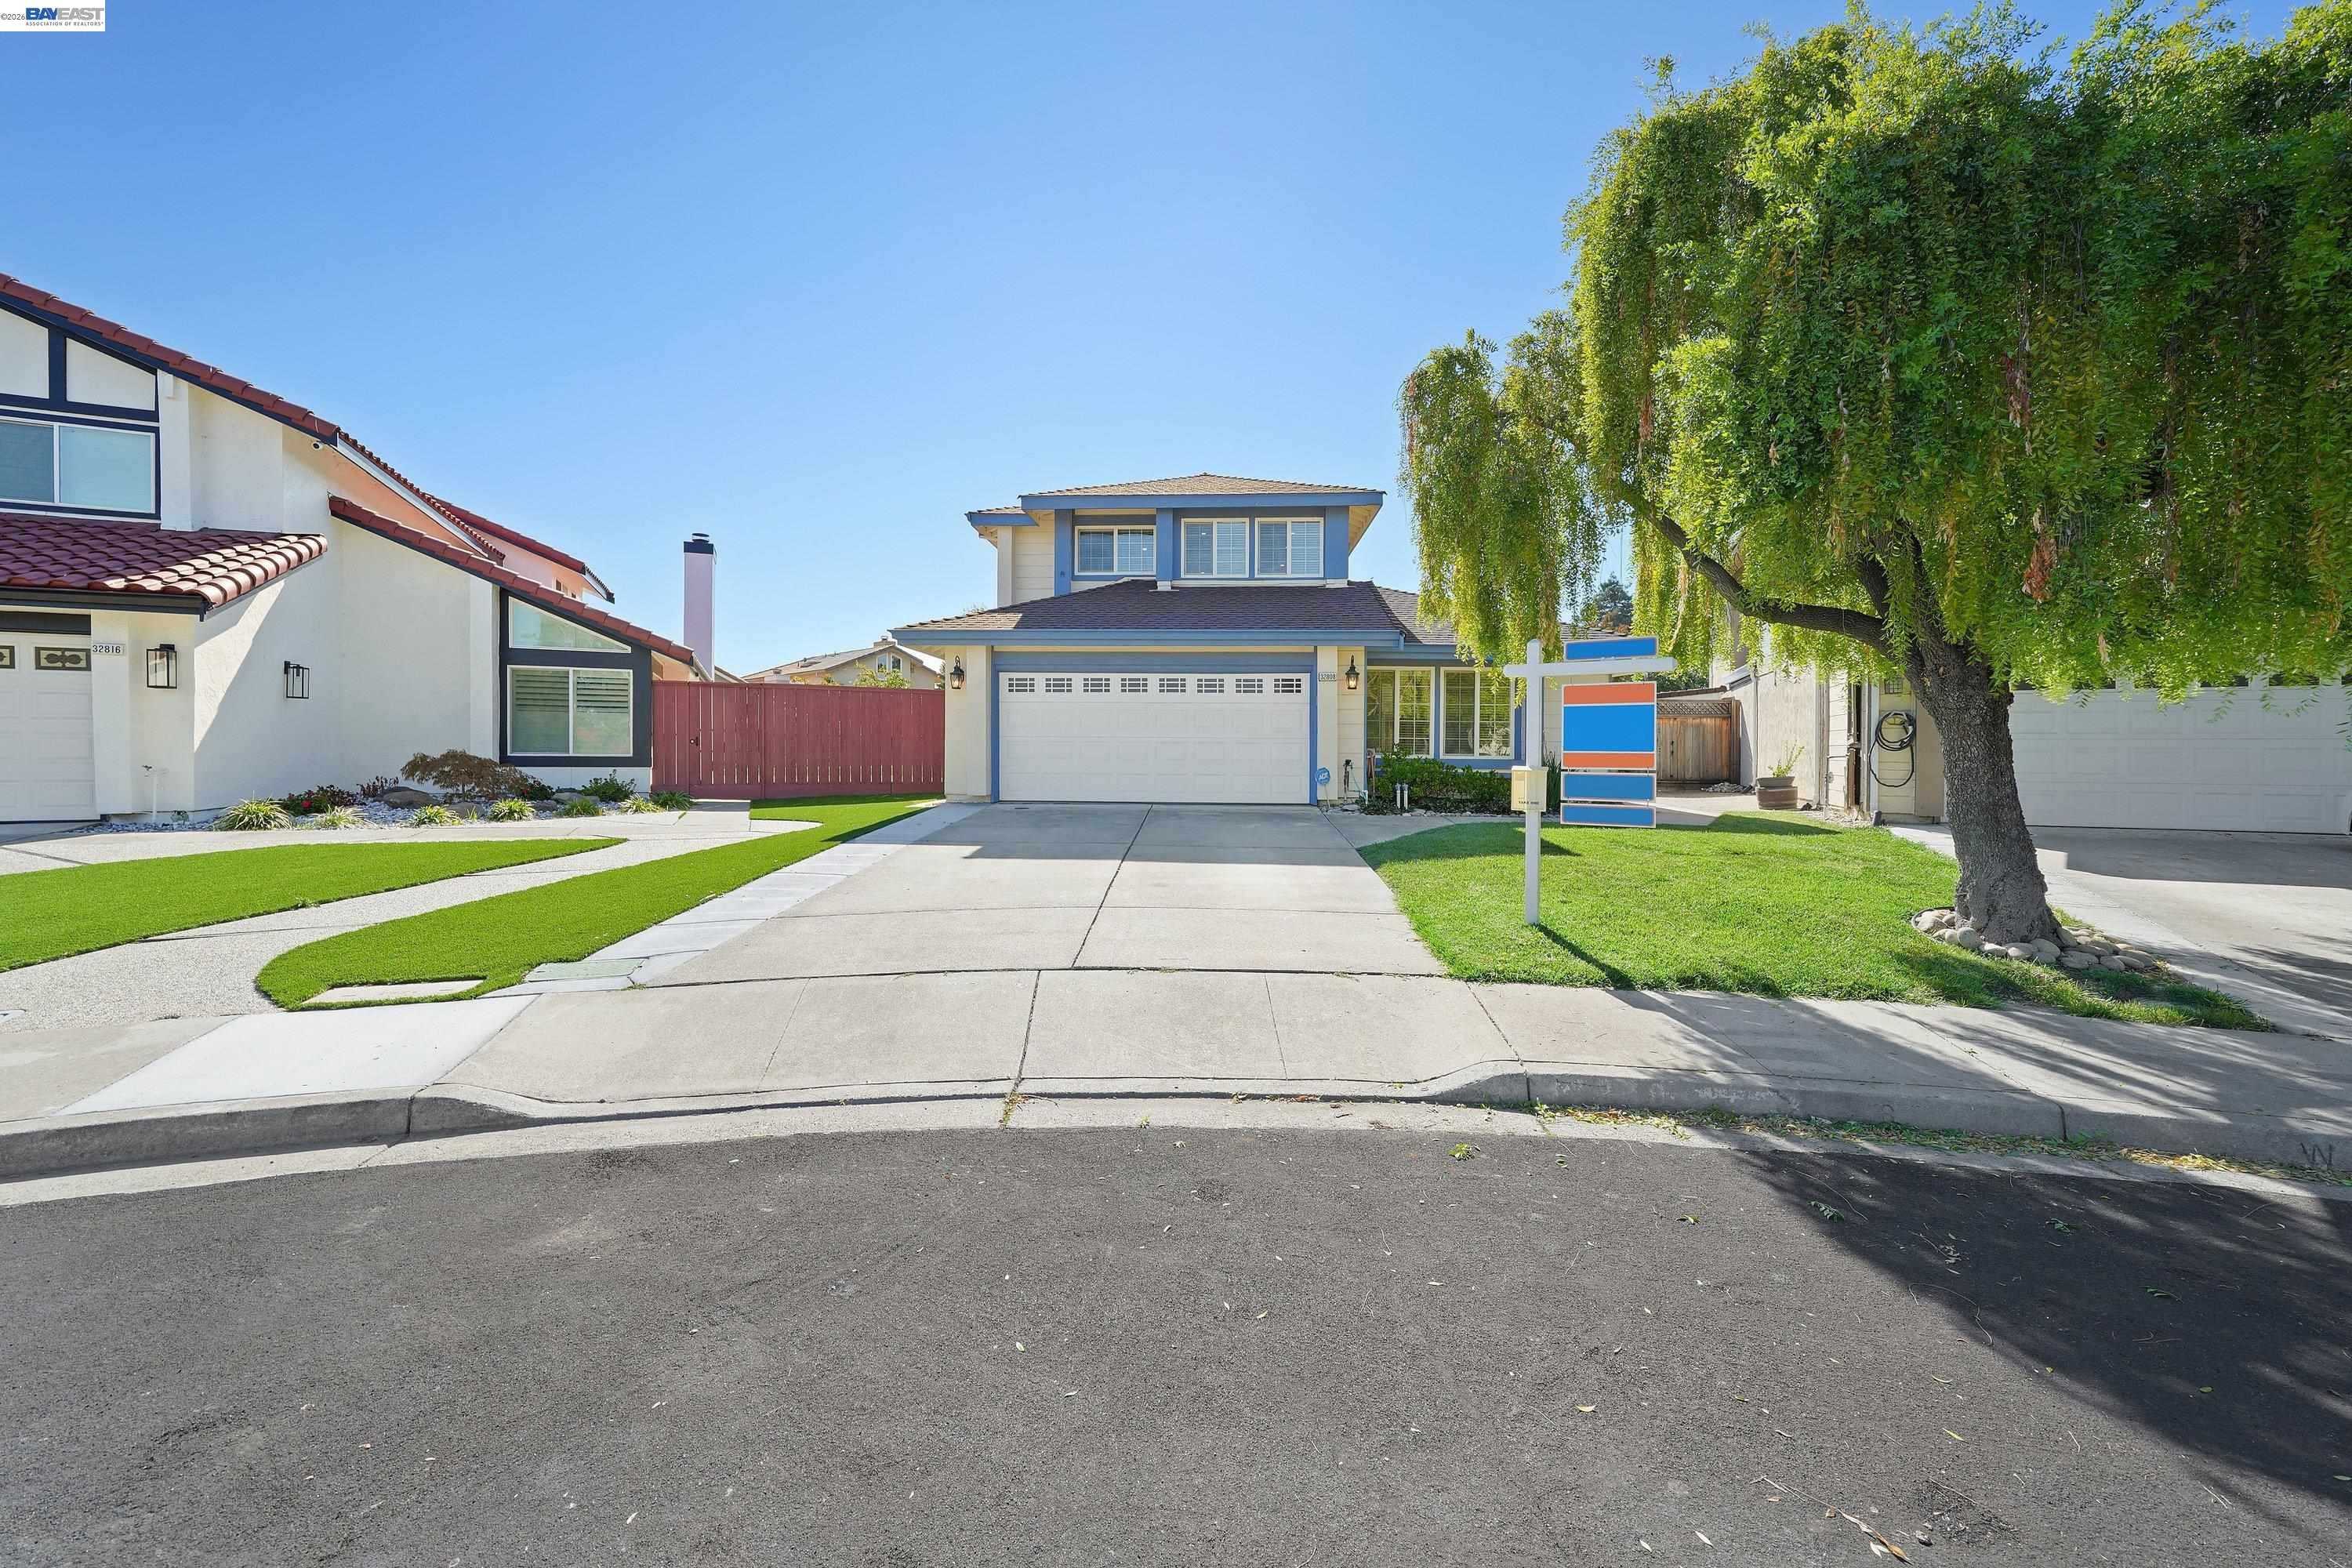
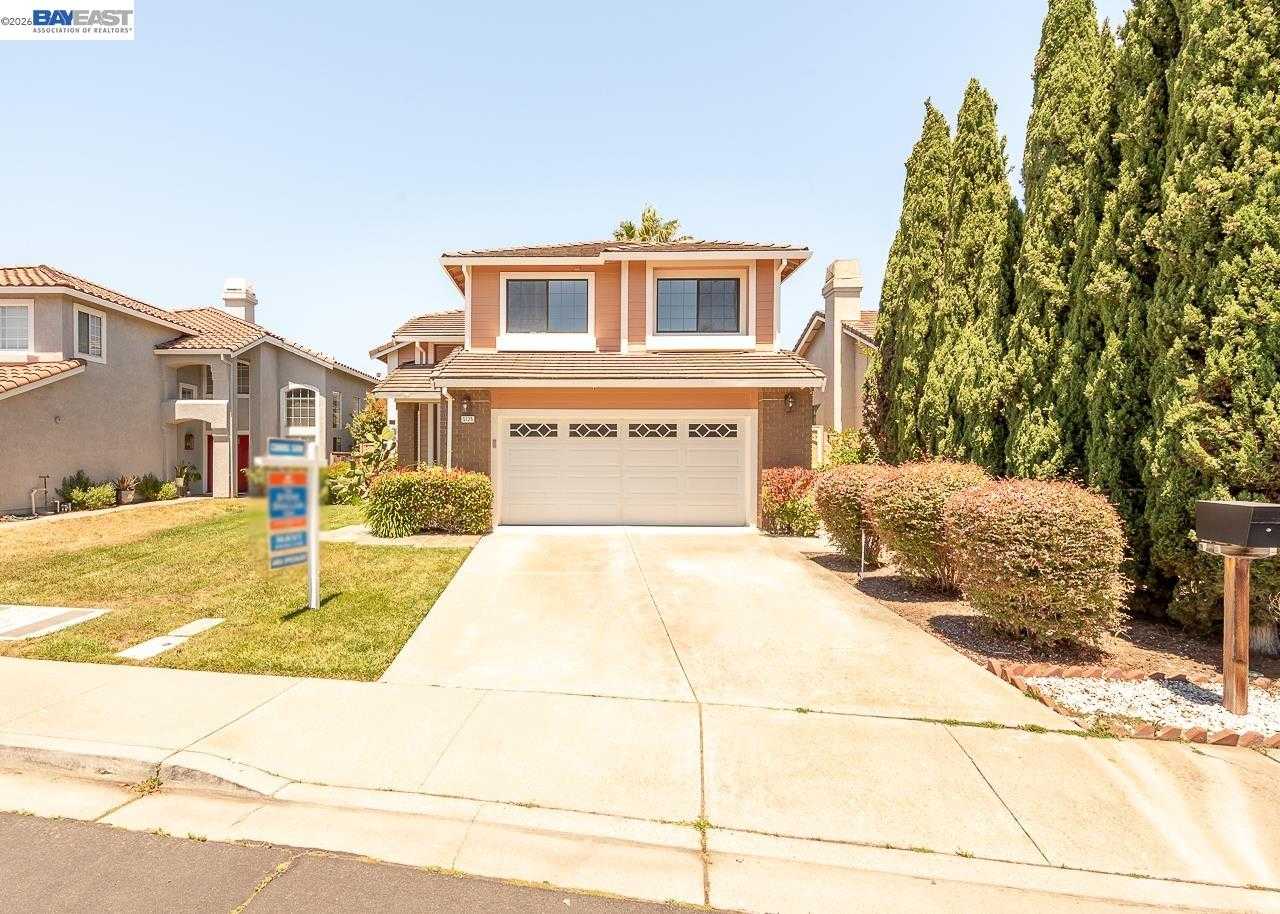
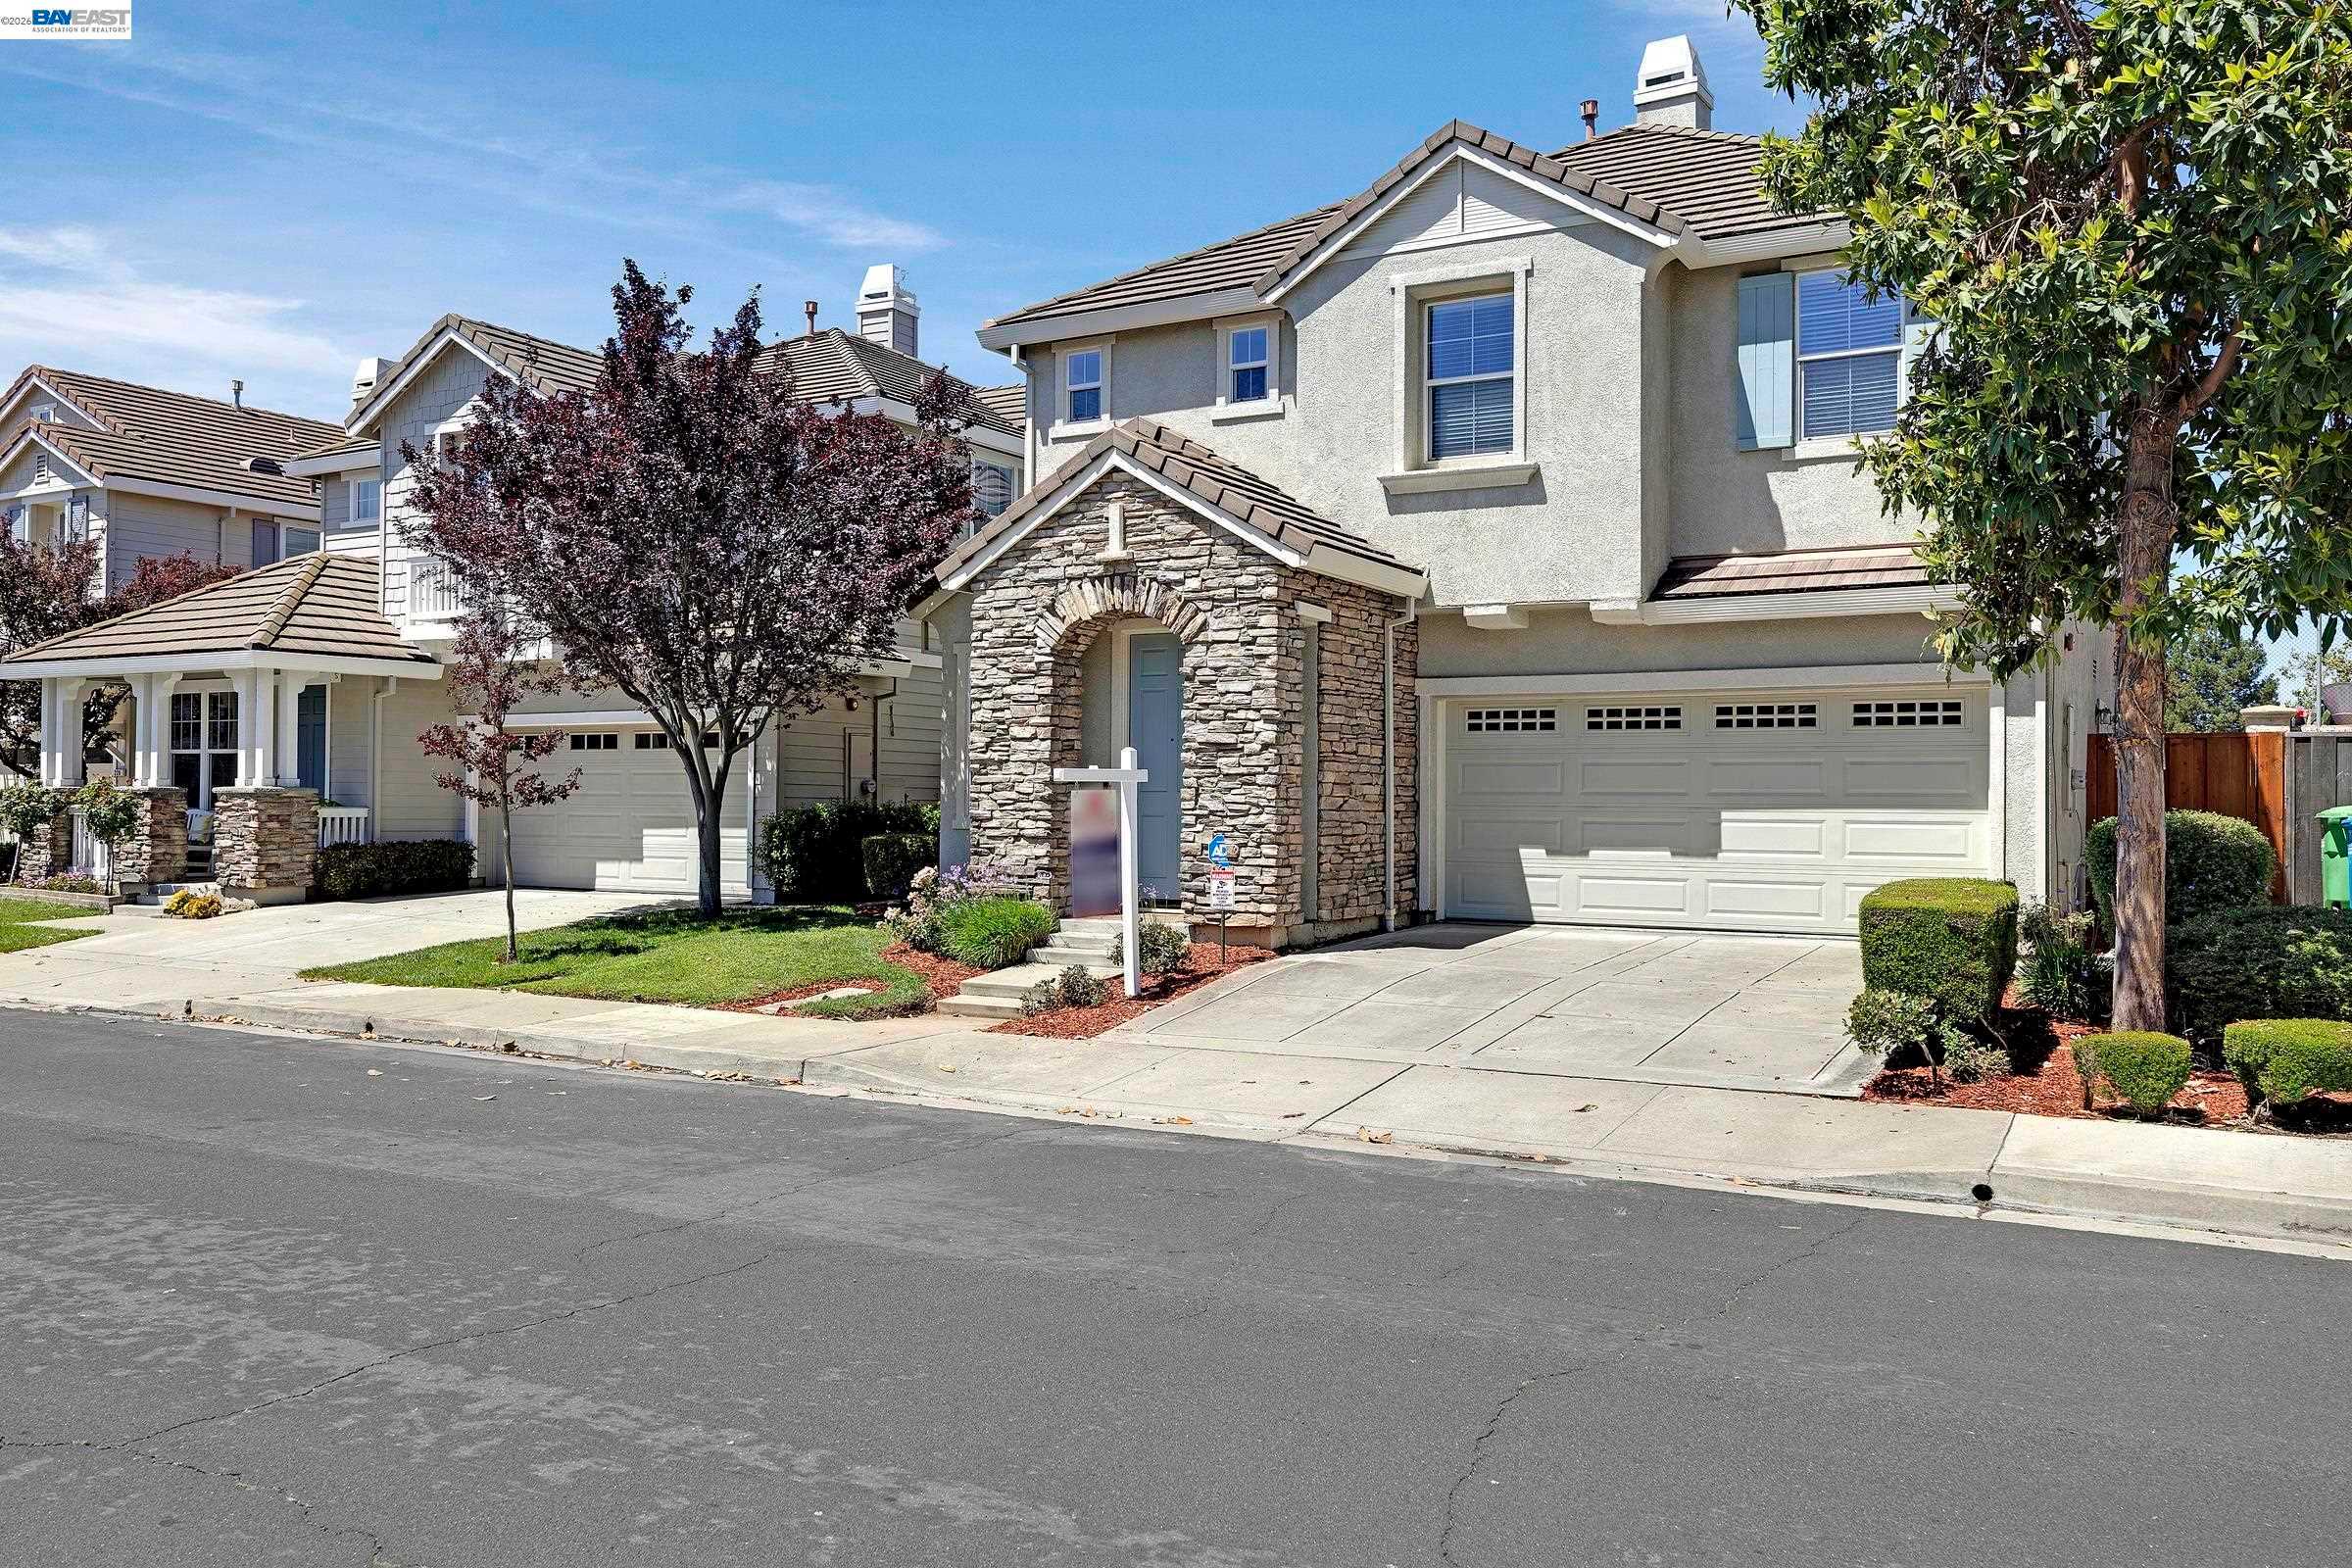
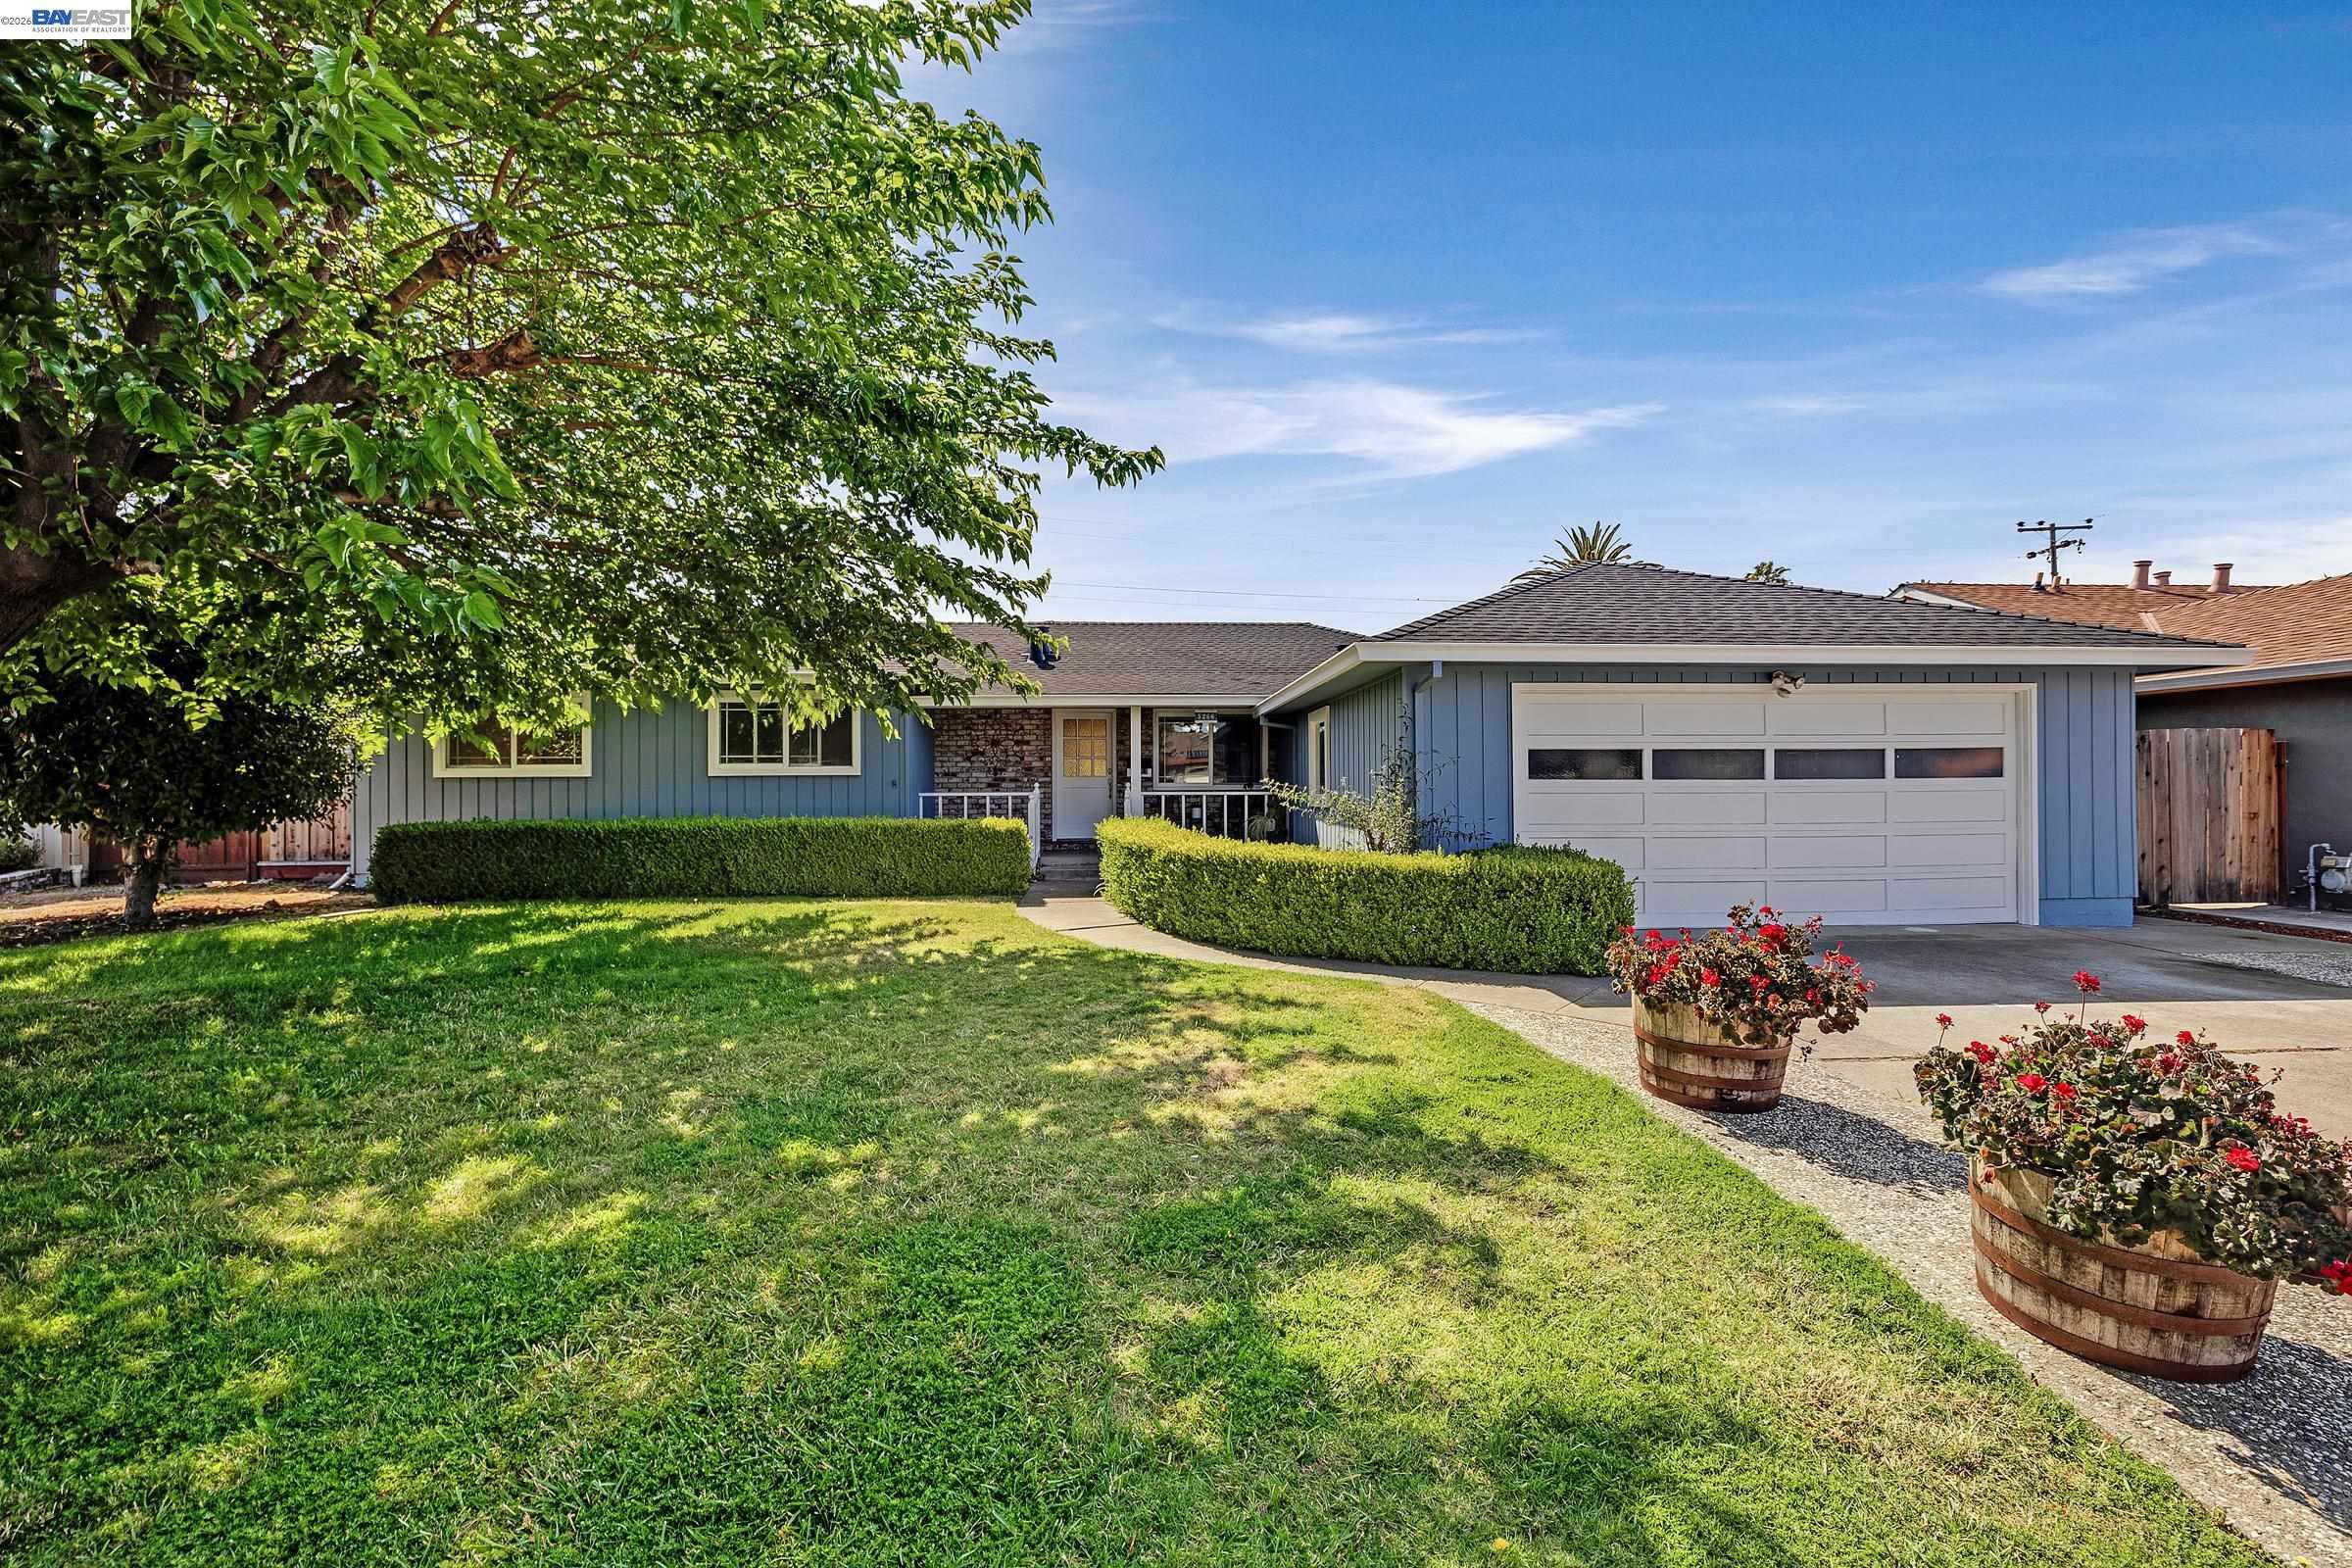
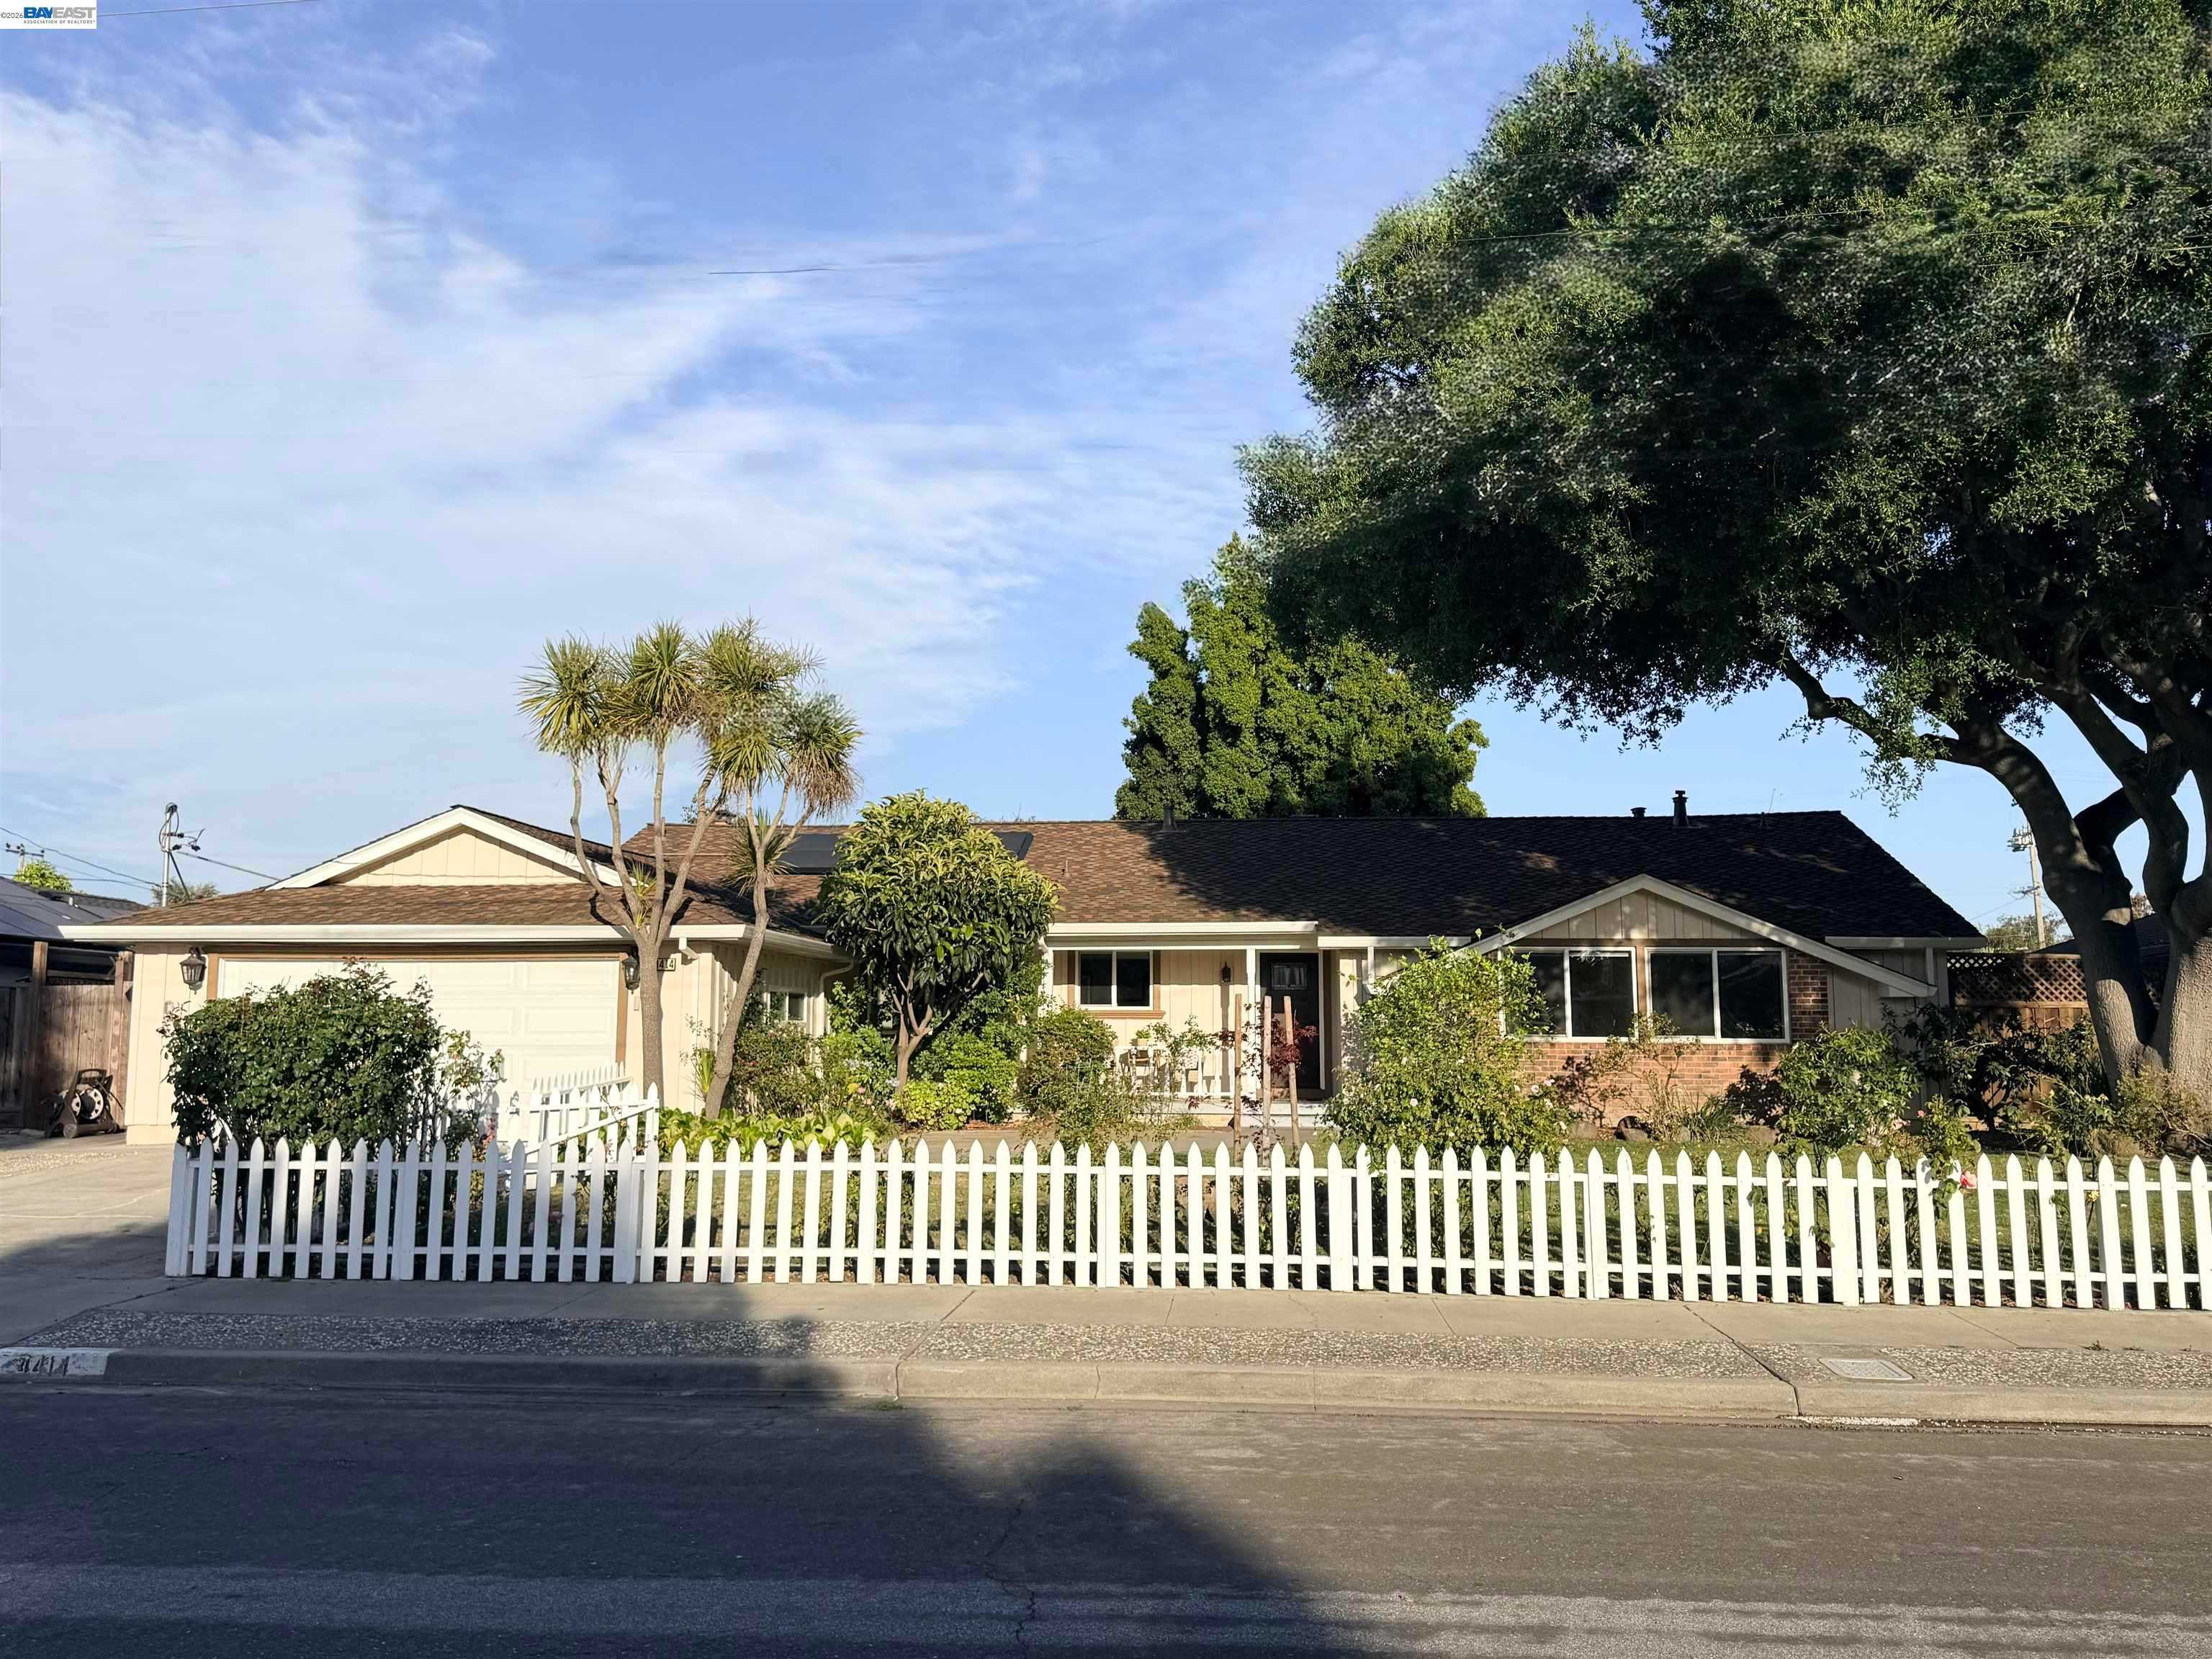
Behind these county totals: hundreds of homes still for sale in Fremont, Hayward, Union City, Newark and Milpitas, counted, priced and sorted every morning from the same MLS export, with a map search for the homes themselves.
30-Year Fixed: 7.07% +0.10 | 15-Year Fixed: 6.62% +0.08
Rates just crossed 7%. Mortgage News Daily has the 30-year at 7.07% and the 15-year at 6.62% today, up from 6.89% and 6.49% on Tuesday: 0.18 of a point in two sessions and the highest 30-year reading on that index in at least a year. Oil is the likely culprit. Brent closed above $100 on Wednesday, the 10-Year rose to 4.83%, and mortgage rates track the 10-Year.
Which is why ARMs are having a moment. In the Mortgage Bankers Association’s survey for the week ending September 4, the 5/1 ARM averaged 5.82% against 6.85% for the 30-year fixed, a gap of 1.03 points, and ARMs rose to 8.5% of applications, the highest share since June. All three rates in the version circulating today check out against MBA’s release.
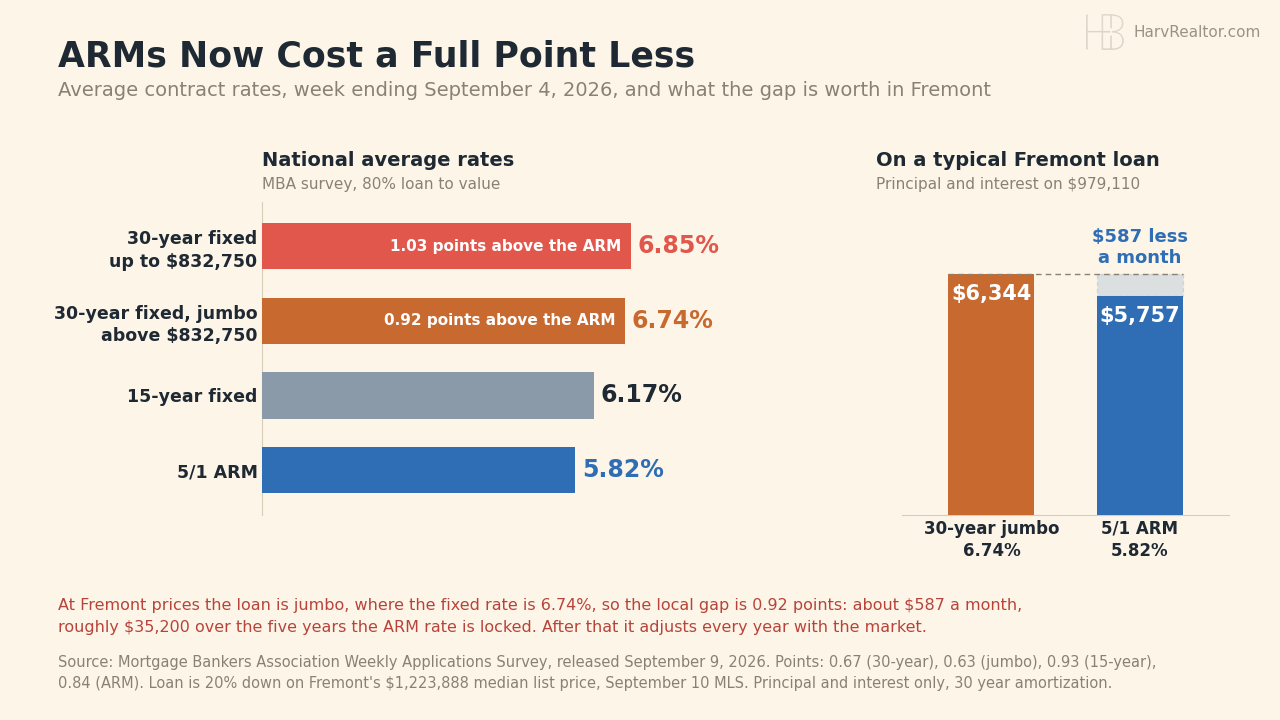
The local wrinkle. At Fremont’s median list price of $1,223,888, a 20% down loan is $979,110, above MBA’s $832,750 conforming line, so the fair comparison is MBA’s jumbo 30-year at 6.74%. That makes the Fremont gap 0.92 of a point, still worth about $587 a month in principal and interest, roughly $35,200 over the five years the ARM rate is locked. After that it adjusts every year with the market, and the ARM carried more upfront points that week, so it fits best for buyers who expect to move or refinance within five years. MBA’s rates predate this week’s jump, so treat them as the size of the gap, not as today’s quote.
Locally, supply is steady. Board wide: 2,680 listings across the 15 city table, counting active and in contract together, with 193 coming soon and 181 brand new. The five city ledger carries 696 live listings across Fremont, Hayward, Milpitas, Newark and Union City, 601 already on the market and 95 coming soon, against 698 yesterday with 87 arriving in the past week.
Fremont holds 264 live listings, 206 active, 40 coming soon and 18 brand new, with a median on market list price of $1,223,888 at $824 a square foot and a typical active listing 28 days out. Behind it: Hayward 183, Milpitas 116, Newark 80 and Union City 53. Across all five cities the median is $1,098,000 at $698 a square foot, 268 homes are under a million, and 155 have been sitting 60 days or longer.
This week’s story is financing, not inventory. A buyer who was comfortable at 6.89% on Tuesday faces a bigger payment today, so refresh pre-approvals before writing offers and raise the ARM question early with anyone planning to stay five years or less. For sellers, 155 homes past the 60 day mark is a reminder that buyers have choices and, as of this week, tighter budgets.
S&P 500: 7,636.36 -0.48% | Dow: 52,380.66 -0.77% | Nasdaq: 26,253.34 -0.64%
Wednesday made it three losing sessions in a row for all three indexes, with the Dow off 0.77% and the Nasdaq 0.64%. Thursday made it four: the S&P closed at 7,591.70, the Dow at 52,064.10 and the Nasdaq at 26,081.72, each down a little more than half a percent.
Apple unveiled its first foldable, the iPhone Duo, starting at $1,999 and running to $3,199 for the 2TB model, with preorders October 16 and stores October 23. It folds in half; the price does not. One correction to the newsletter: it printed the Dow down 1.18% and the Nasdaq down 0.32%, which are Tuesday’s moves repeated.
10-Year Treasury: 4.83% +0.03 | Gold: $4,447.20 +1.07% | Silver: $67.93 +2.34% | Brent: $101.21 +3.36%
Oil is the story. The U.S. military said it destroyed five Iranian oil tankers, four in the Gulf of Oman and one near Kharg Island, after Iran’s Revolutionary Guard tried twice in two days to hit a U.S. warship. Brent settled at $101.21 on Wednesday, its first close above $100 since July 23, and was near $109 by Thursday afternoon. Every $10 on a barrel is roughly 24 cents on each of its 42 gallons, which is how this reaches Bay Area pumps.
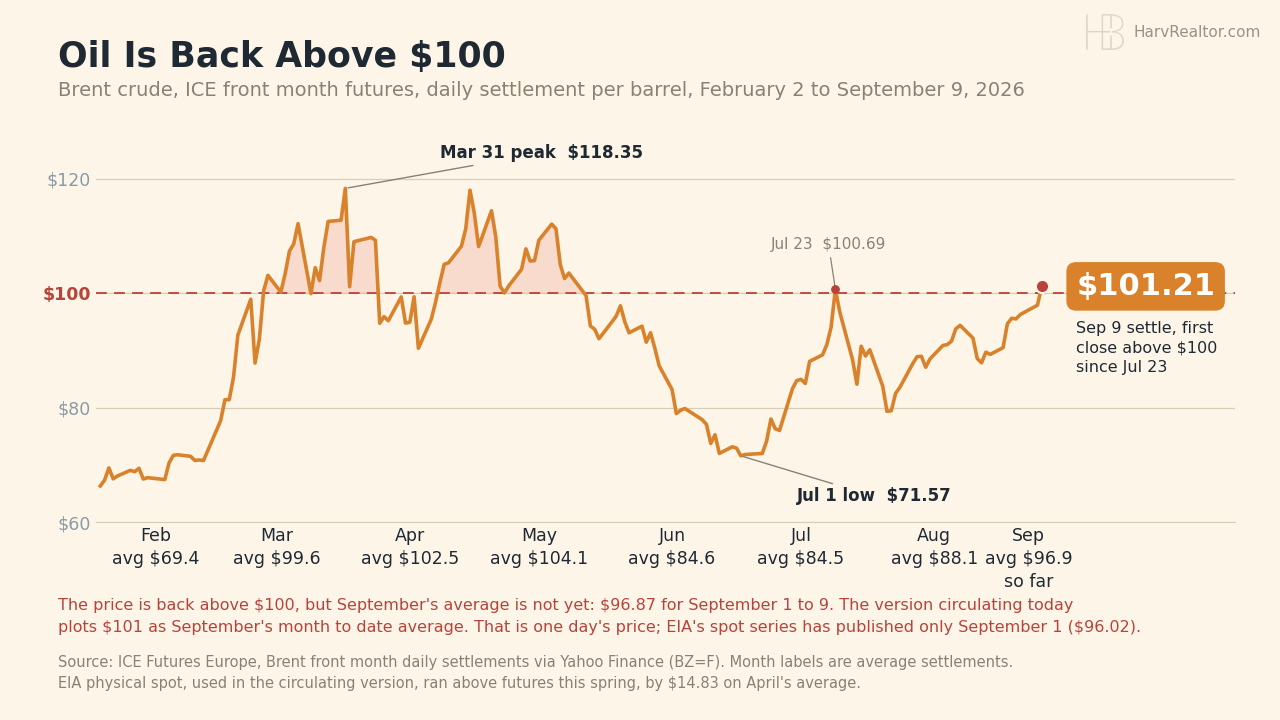
One correction to the chart making the rounds. It shows September’s month to date average at $101, but that is one day’s price. The September 1 to 9 average is $96.87, so the price is back above $100 and the month is not, yet. Our version plots the Brent futures contract we quote every day: a spring peak of $118.35 on March 31, a low of $71.57 on July 1, and a steady climb since.
Metals reversed. Gold rose 1.1% and silver 2.3% at Wednesday’s 1:00 PM PT print, then gave that back and more: at Thursday’s print gold was $4,358.50 and silver $64.09, down about 2% and 5.6%. Treasury tripled the size of Thursday’s buyback of longer dated bonds to as much as $6 billion, and the U.S. answered Canada’s counter tariffs, on C$27.6 billion of U.S. goods (about US$20 billion), with bans on most Canadian alcohol, some dairy and motorcycles starting September 29.
A note on today’s newsletter numbers: it had the 10-Year at 4.84% against Treasury’s 4.83%, gold up 0.09% when its own prices show a gain of nearly 1%, and Brent at $101.64 against the $101.21 settlement. Silver was left out again.
Bitcoin: $77,189 -1.24% | Ethereum: $2,459.74 -0.20% | XRP: $1.35 -3.18%
Live quotes pulled at 2:36 PM PT with 24 hour changes. All three are lower with the rest of the risk trade, XRP the weakest at about 3%.
The tokenized stock fight got louder. AMC’s CEO Adam Aron called Robinhood’s AMC stock token a “quasi-fake market” and says he will take it to the SEC, while Robinhood’s Vlad Tenev counters that the tokens are backed one for one by real shares held as collateral.
Sources
- Mortgage News Daily (30 and 15 year fixed, September 10)
- Mortgage Bankers Association Weekly Applications Survey (week ending September 4, released September 9)
- U.S. Treasury daily yield curve (10 year, September 9)
- ICE Brent front month (daily settlements, February 2 to September 9) and EIA Brent spot (release of September 2)
- Al Jazeera (U.S. strikes on five Iranian tankers, September 9)
- COMEX gold and silver front month (1:00 PM PT prints, September 9 and 10)
- Bloomberg via Yahoo Finance (Treasury buyback)
- Fortune (U.S. import bans on Canadian goods)
- Apple Newsroom (iPhone Duo pricing and availability)
- CoinDesk (Robinhood and AMC stock tokens)
- CoinGecko (Bitcoin, Ethereum and XRP, live at 2:36 PM PT September 10)
- REALTY EXPERTS® Live Inventory (five city ledger, September 10)
Disclaimer: The market data, rates, and information provided are for informational purposes only and should not be considered financial advice. Always verify rates and data with your lender or financial advisor before making any decisions.