



"At a Glance" Local Housing STATS and News 09/08/26
September 8, 2026 · Alameda County Market Dashboard
TODAY'S LIVE INVENTORY
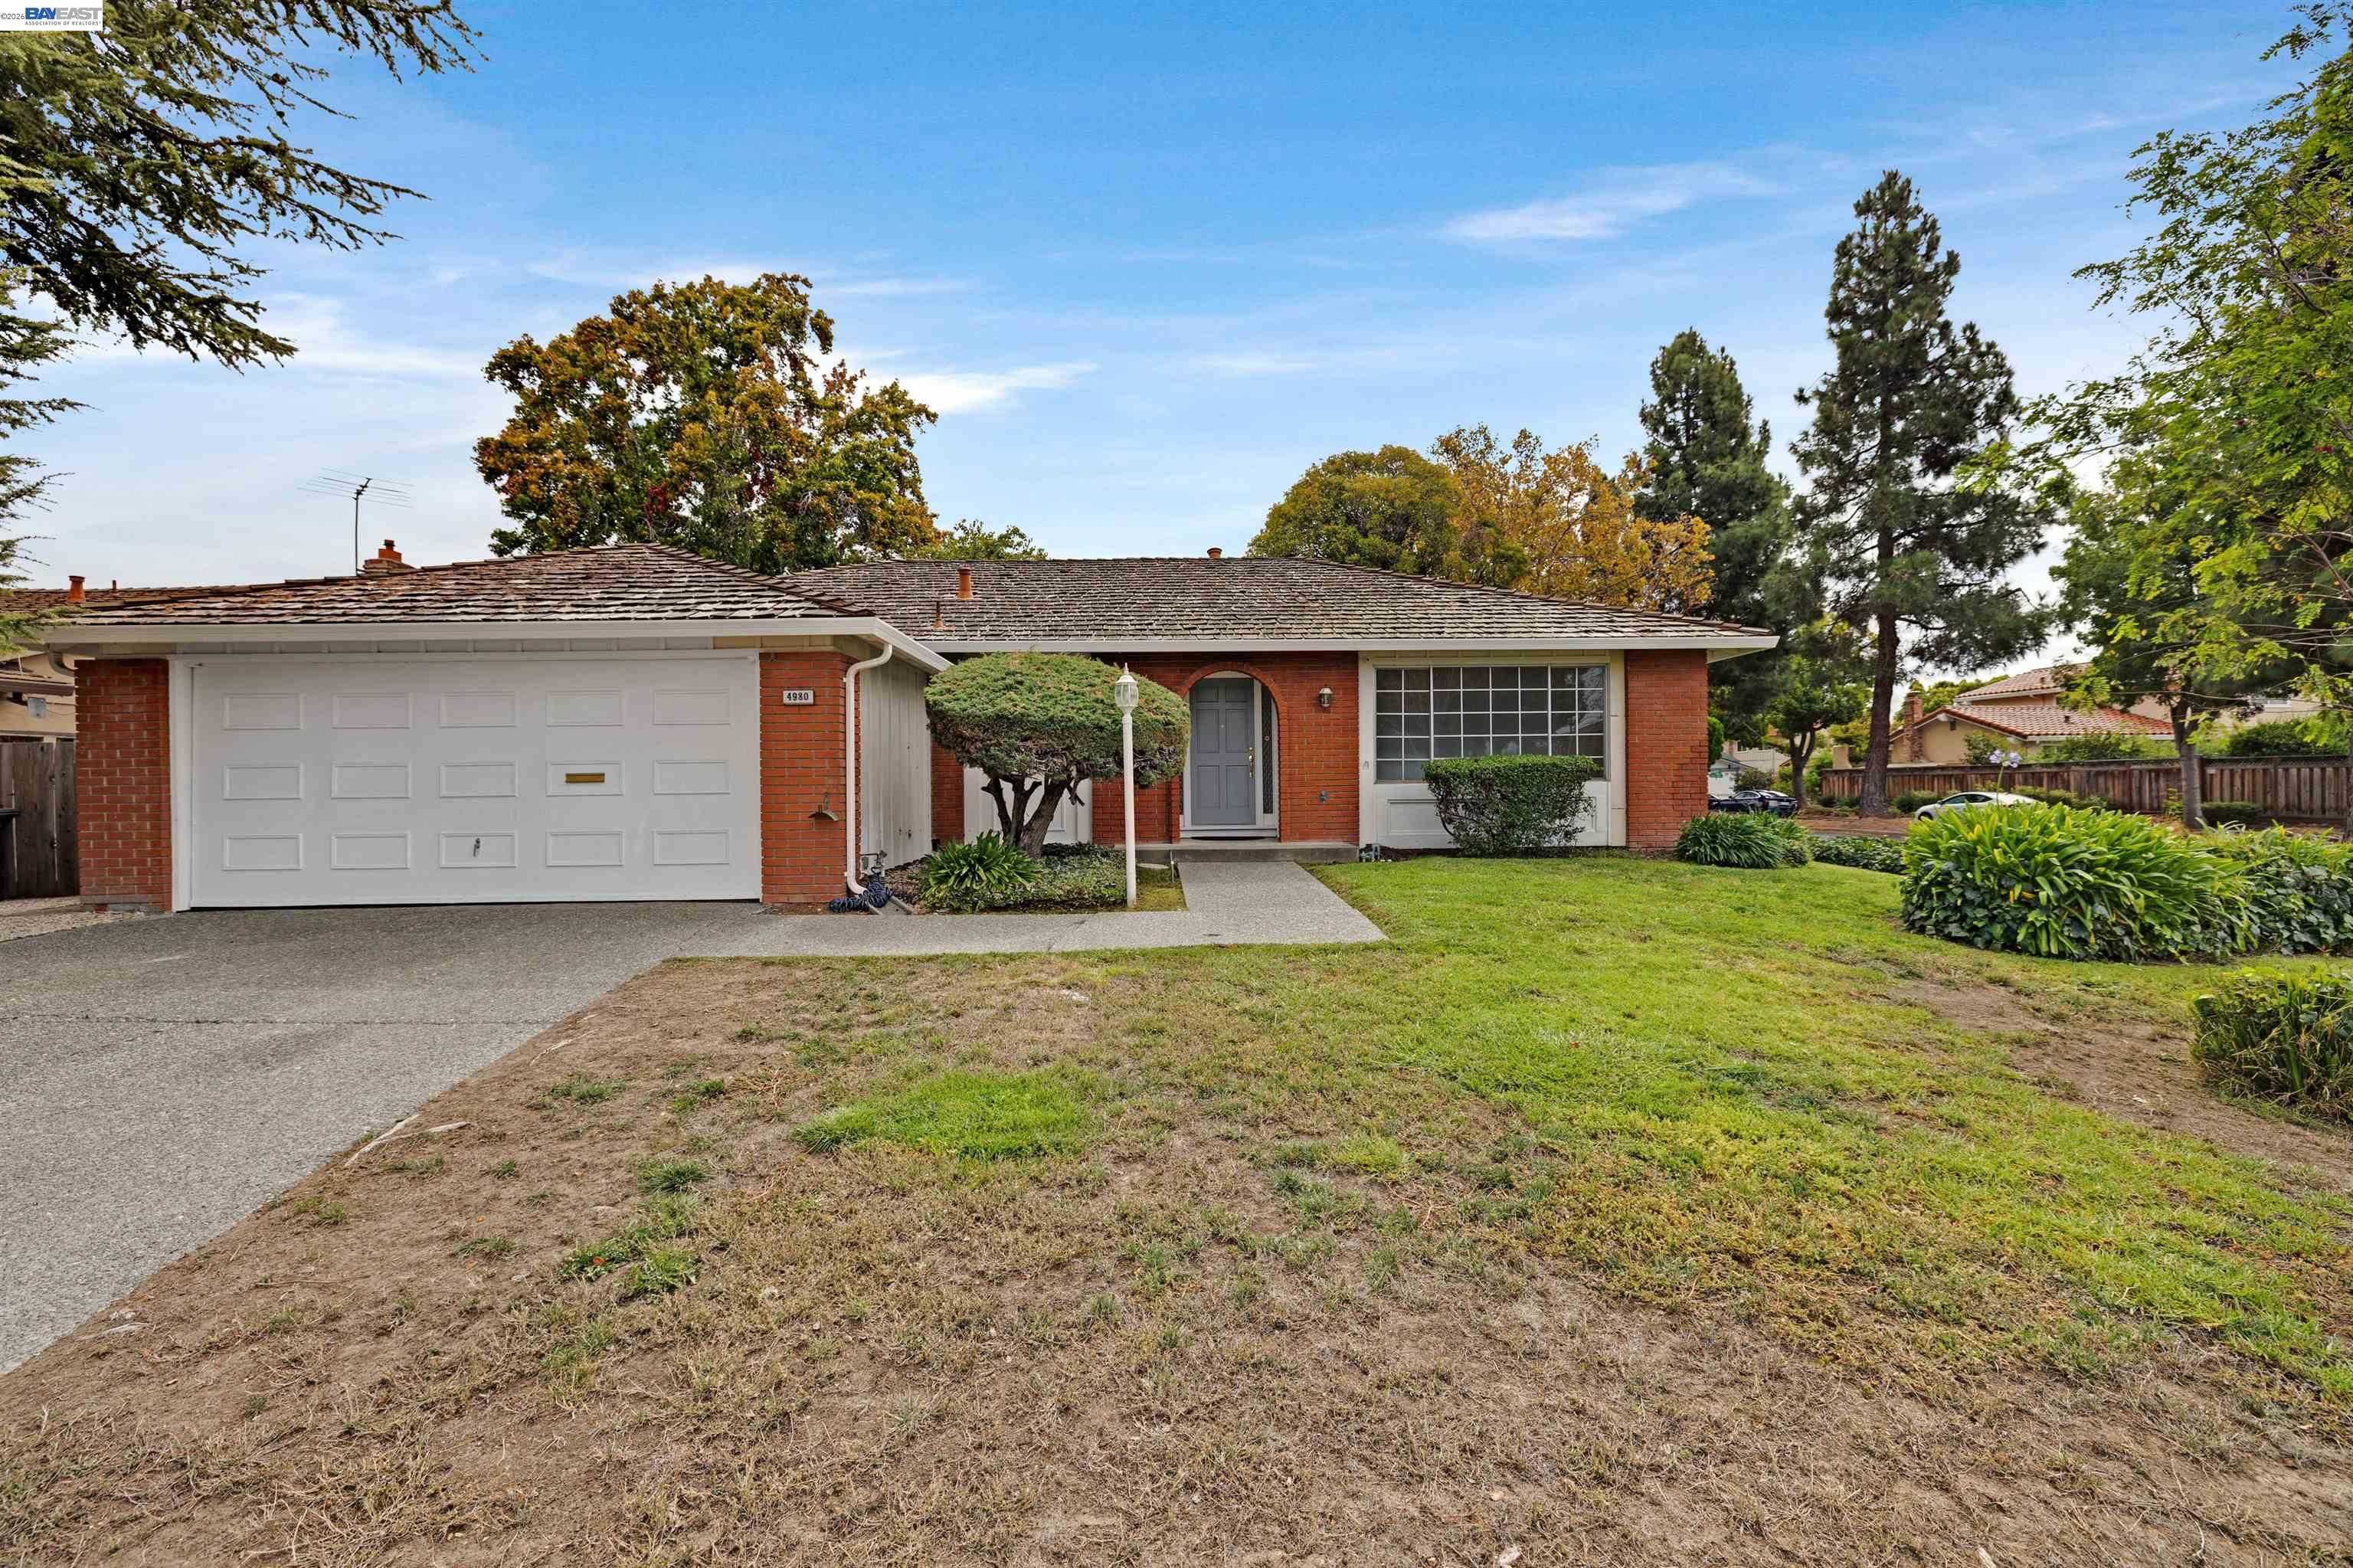
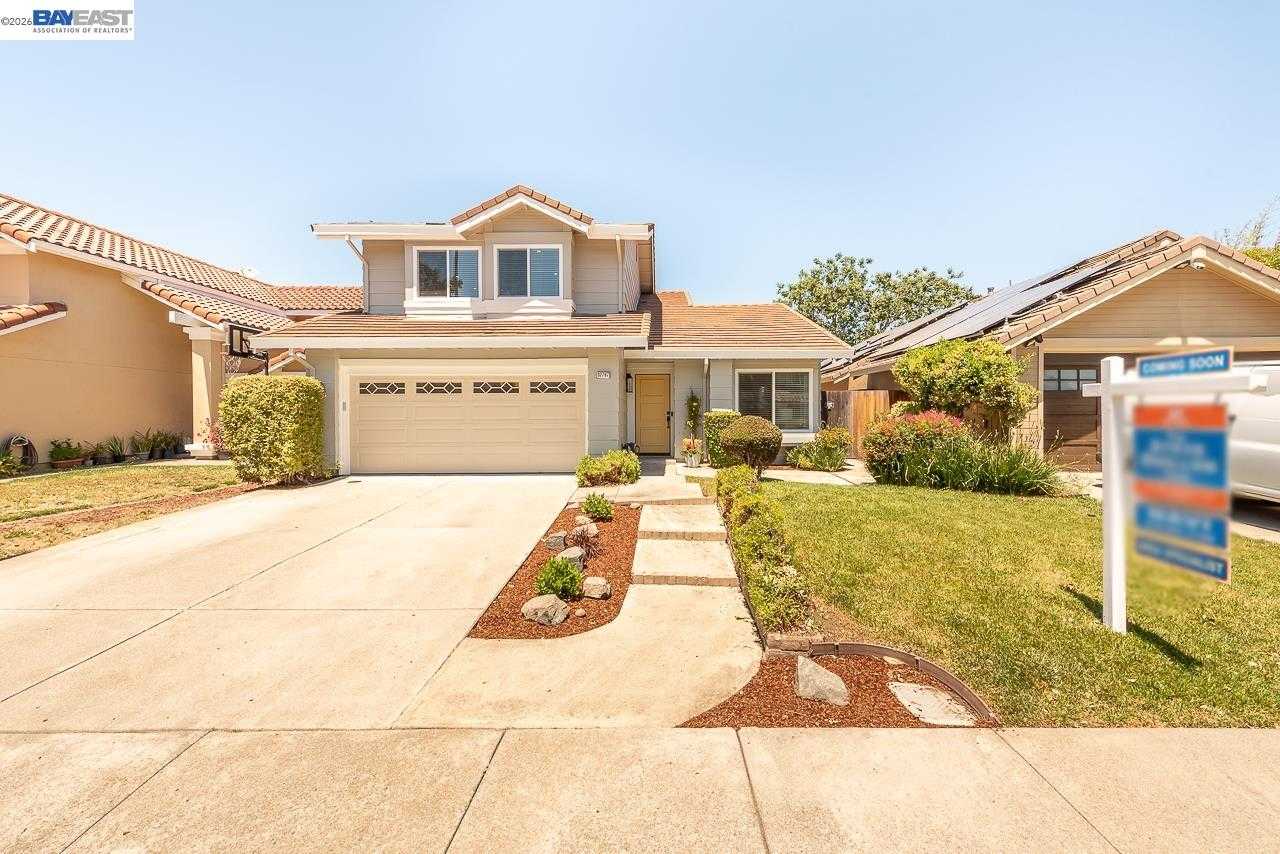
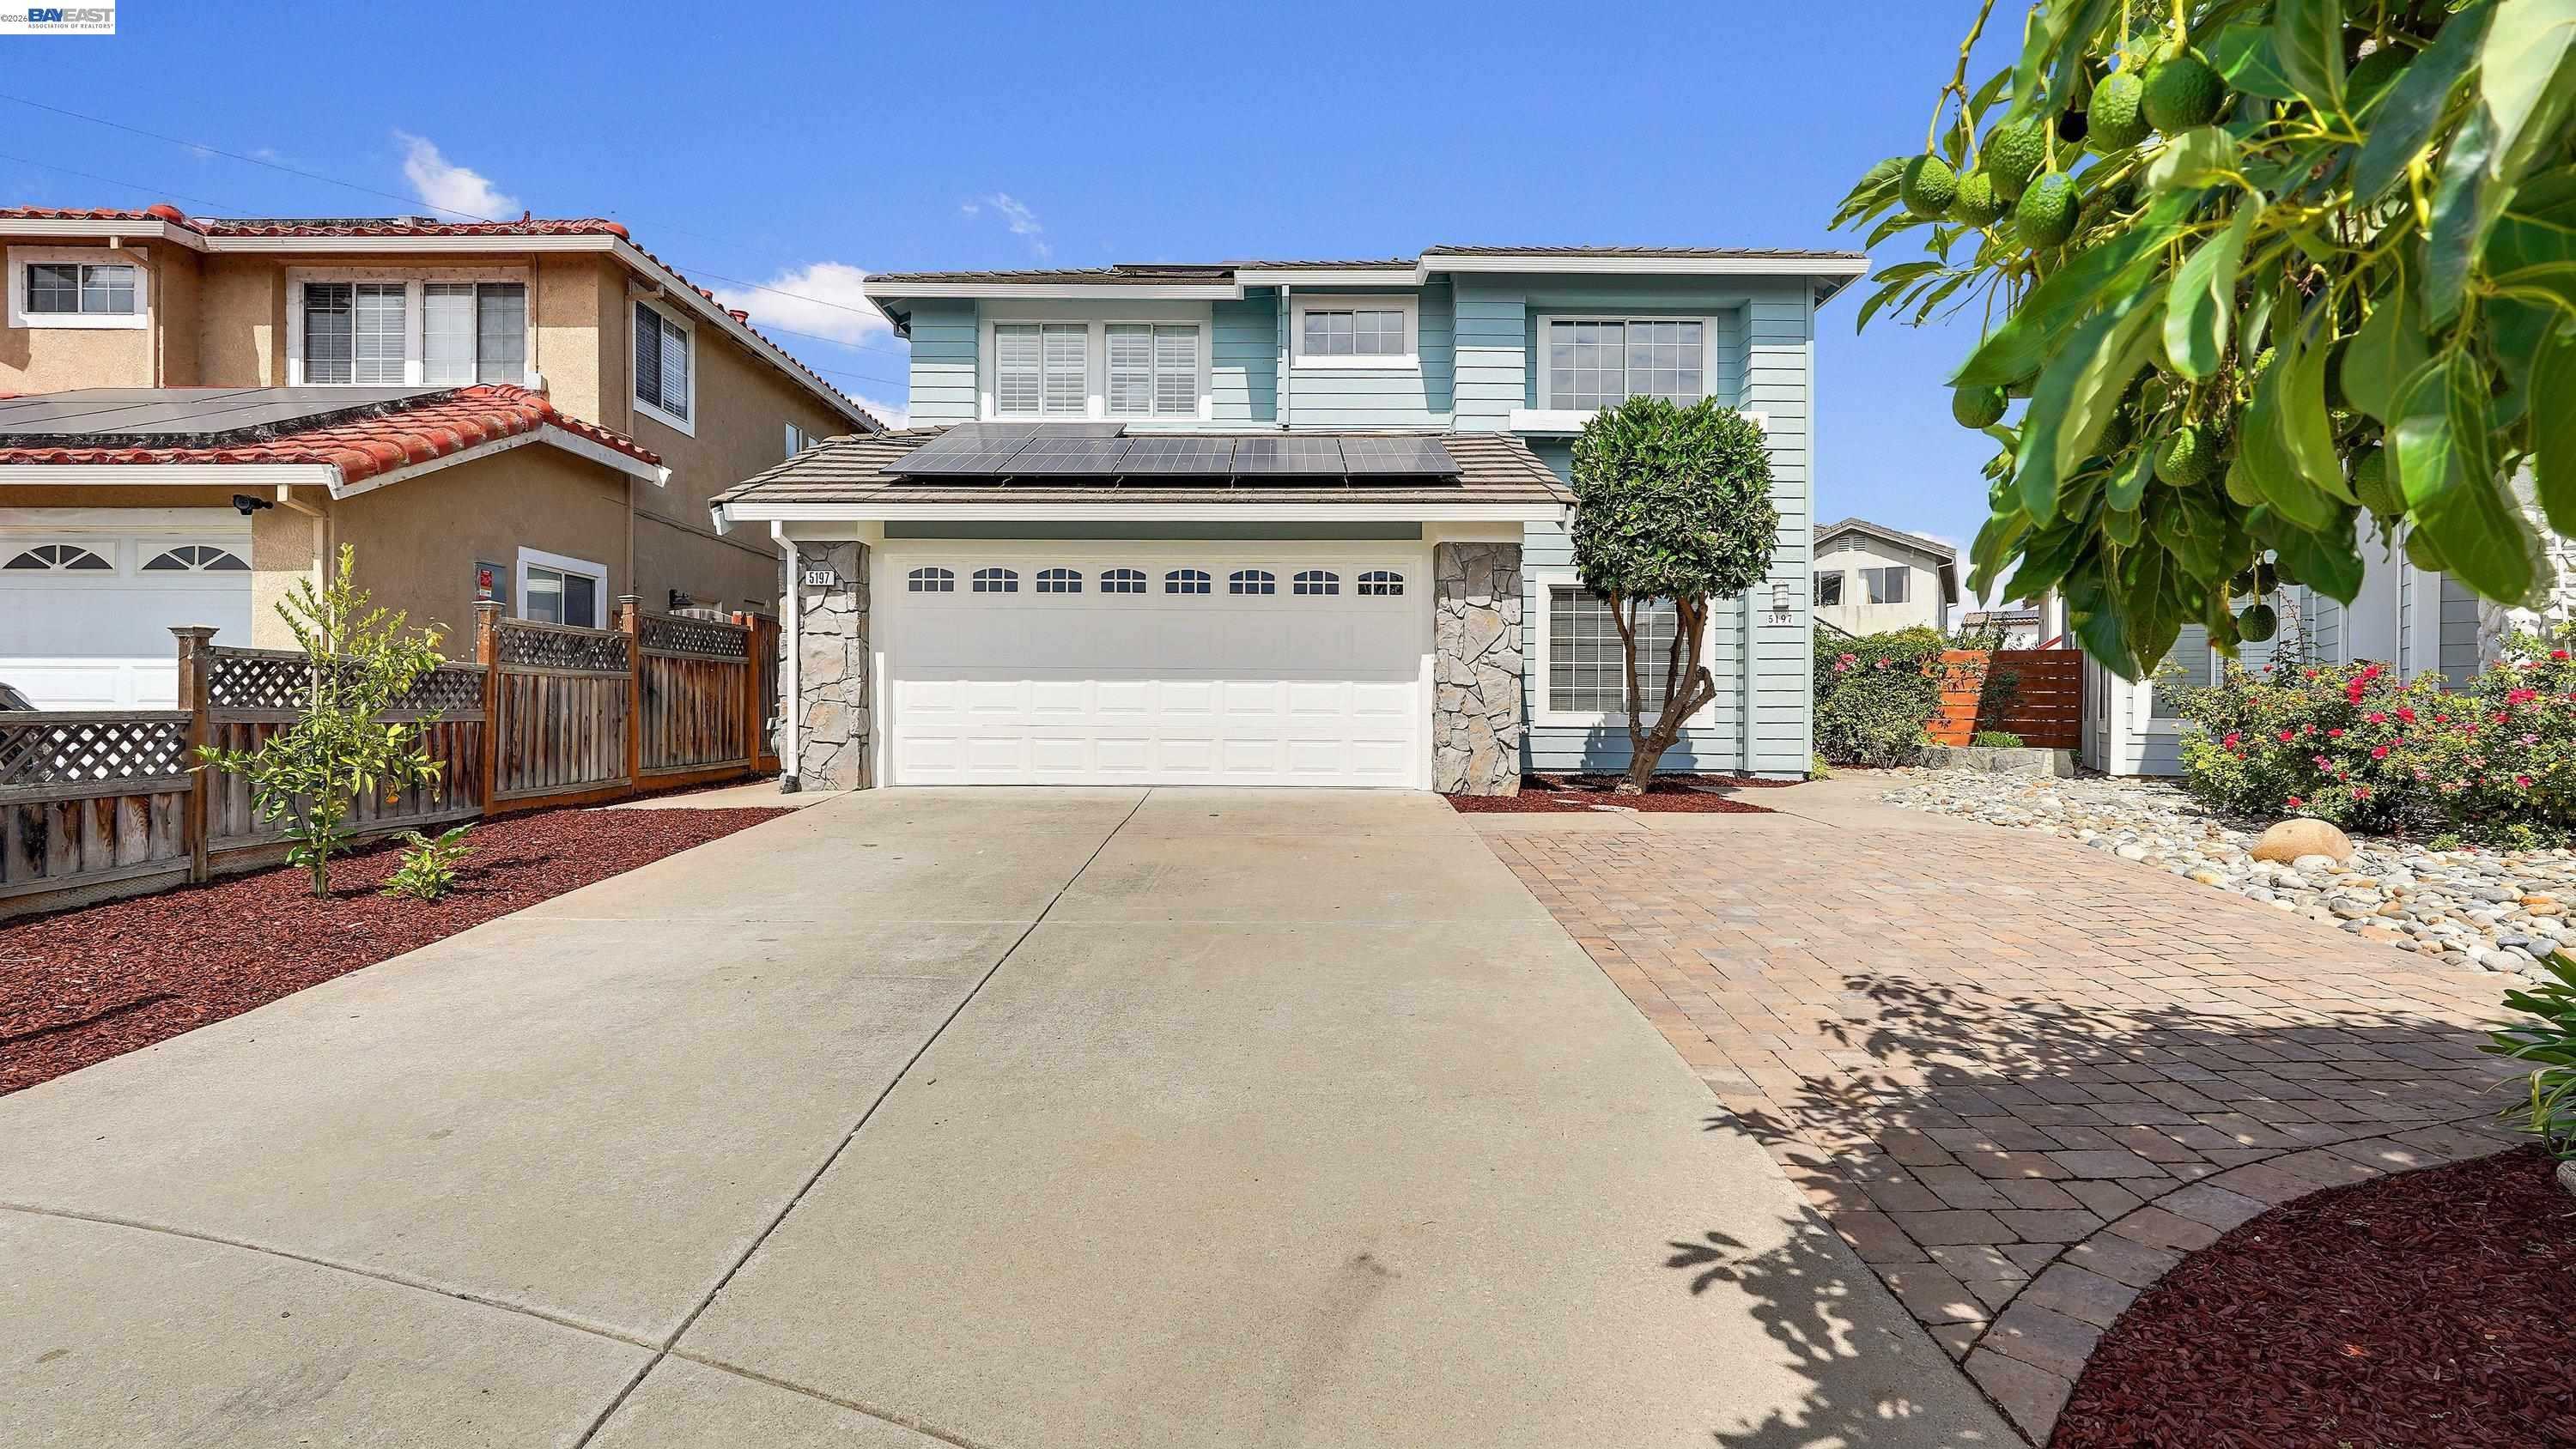
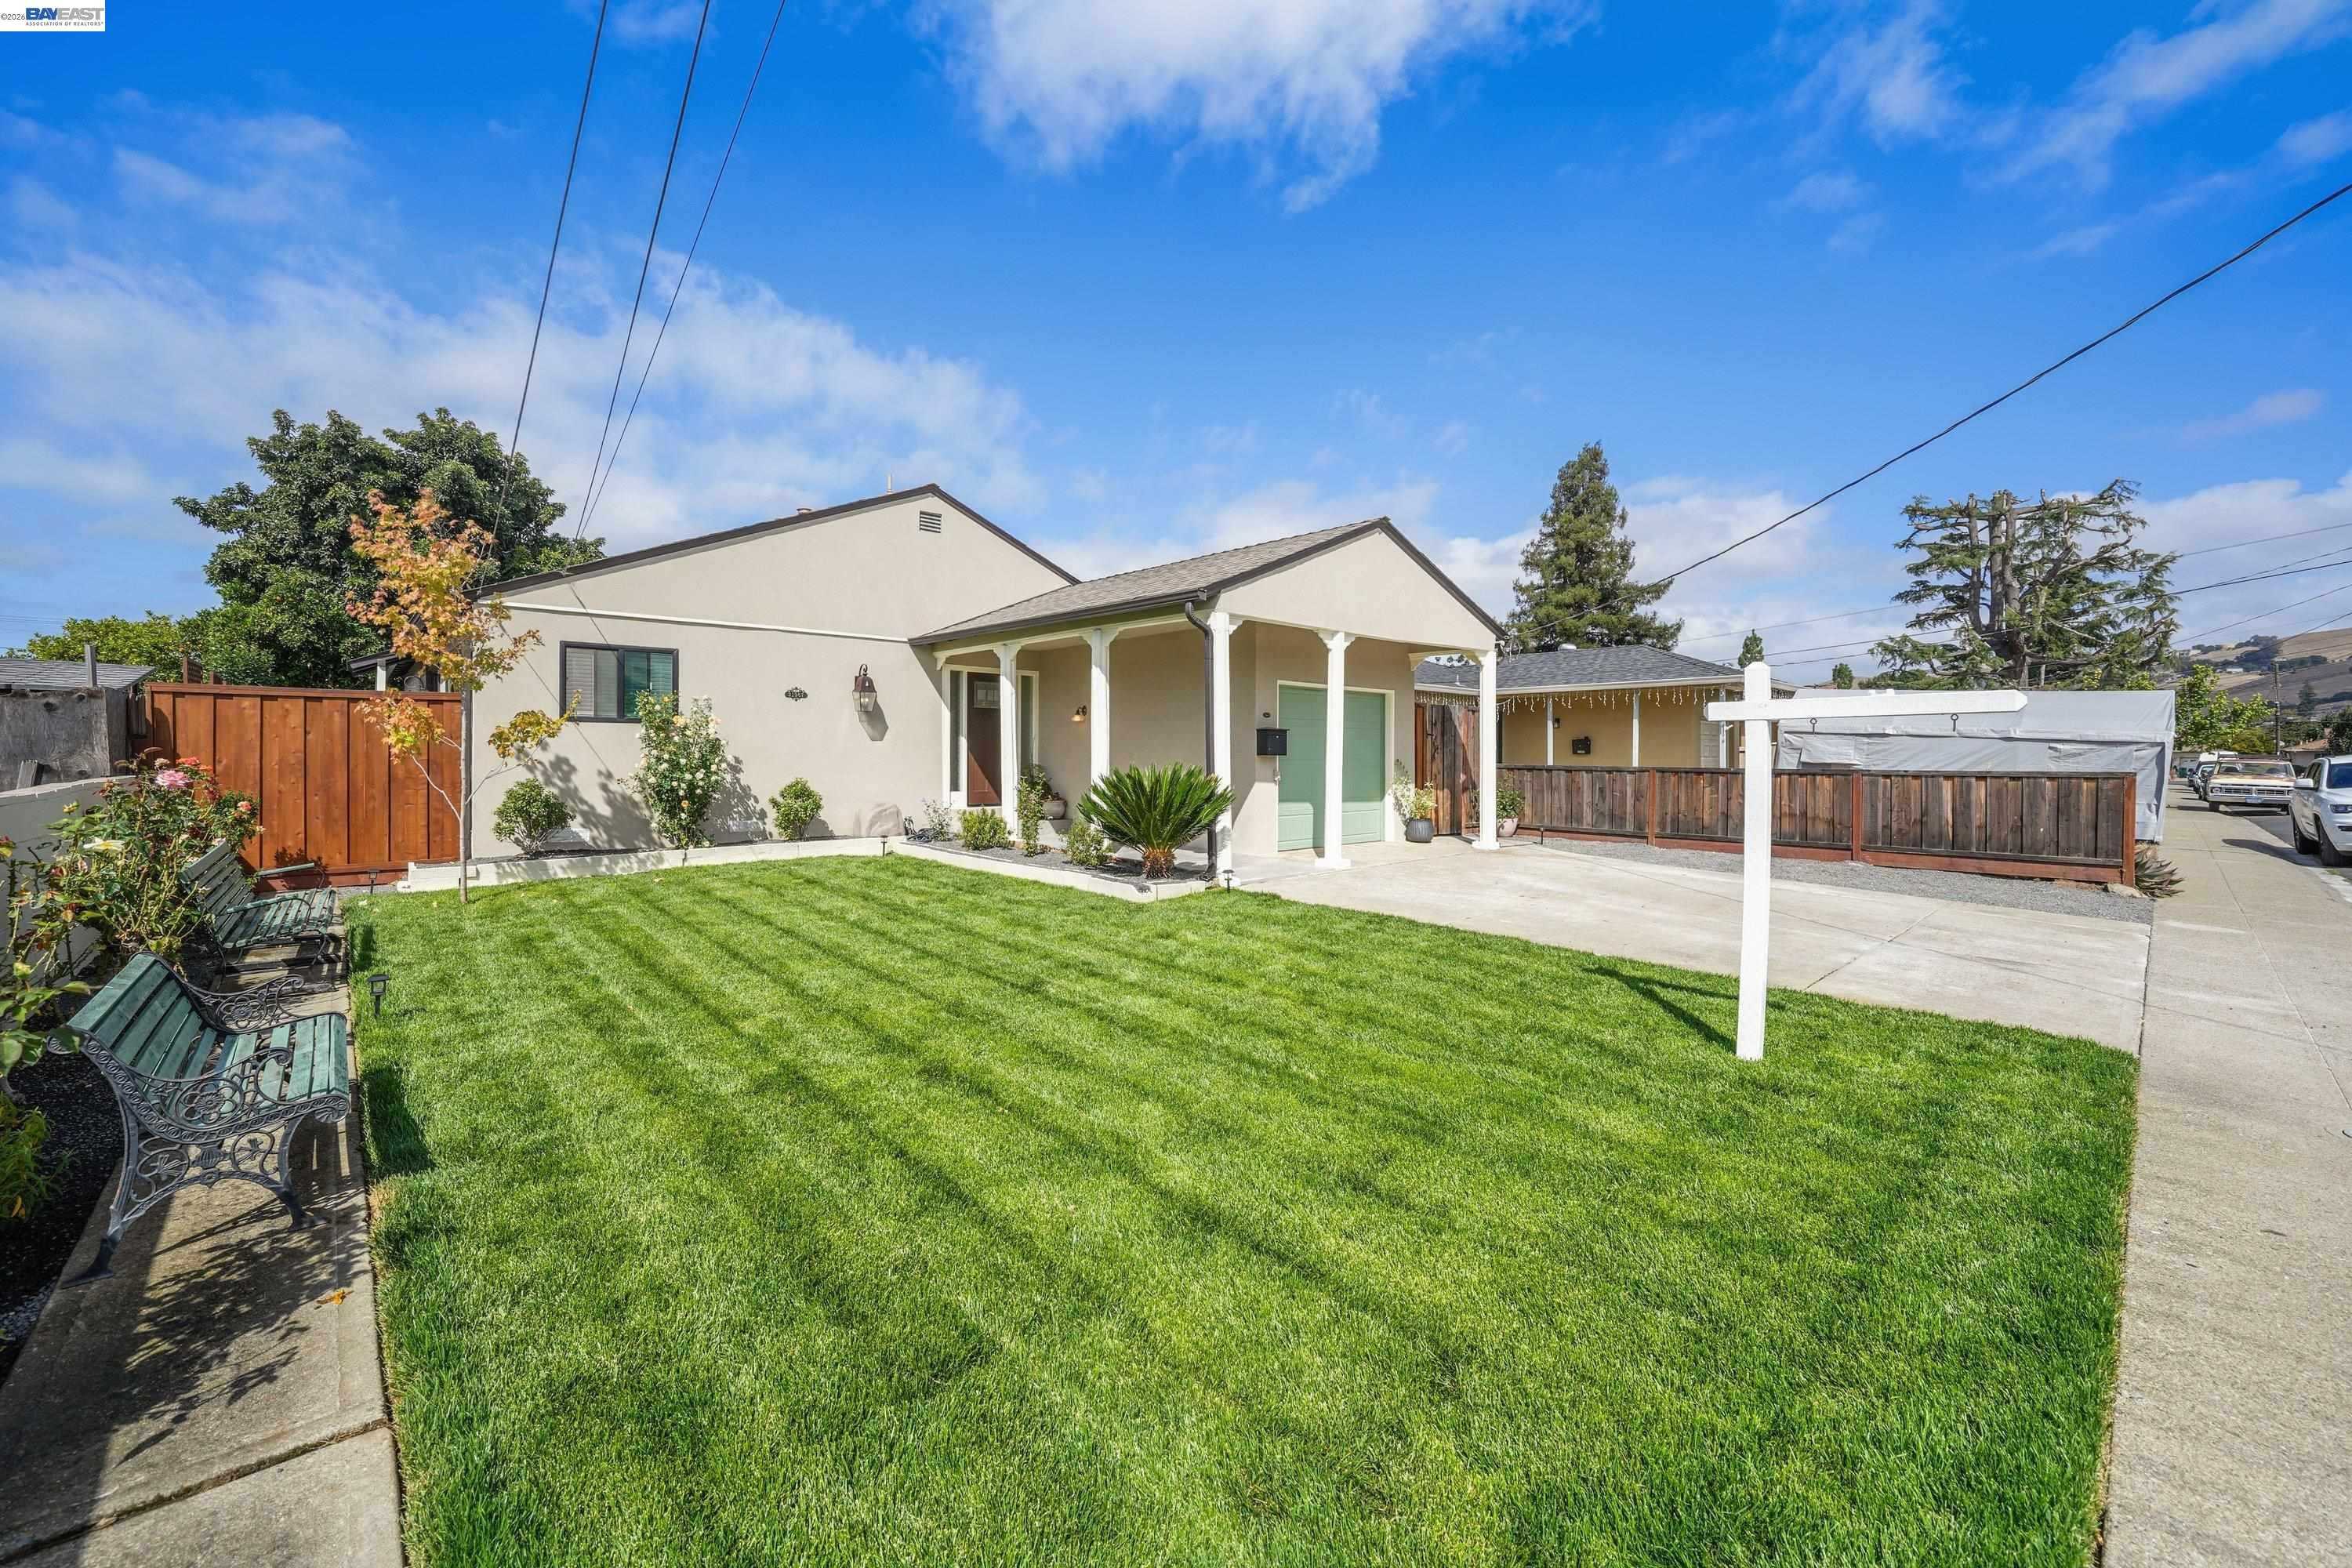
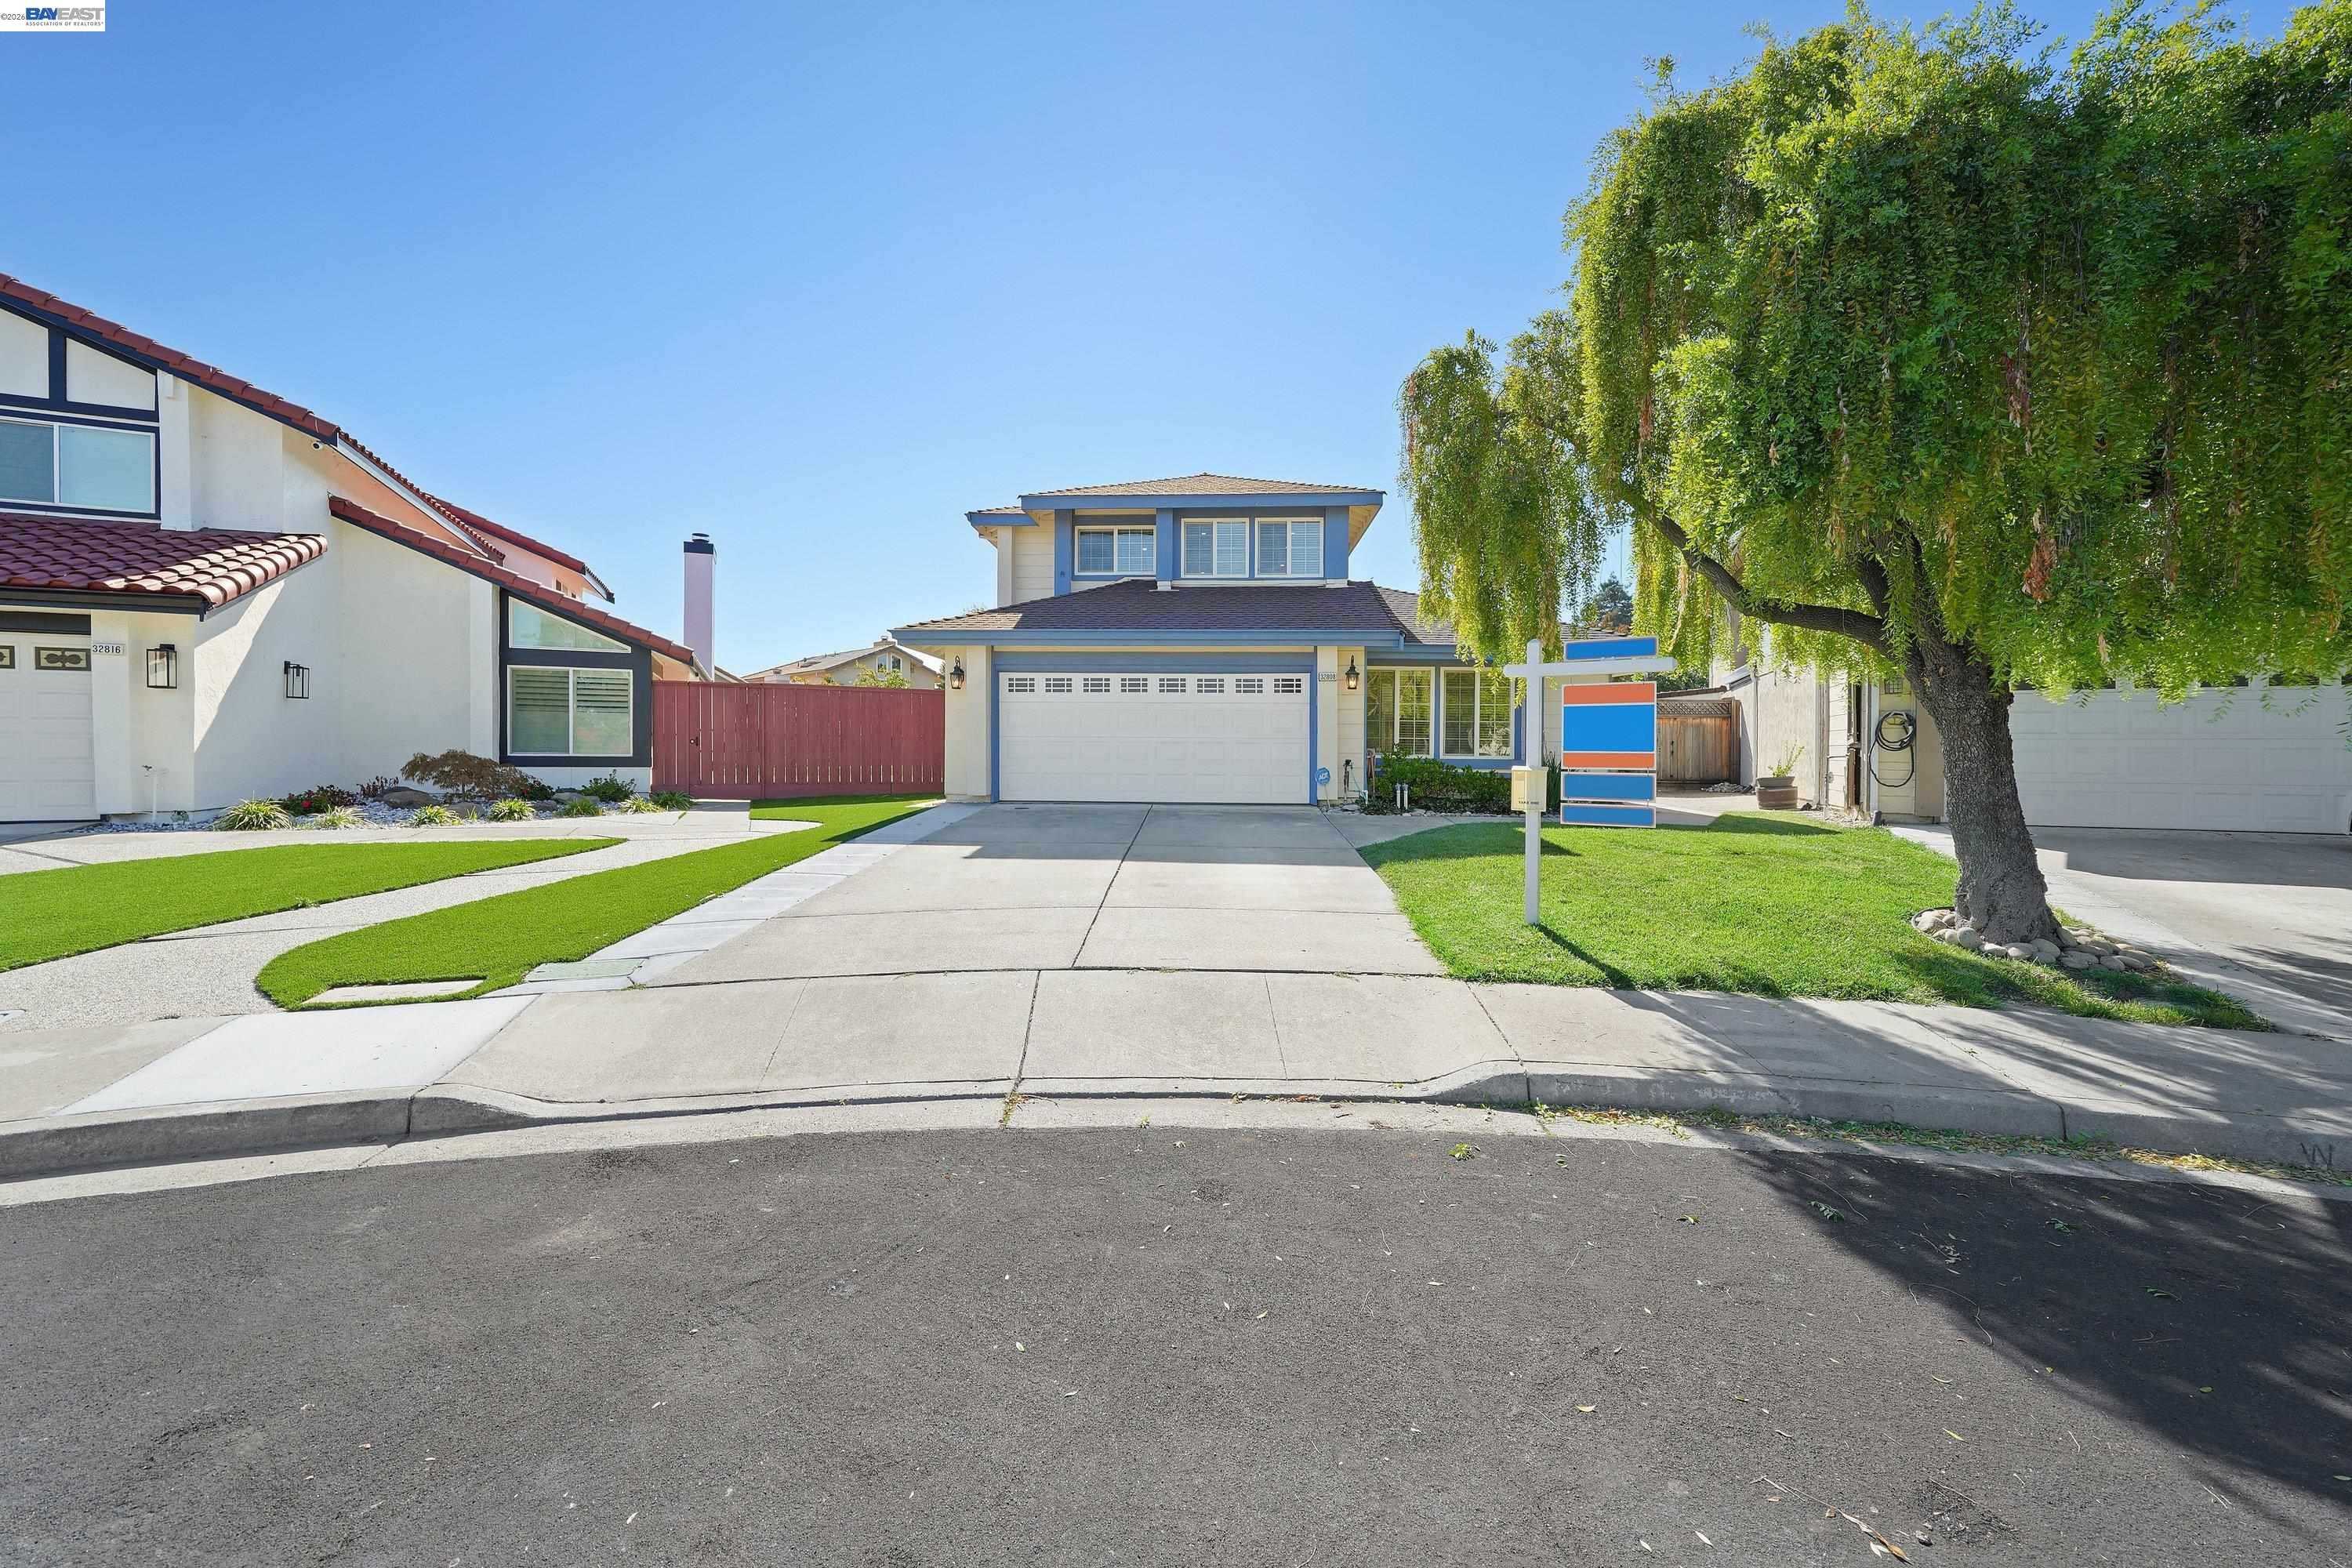
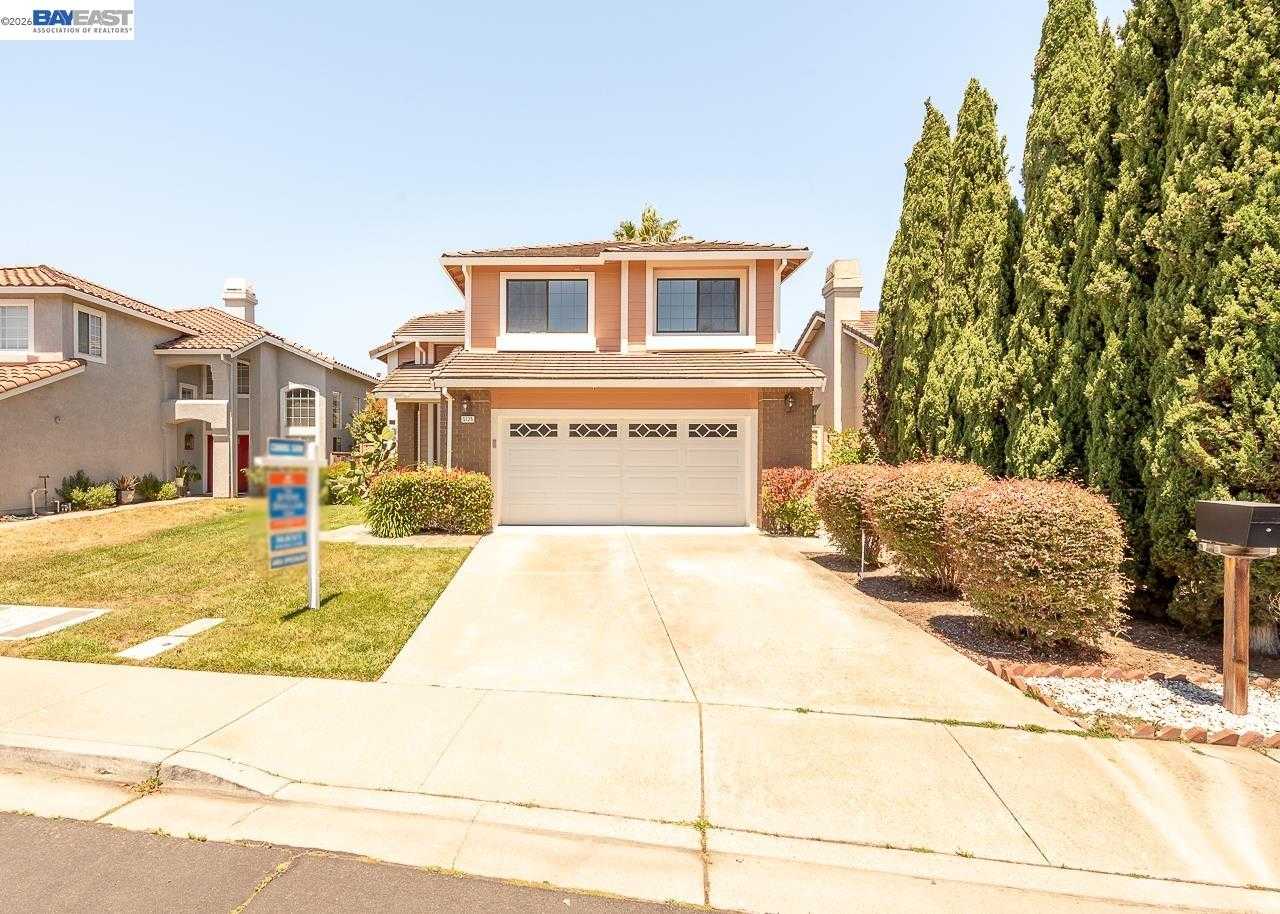
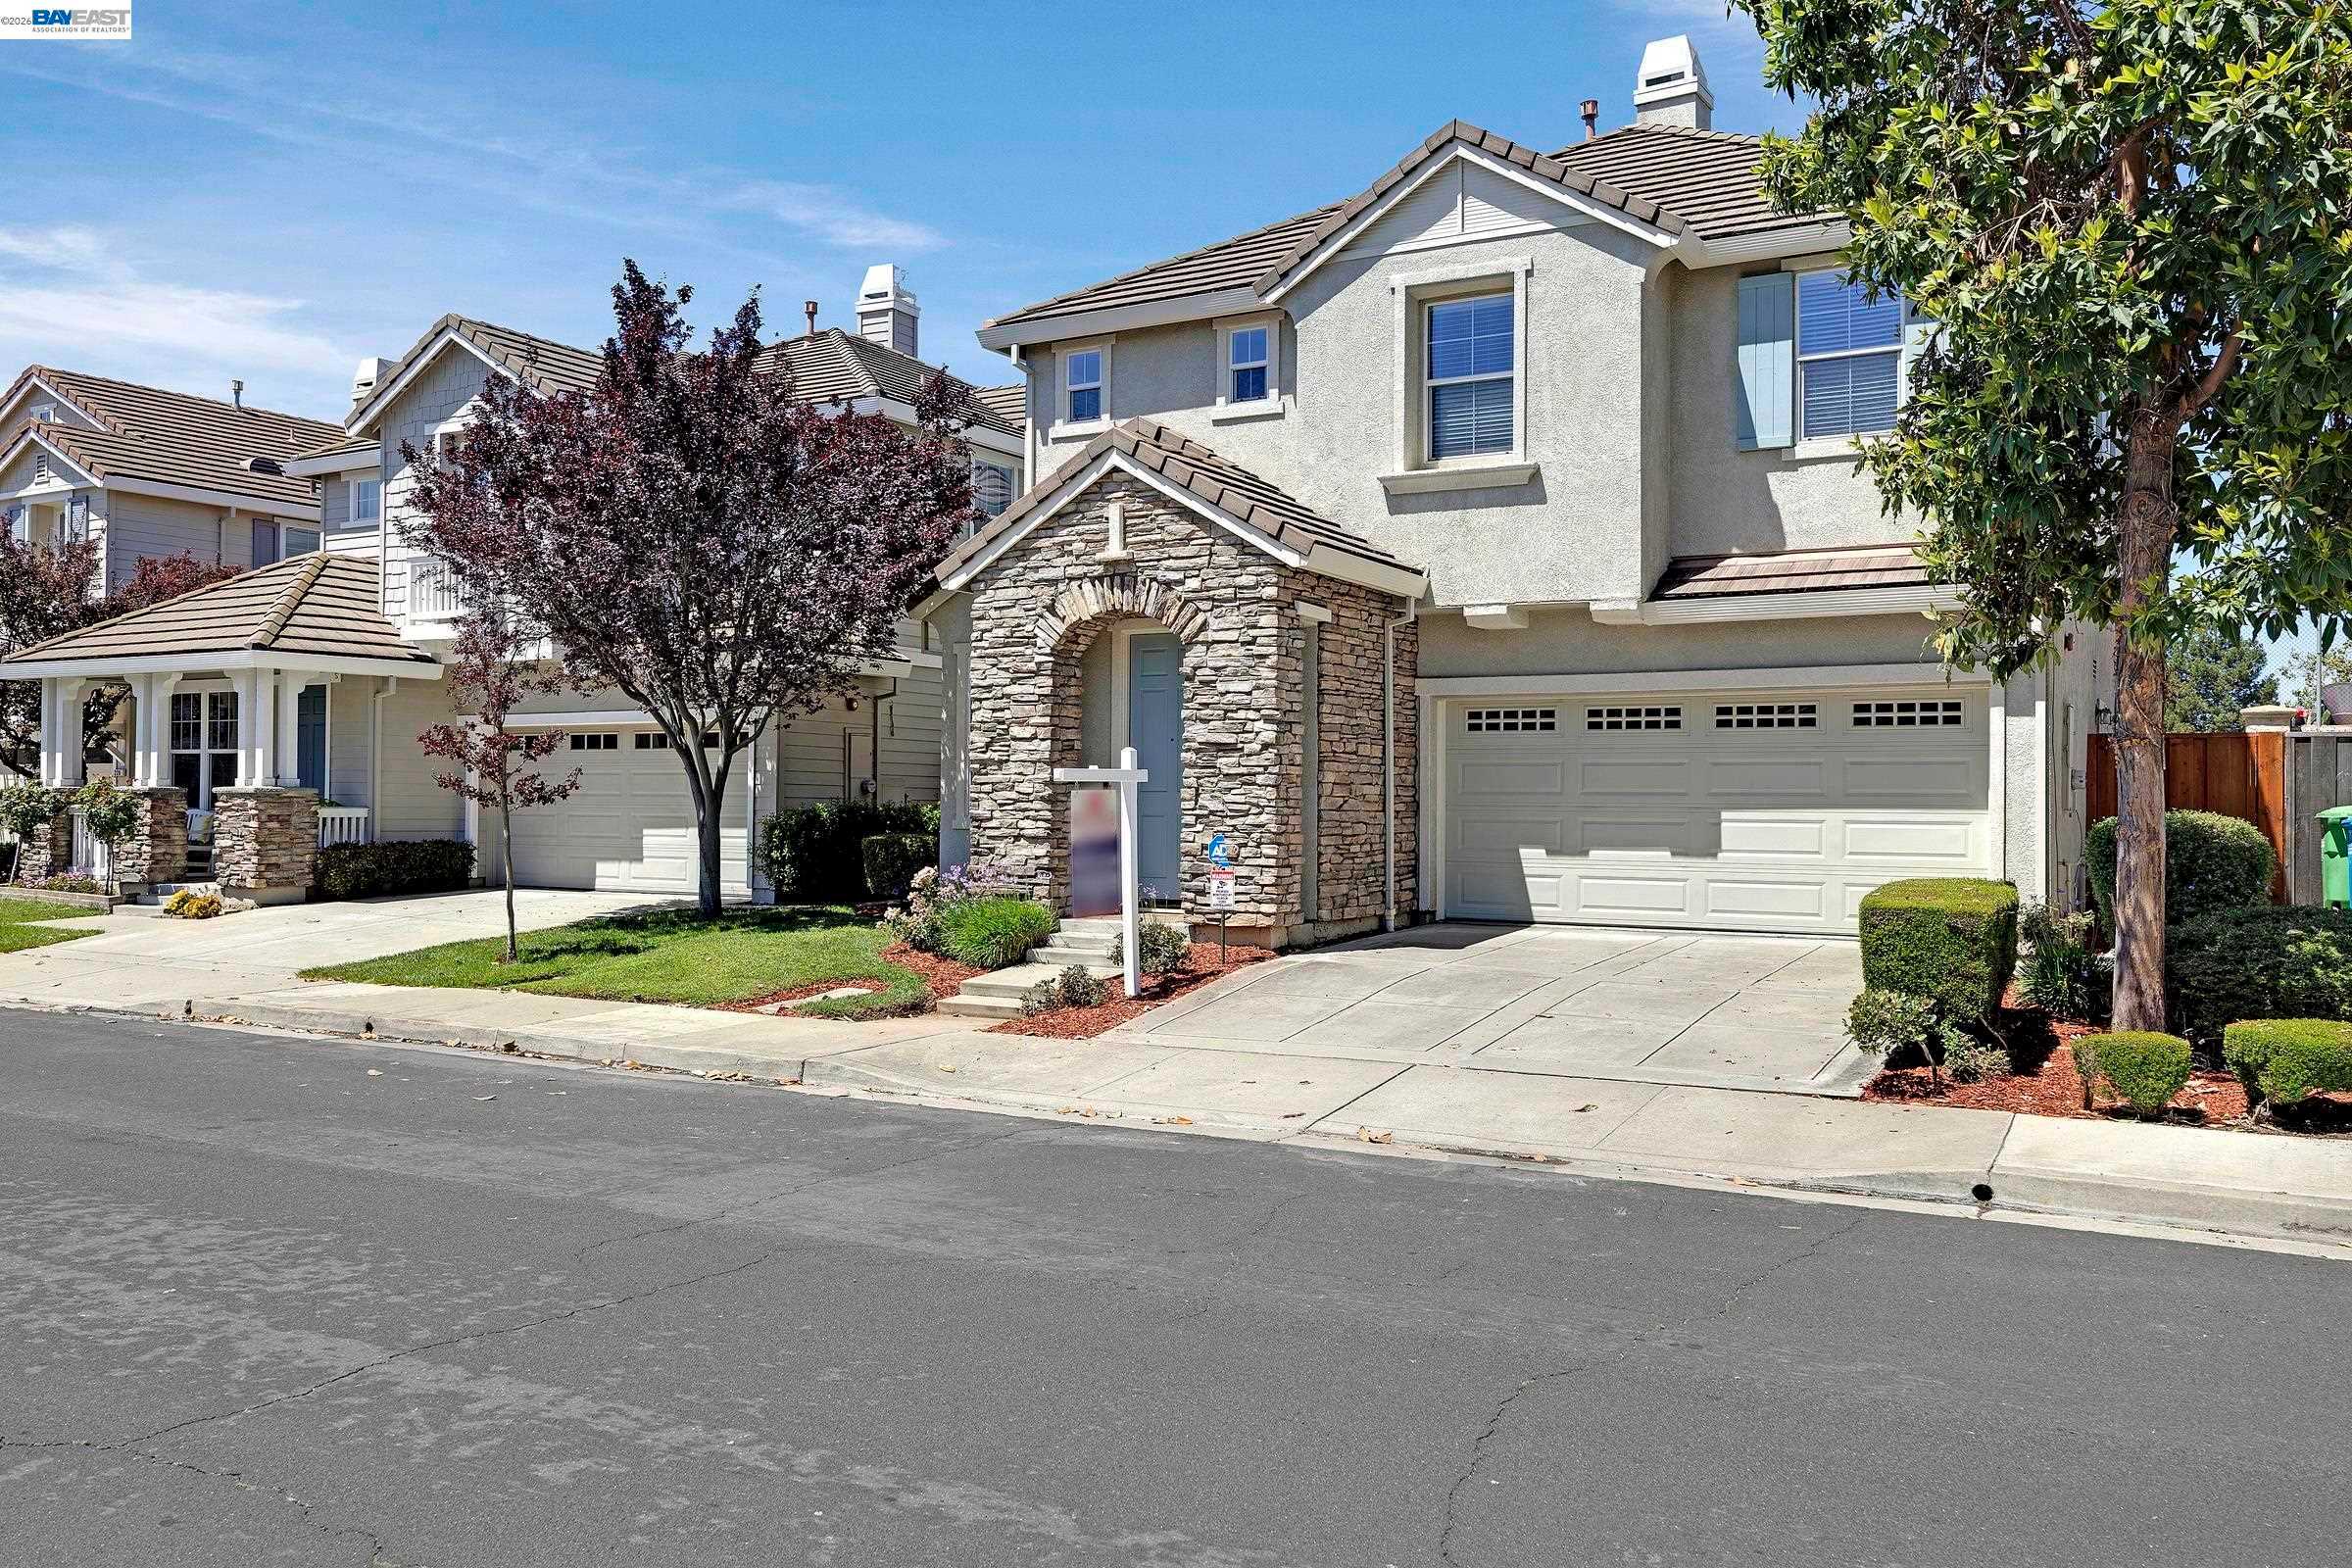
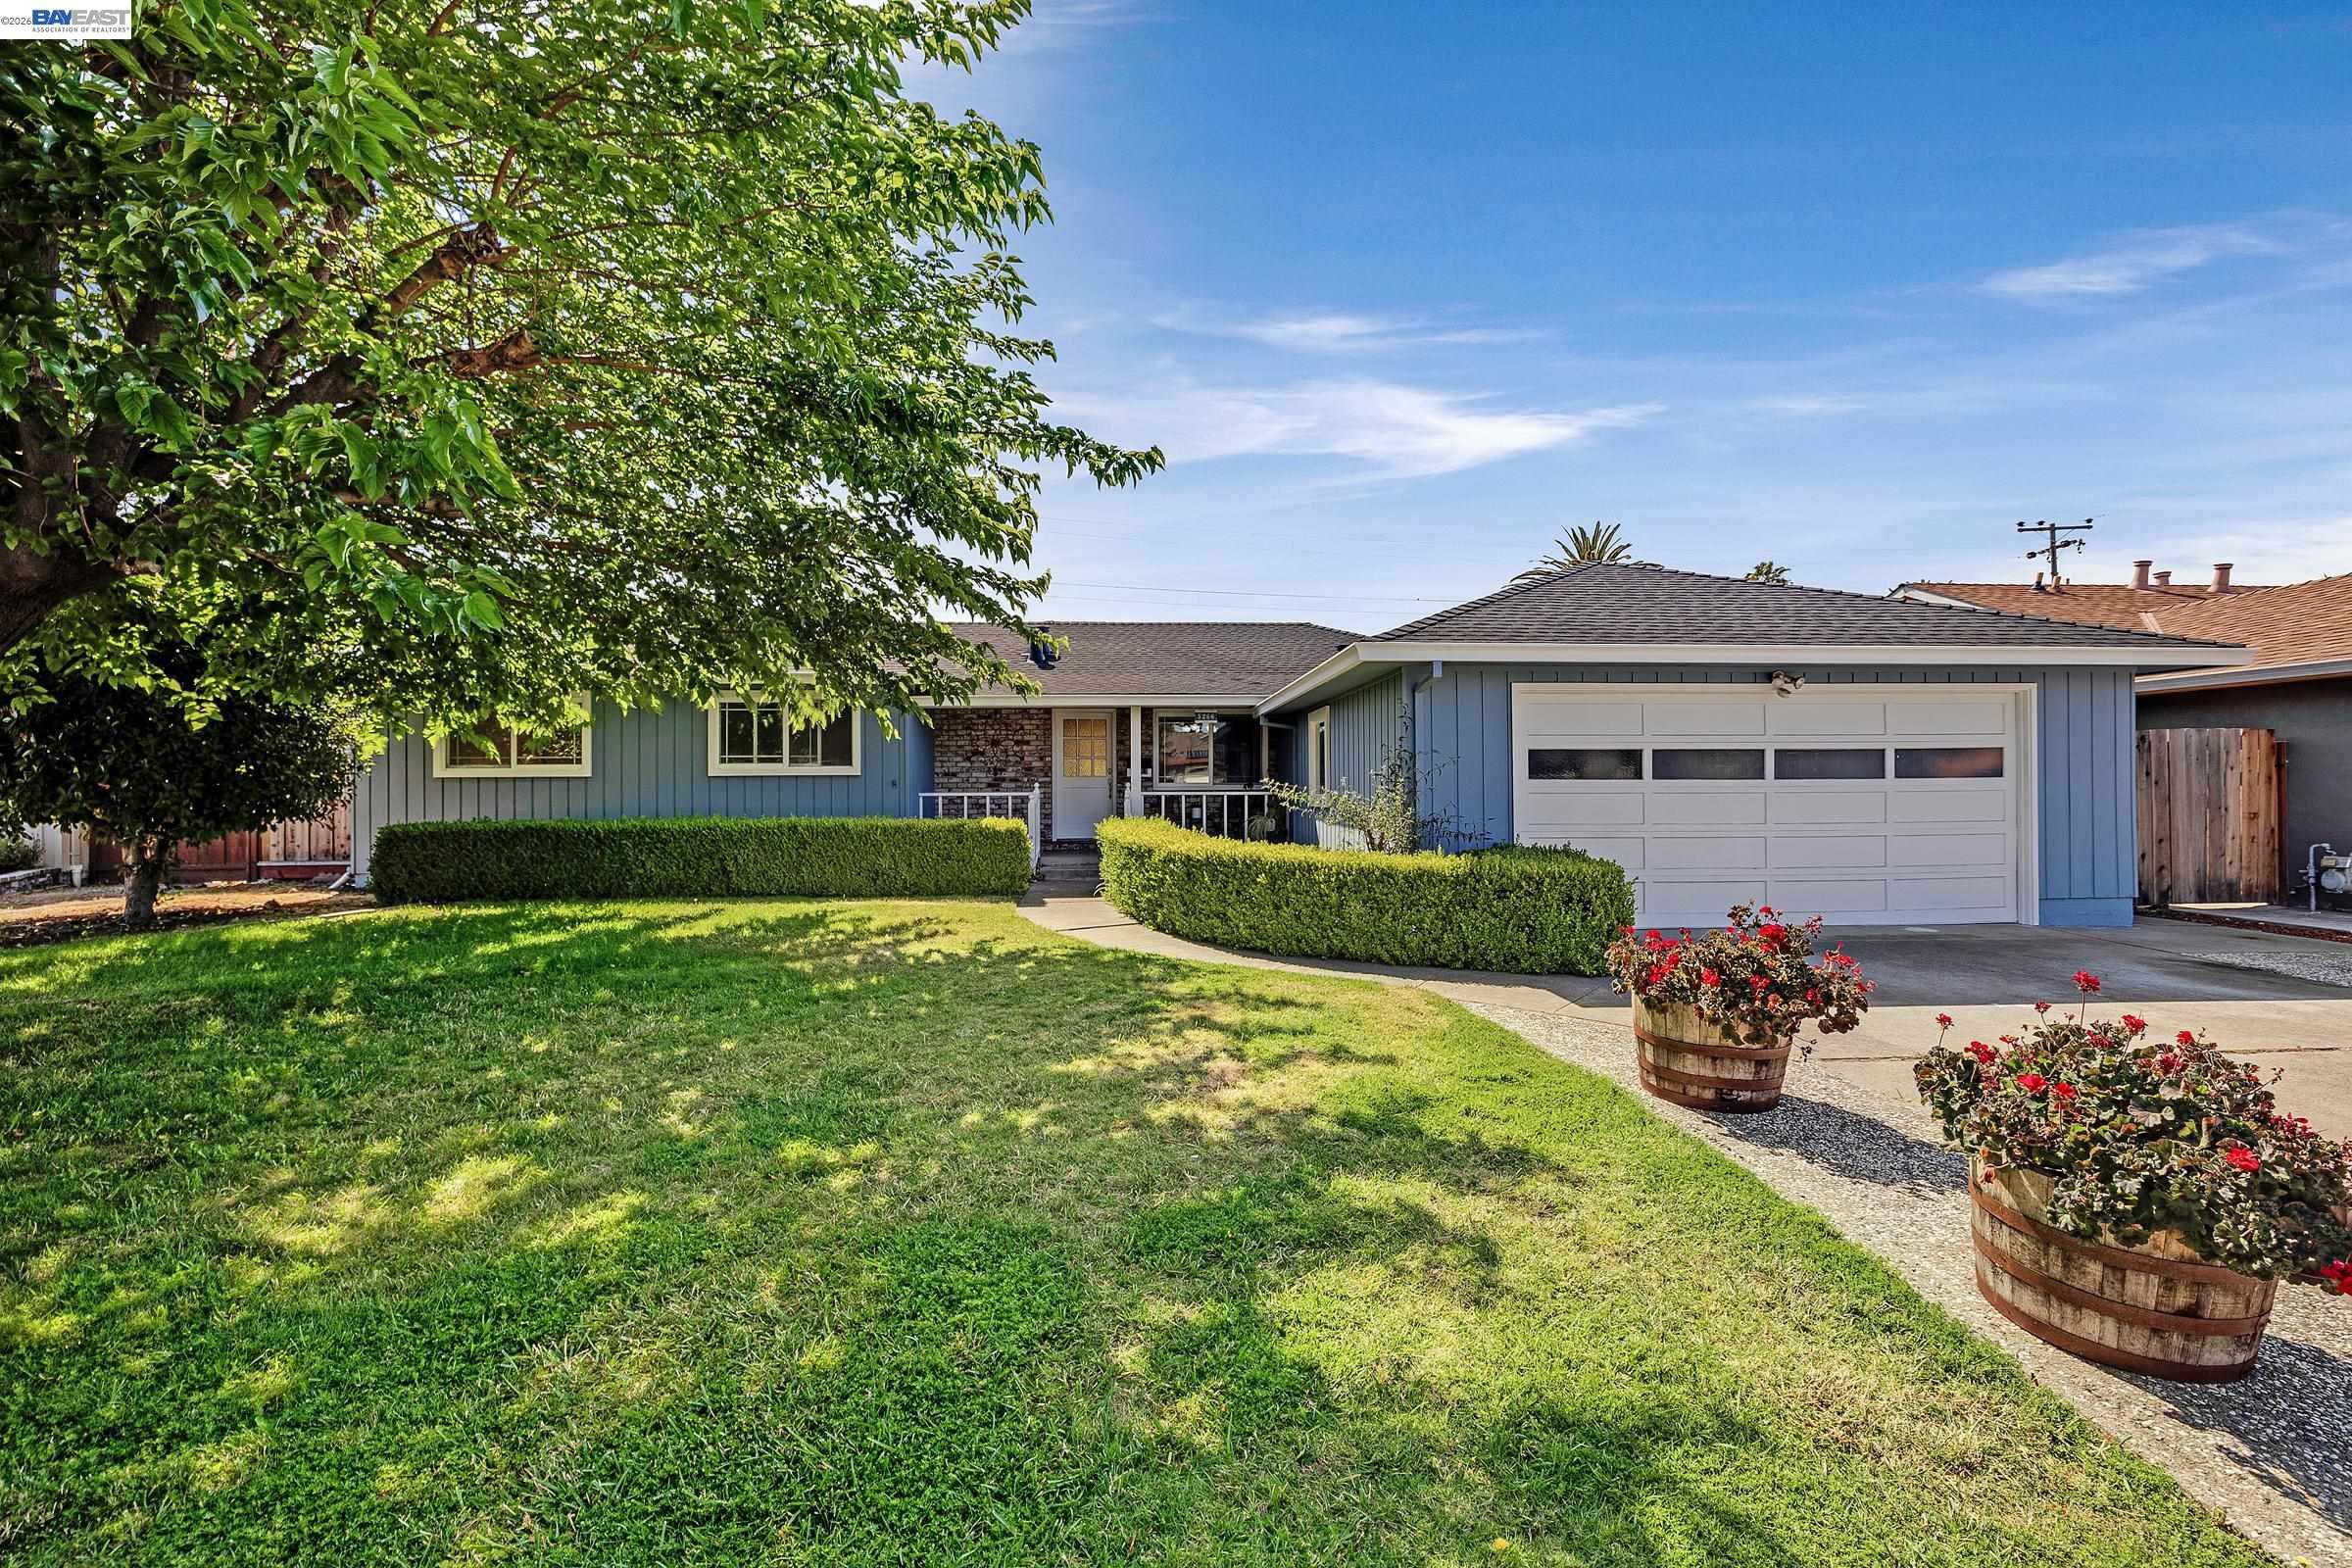
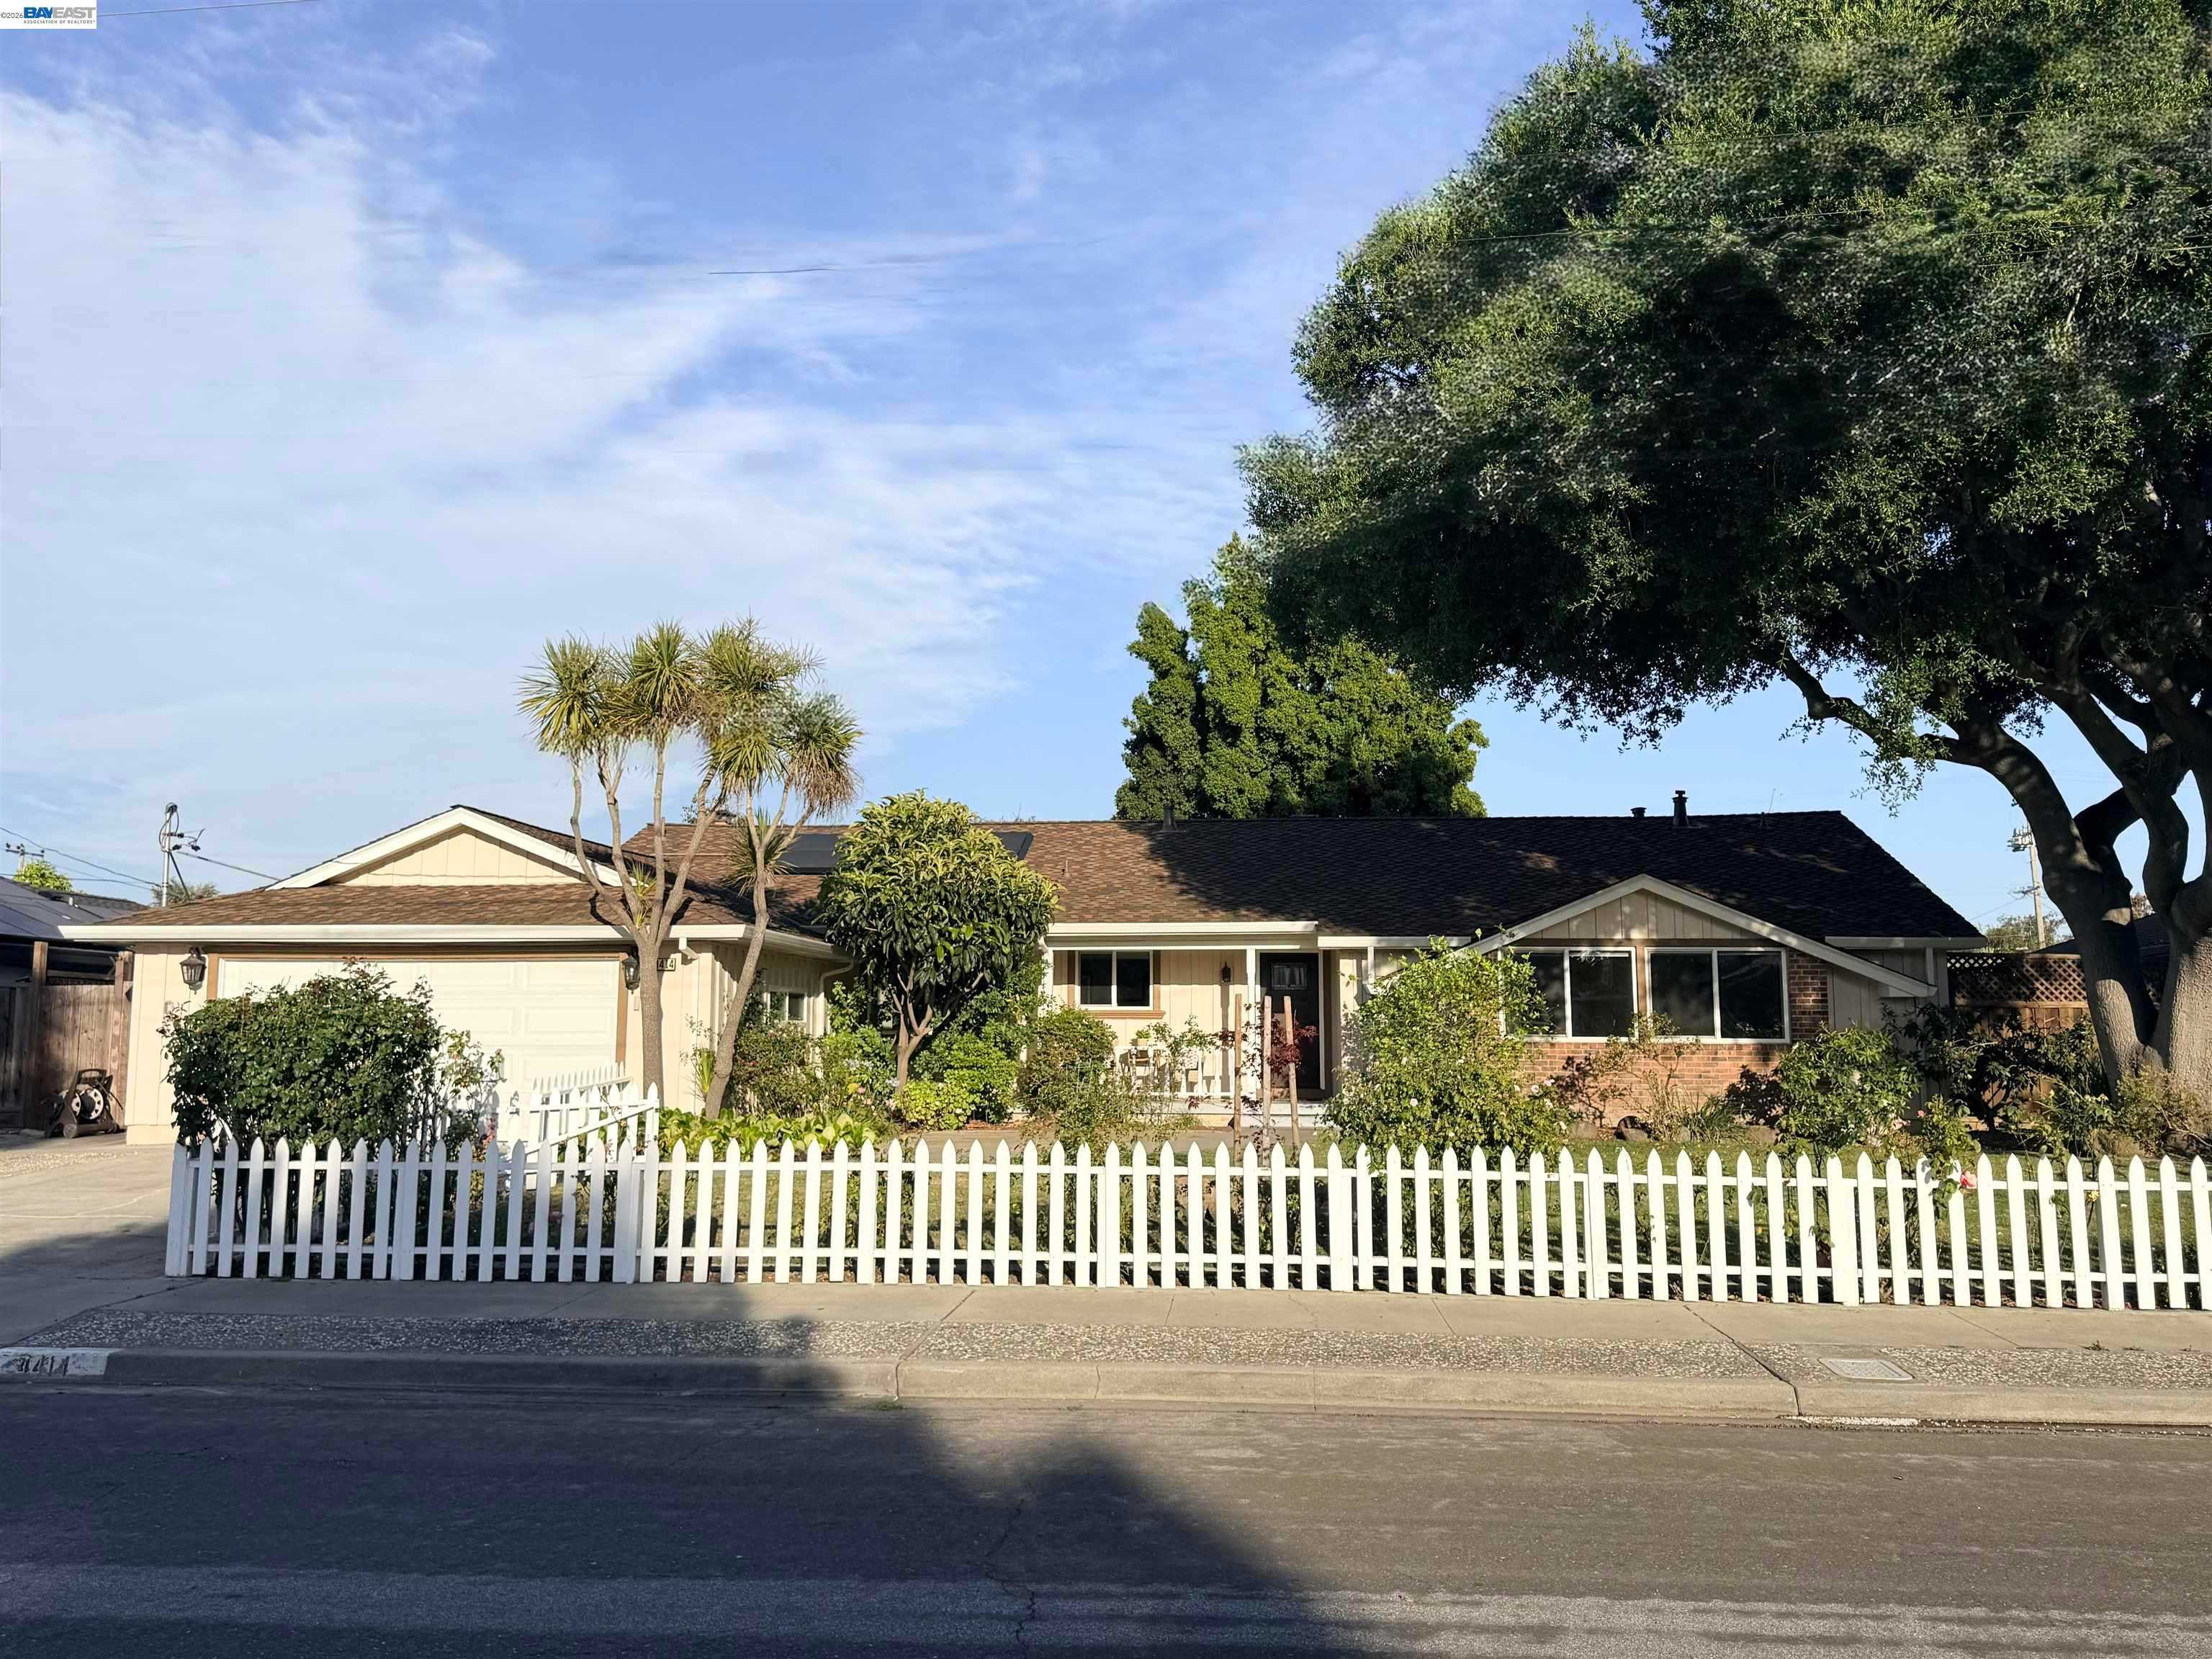
Behind these county totals: hundreds of homes still for sale in Fremont, Hayward, Union City, Newark and Milpitas, counted, priced and sorted every morning from the same MLS export, with a map search for the homes themselves.
30-Year Fixed: 6.89% unchanged | 15-Year Fixed: 6.49% unchanged
Rates have not moved since Friday, and the scary headline about why they might does not survive a close read. Mortgage News Daily does not publish on a federal holiday, so Monday produced no reading and both rates above are still Friday’s close. The next real print lands this afternoon.
The headline worth examining. The dollar’s share of global central bank reserves has fallen from 64% in 2015 to 56% in 2025. The worry writes itself: if the world stops parking money in dollars, it stops buying Treasuries, yields rise, and mortgage rates follow. Since that chain ends at your monthly payment, it is worth knowing whether the first link is real.
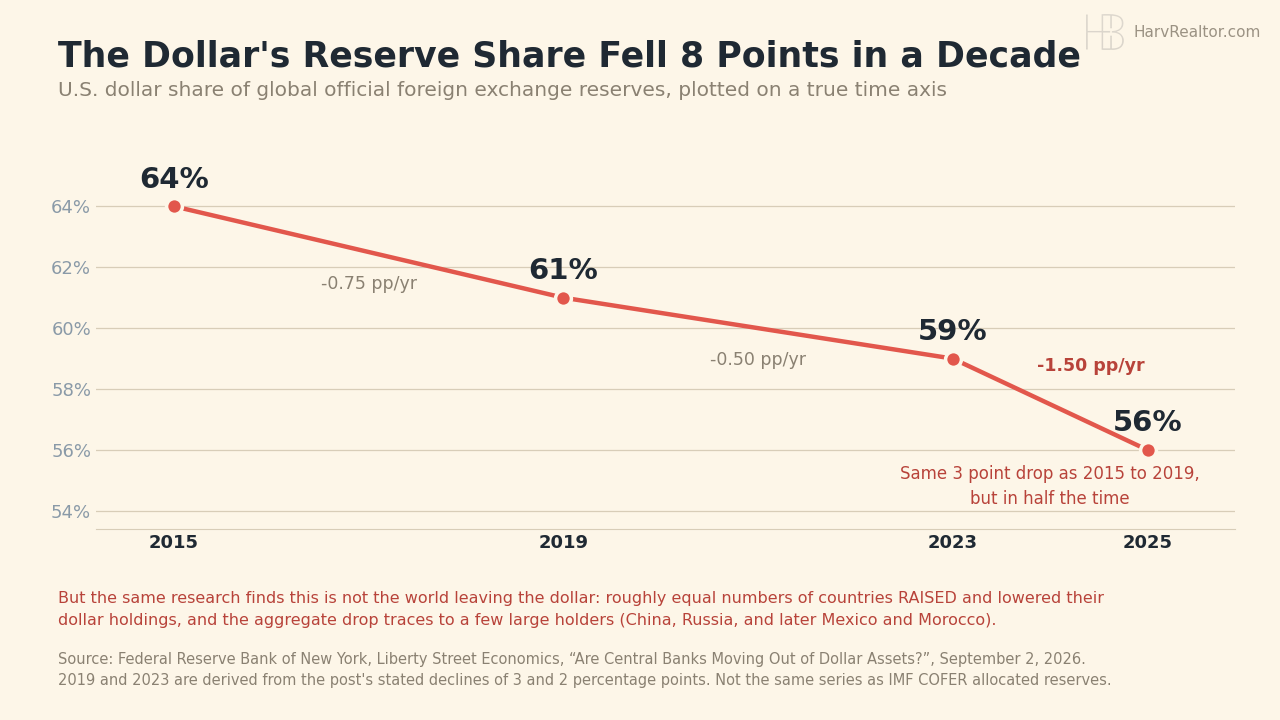
Two things in the underlying New York Fed research cut against the alarming version. Roughly equal numbers of countries raised their dollar holdings as lowered them. And the entire aggregate decline traces to a handful of large holders, chiefly China and Russia, with Mexico and Morocco joining later; among countries with complete data only Brazil and Hong Kong meaningfully cut. That is a few big players rebalancing, not a world walking away from the dollar. It is not what decides your rate this year. The August jobs report and the Fed meeting on September 16 are.
Locally, inventory kept building through the long weekend. Board wide: 2,620 listings across the 15 city table, counting active and in contract together, with 235 coming soon and 124 brand new. The five city ledger now carries 695 live listings across Fremont, Hayward, Milpitas, Newark and Union City, 588 already on the market and 107 coming soon. That is up from 684 yesterday, and 74 arrived in the past week.
Fremont holds 267 live listings, 208 active, 44 coming soon and 15 brand new, with a median on market list price of $1,228,888 at $823 a square foot and a typical active listing 27 days out. Behind it: Hayward 182, Milpitas 115, Newark 76 and Union City 55. Across all five cities the median is $1,082,500 at $697 a square foot, 271 homes are under a million, and 155 have been sitting 60 days or longer.
More choice is genuinely good news if you have been losing out on offers. The pressure sits on the other side of the table: better than one in four homes on the market has now been waiting two months or more. When a listing sits that long in a market this thin, the problem is almost never the market. It is the price.
S&P 500: 7,718.60 -0.38% | Dow: 53,414.25 -0.51% | Nasdaq: 26,506.99 -0.29%
Those are Friday’s closing levels, still the most recent completed session because markets were shut Monday for Labor Day. There was no Monday tape to report.
As of 8:01 AM PT this morning the reopening is mixed to soft: the S&P near 7,693 and the Nasdaq near 26,444, each off roughly a quarter to a third of a percent from Friday, with the Dow the weak one near 52,854, down about 1.05%. Those are live intraday quotes and will move before the bell.
Two items worth noting. Google and Apple are both scouting Australia for AI data centers, drawn by clean power and proximity to Asia, with the country potentially attracting $107 billion of investment by 2030. And Uber is lining up its first ever euro denominated bond sale, joining nearly $145 billion of euro bonds sold by U.S. companies this year against a record $4.9 trillion of global corporate issuance.
10-Year Treasury: 4.78% +0.01 | Gold: $4,476.60 -0.96% | Silver: $66.75 -1.23% | Brent: $96.28 +0.80%
China’s central bank bought 650,000 troy ounces of gold in August, its biggest month in nearly three years and its 22nd consecutive month of buying, a streak that began in November 2024. Reserves now sit at a record 76.73 million ounces, roughly 2,387 metric tons.
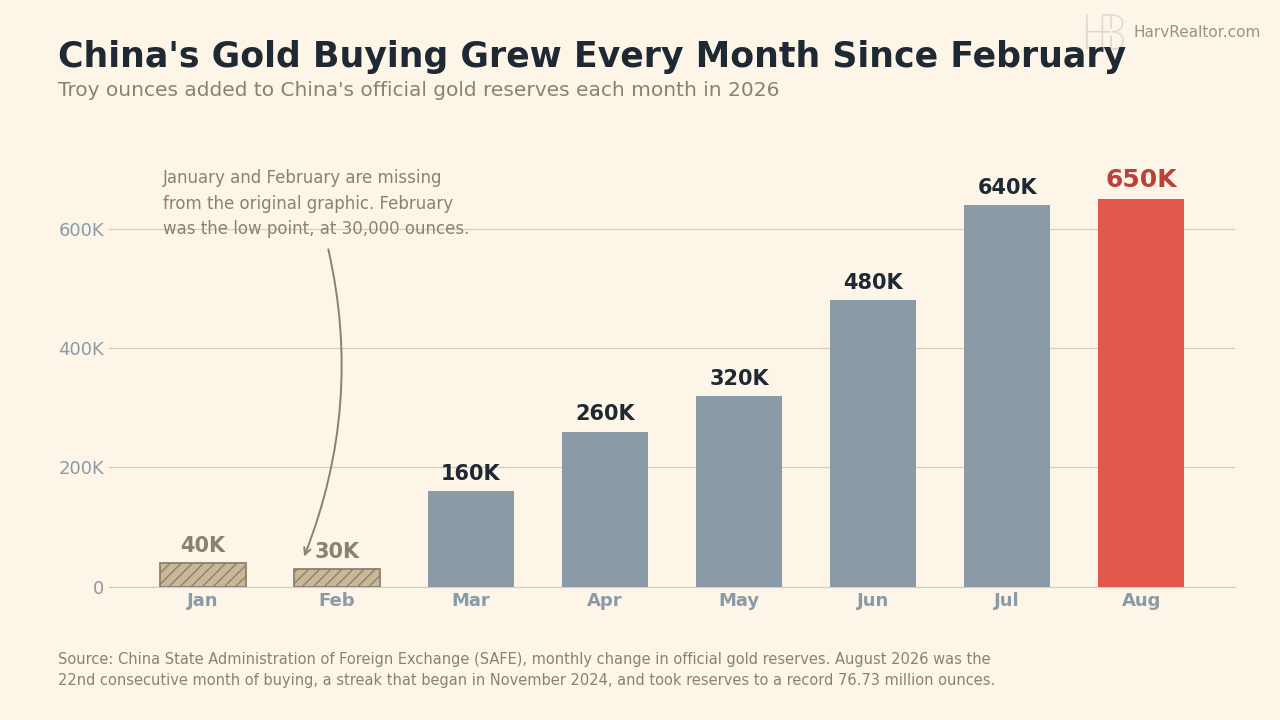
The shape matters more than the headline. China added just 40,000 ounces in January and 30,000 in February, then bought more every single month after that, finishing at 650,000 in August. That is better than a twenty fold acceleration inside eight months. A central bank buying gold every month for nearly two years is diversifying away from something, and this is the same story as the reserve chart above, seen from the other side.
Copper also set an all time high, at $14,533 a ton in London, up about 47% in a year, as traders rushed metal into the United States ahead of possible tariffs. Copper runs through wiring, panels and plumbing, so that lands directly in construction and renovation budgets.
A note on today’s newsletter numbers, because three did not hold up. It quoted the 10-Year at 4.77% as of September 7, but Monday was a federal holiday and Treasury published no yield curve at all that day; the last real reading is 4.78% from Friday. It put Brent at $97.24 against the ICE front month settlement of $96.28, and gold at $4,469 on a holiday session that never settled.
Bitcoin: $78,545 -0.80% | Ethereum: $2,484.48 -0.19% | XRP: $1.42 +1.35%
Live quotes pulled at 8:01 AM PT with 24 hour changes, since crypto ran straight through the holiday. Bitcoin is soft near $78,500 and XRP is the only one of the three in the green.
One newsletter claim needs correcting outright. Market Briefs reported that Bitcoin rose 22.4% in the week ending September 4 and called it the best week since March 2024. Bitcoin closed that week at $79,824 against $78,246 the Thursday before, a gain of 2.0%, not 22.4%. The decimal wandered. The companion claim that it briefly crossed $82,000 is true: it touched $82,262 on September 2.
The real news is a security incident. Hackers took about $320 million from the Liquid Network, a Bitcoin sidechain several exchanges use to move coins, by exploiting how the network mints its wrapped version of Bitcoin. The network paused transactions in response.
Sources
- Mortgage News Daily (30 and 15 year fixed, September 4 close)
- Federal Reserve Bank of New York, Liberty Street Economics (dollar reserve share, September 2, 2026)
- China State Administration of Foreign Exchange (official gold reserves, August 2026)
- China gold reserves, quarterly tonnage (used to cross check the monthly additions)
- U.S. Treasury daily yield curve (10 year, September 4)
- COMEX gold and silver front month and ICE Brent front month (Friday settlements)
- CoinGecko (Bitcoin, Ethereum and XRP, live at 8:01 AM PT September 8)
- REALTY EXPERTS® Live Inventory (five city ledger, September 8)
Disclaimer: The market data, rates, and information provided are for informational purposes only and should not be considered financial advice. Always verify rates and data with your lender or financial advisor before making any decisions.