



"At a Glance" Local Housing STATS and News 09/07/26
September 7, 2026 · Alameda County Market Dashboard
TODAY'S LIVE INVENTORY
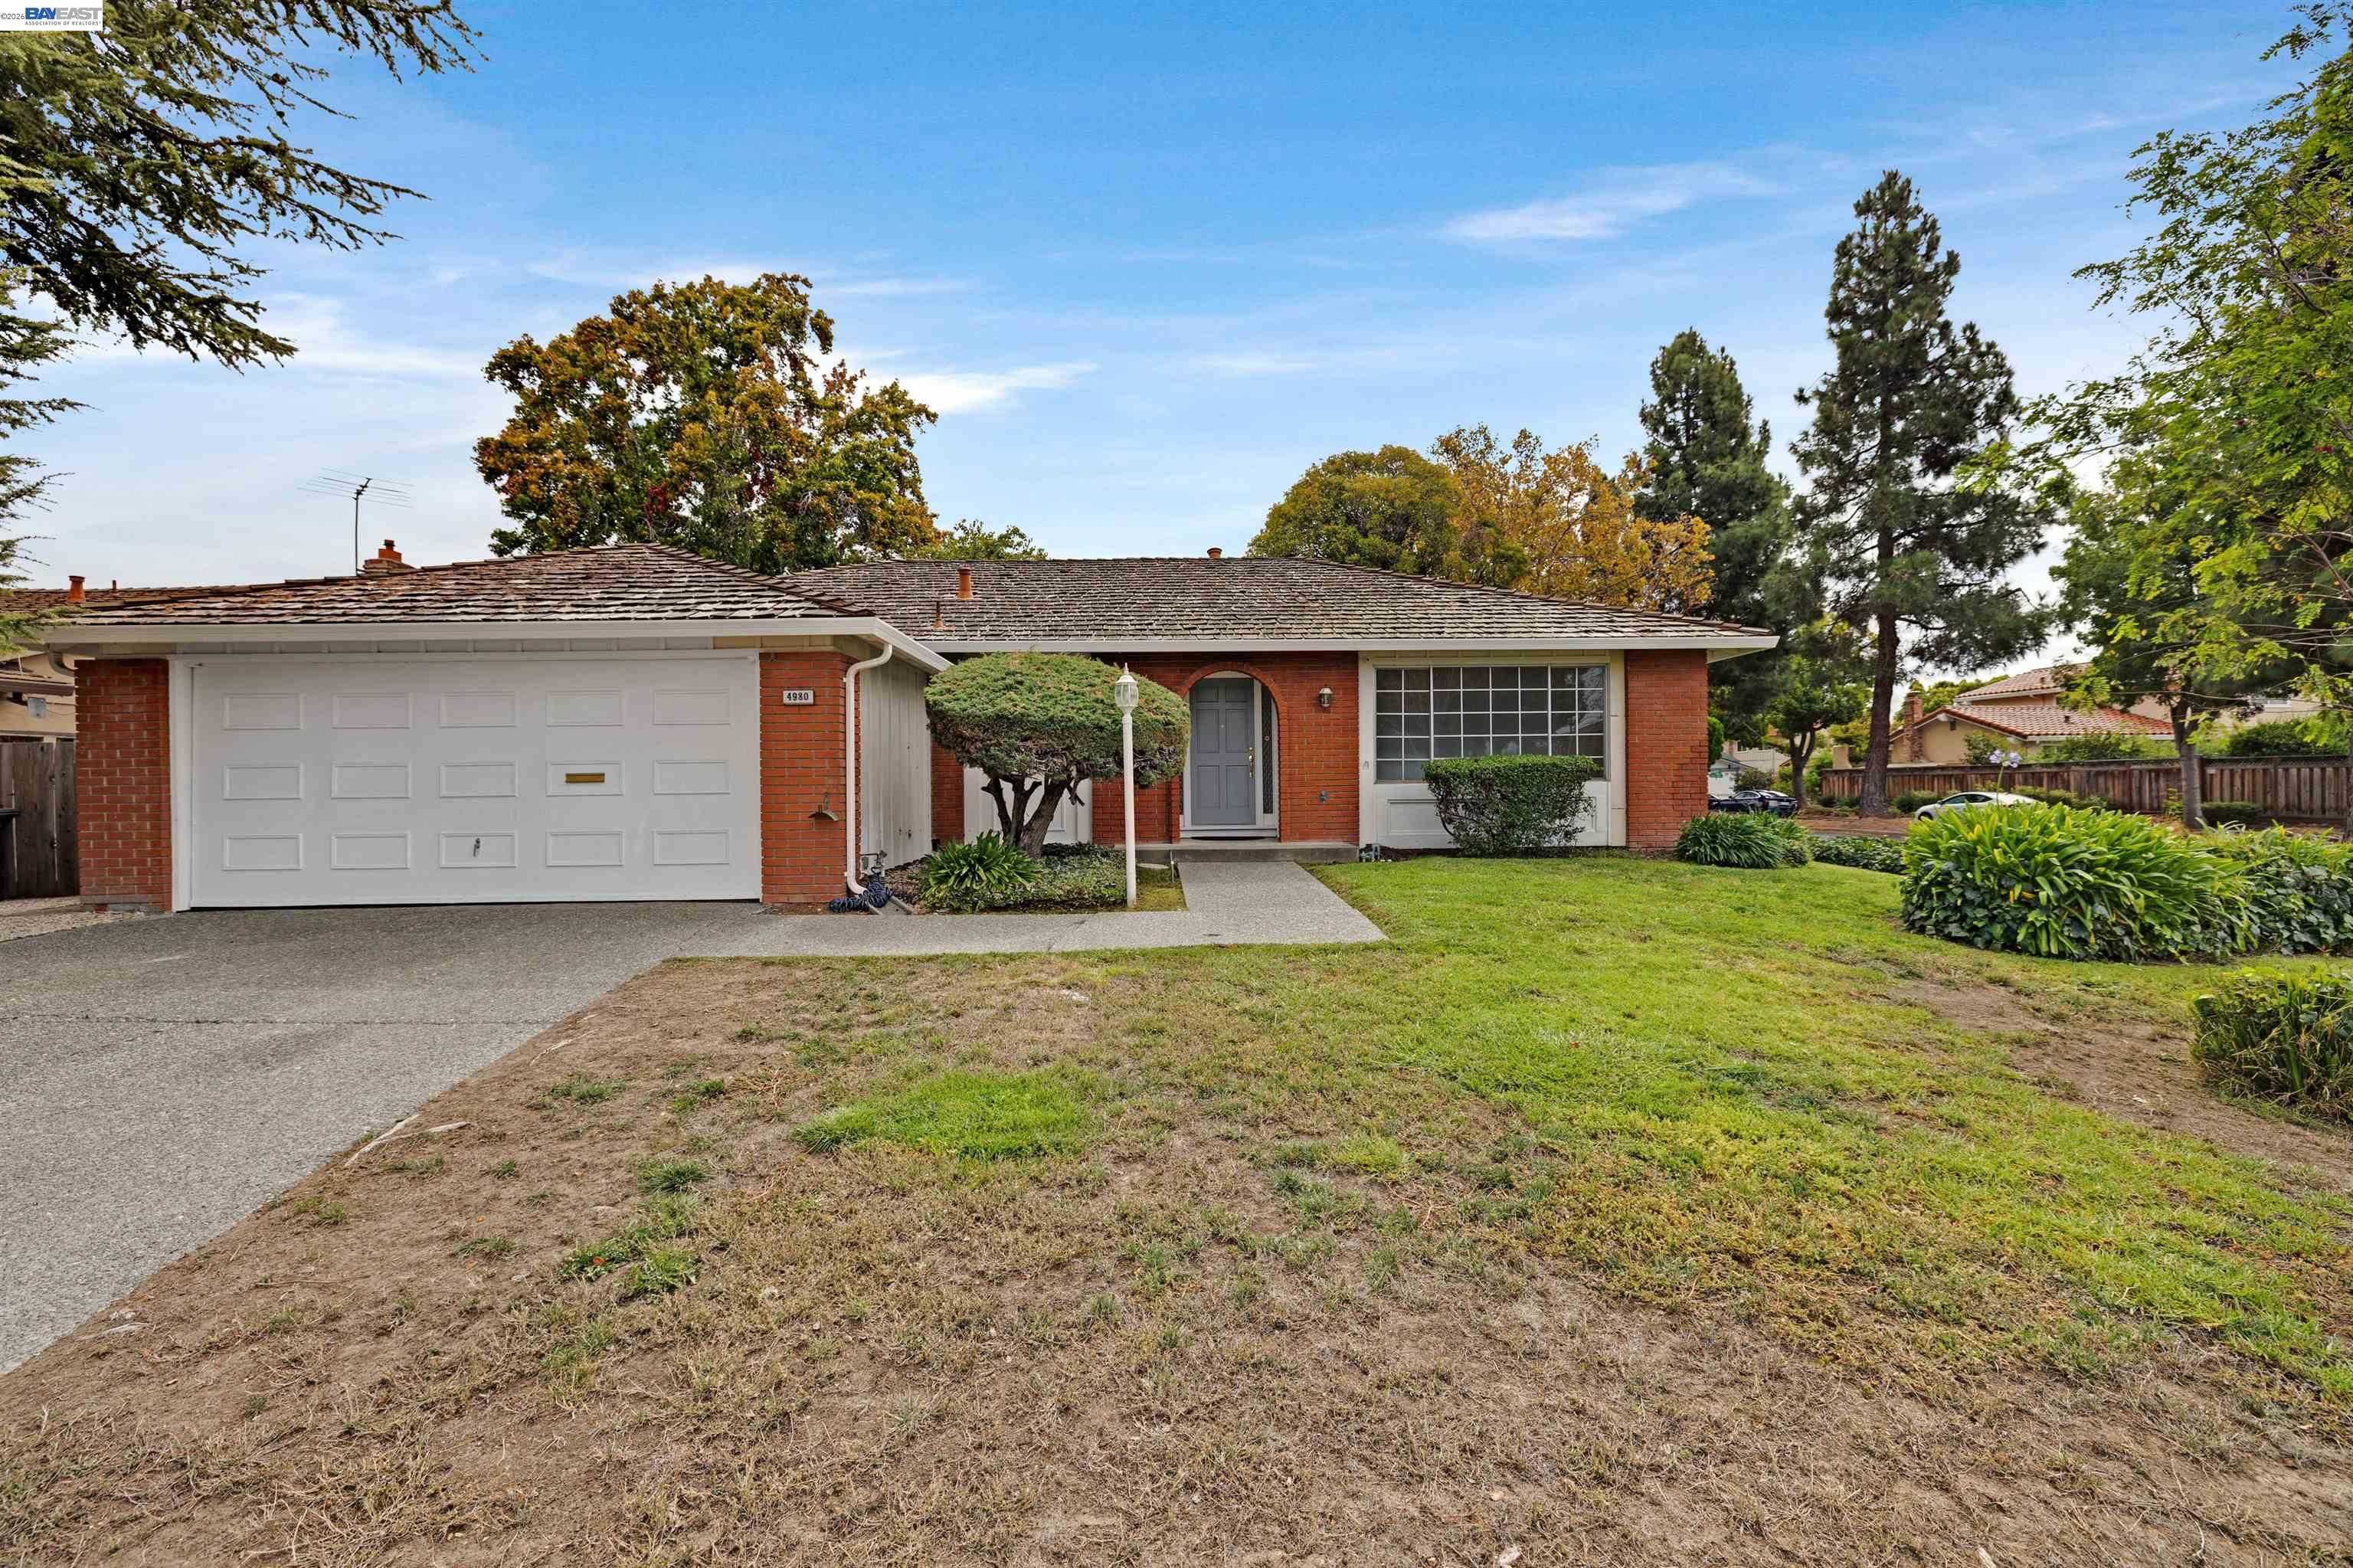
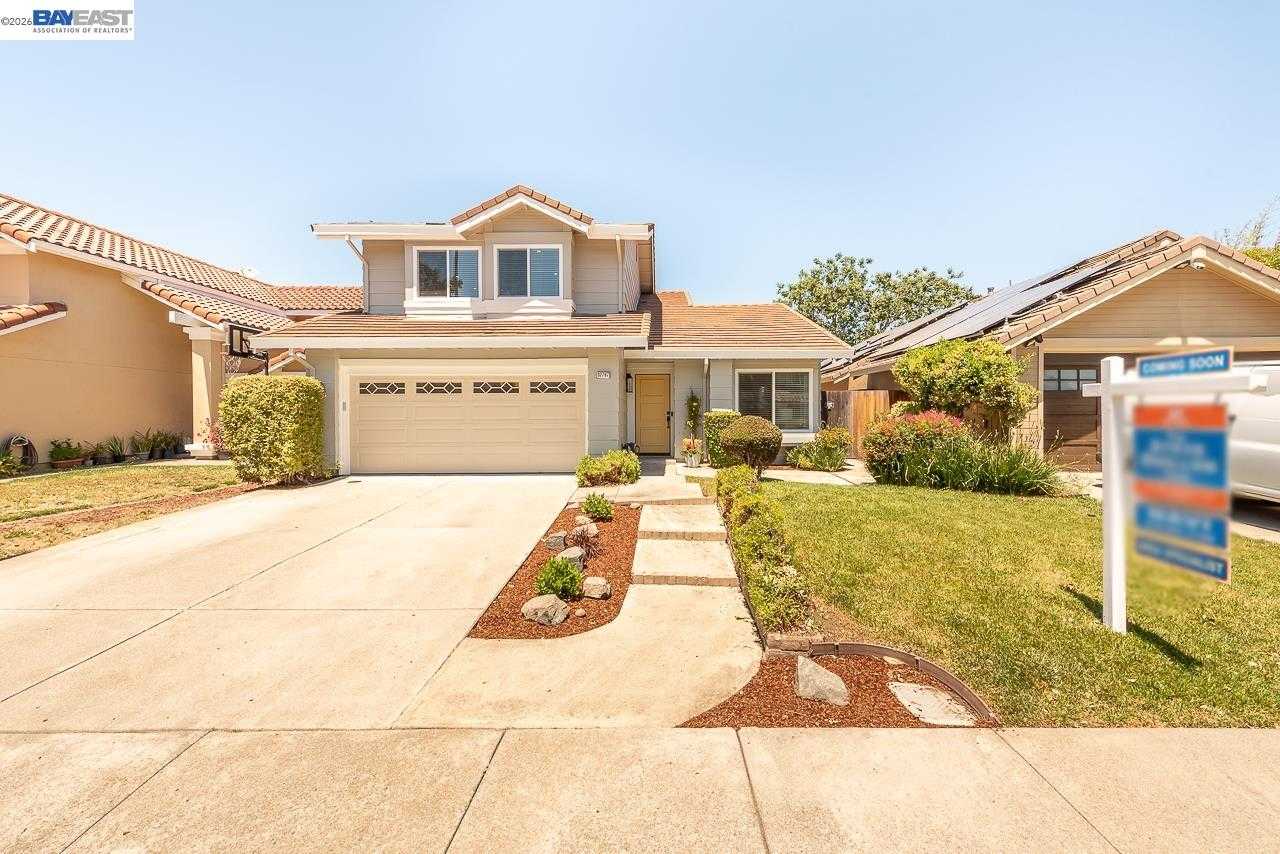
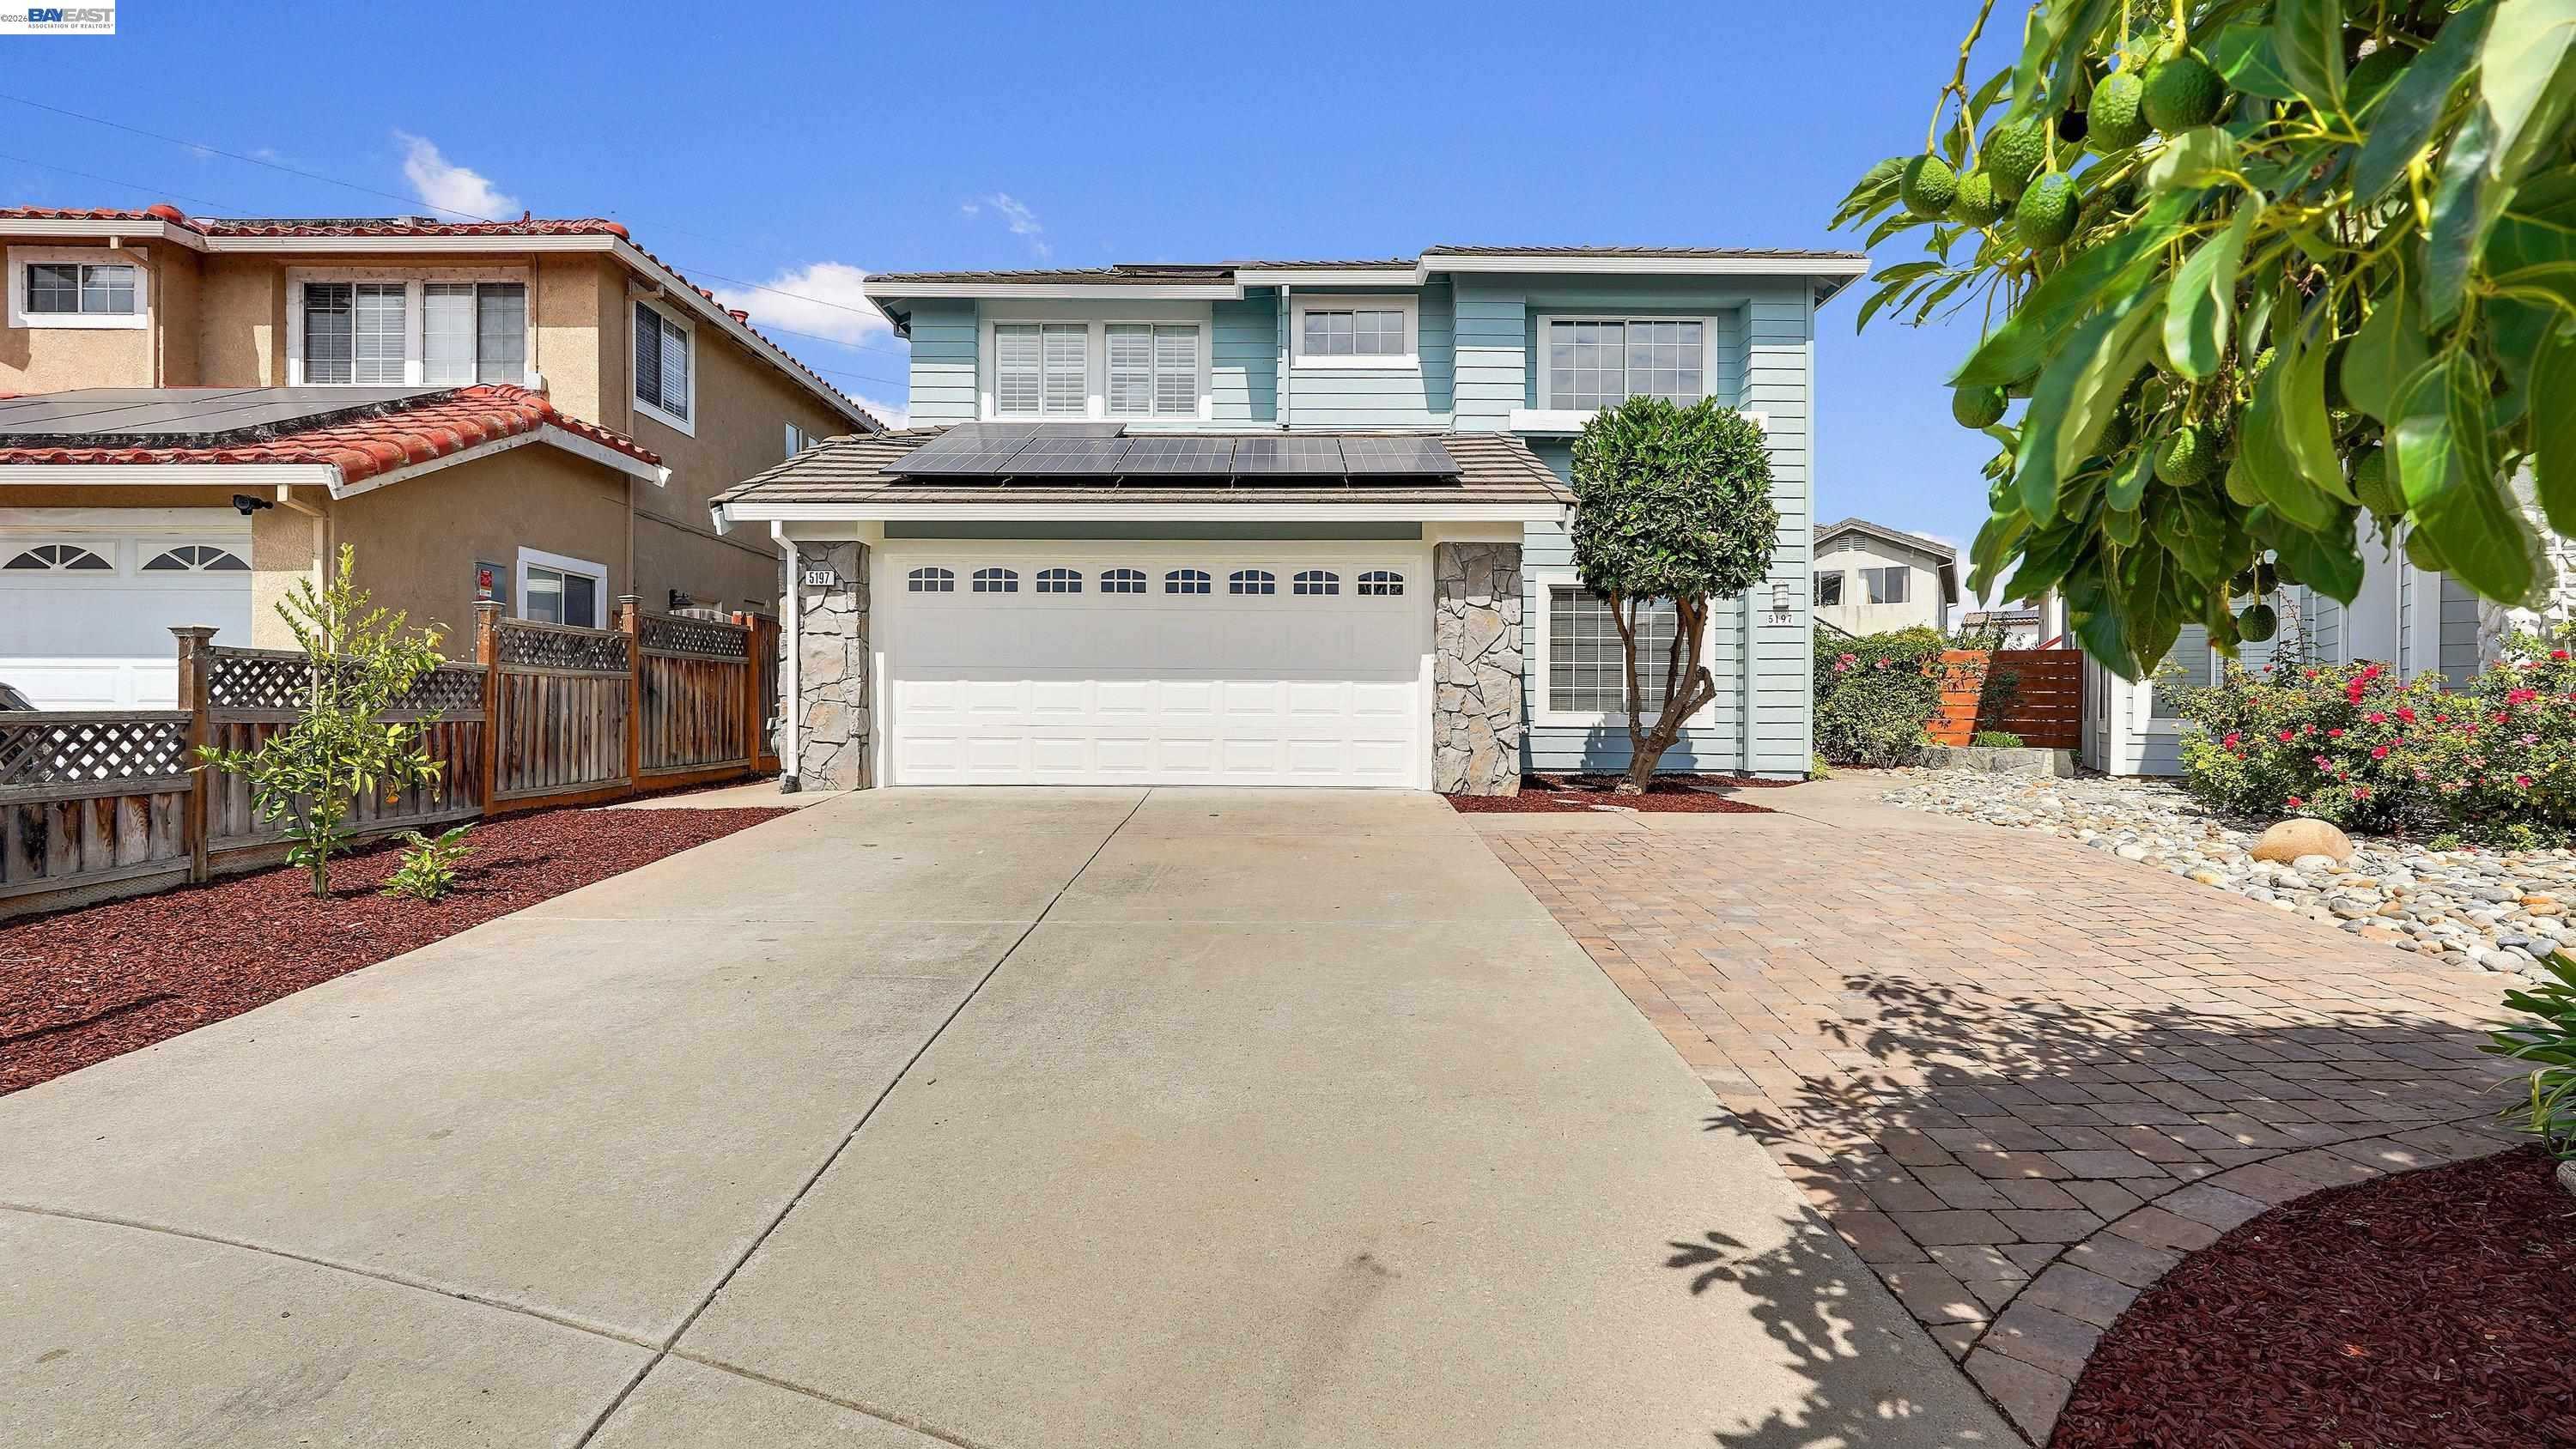
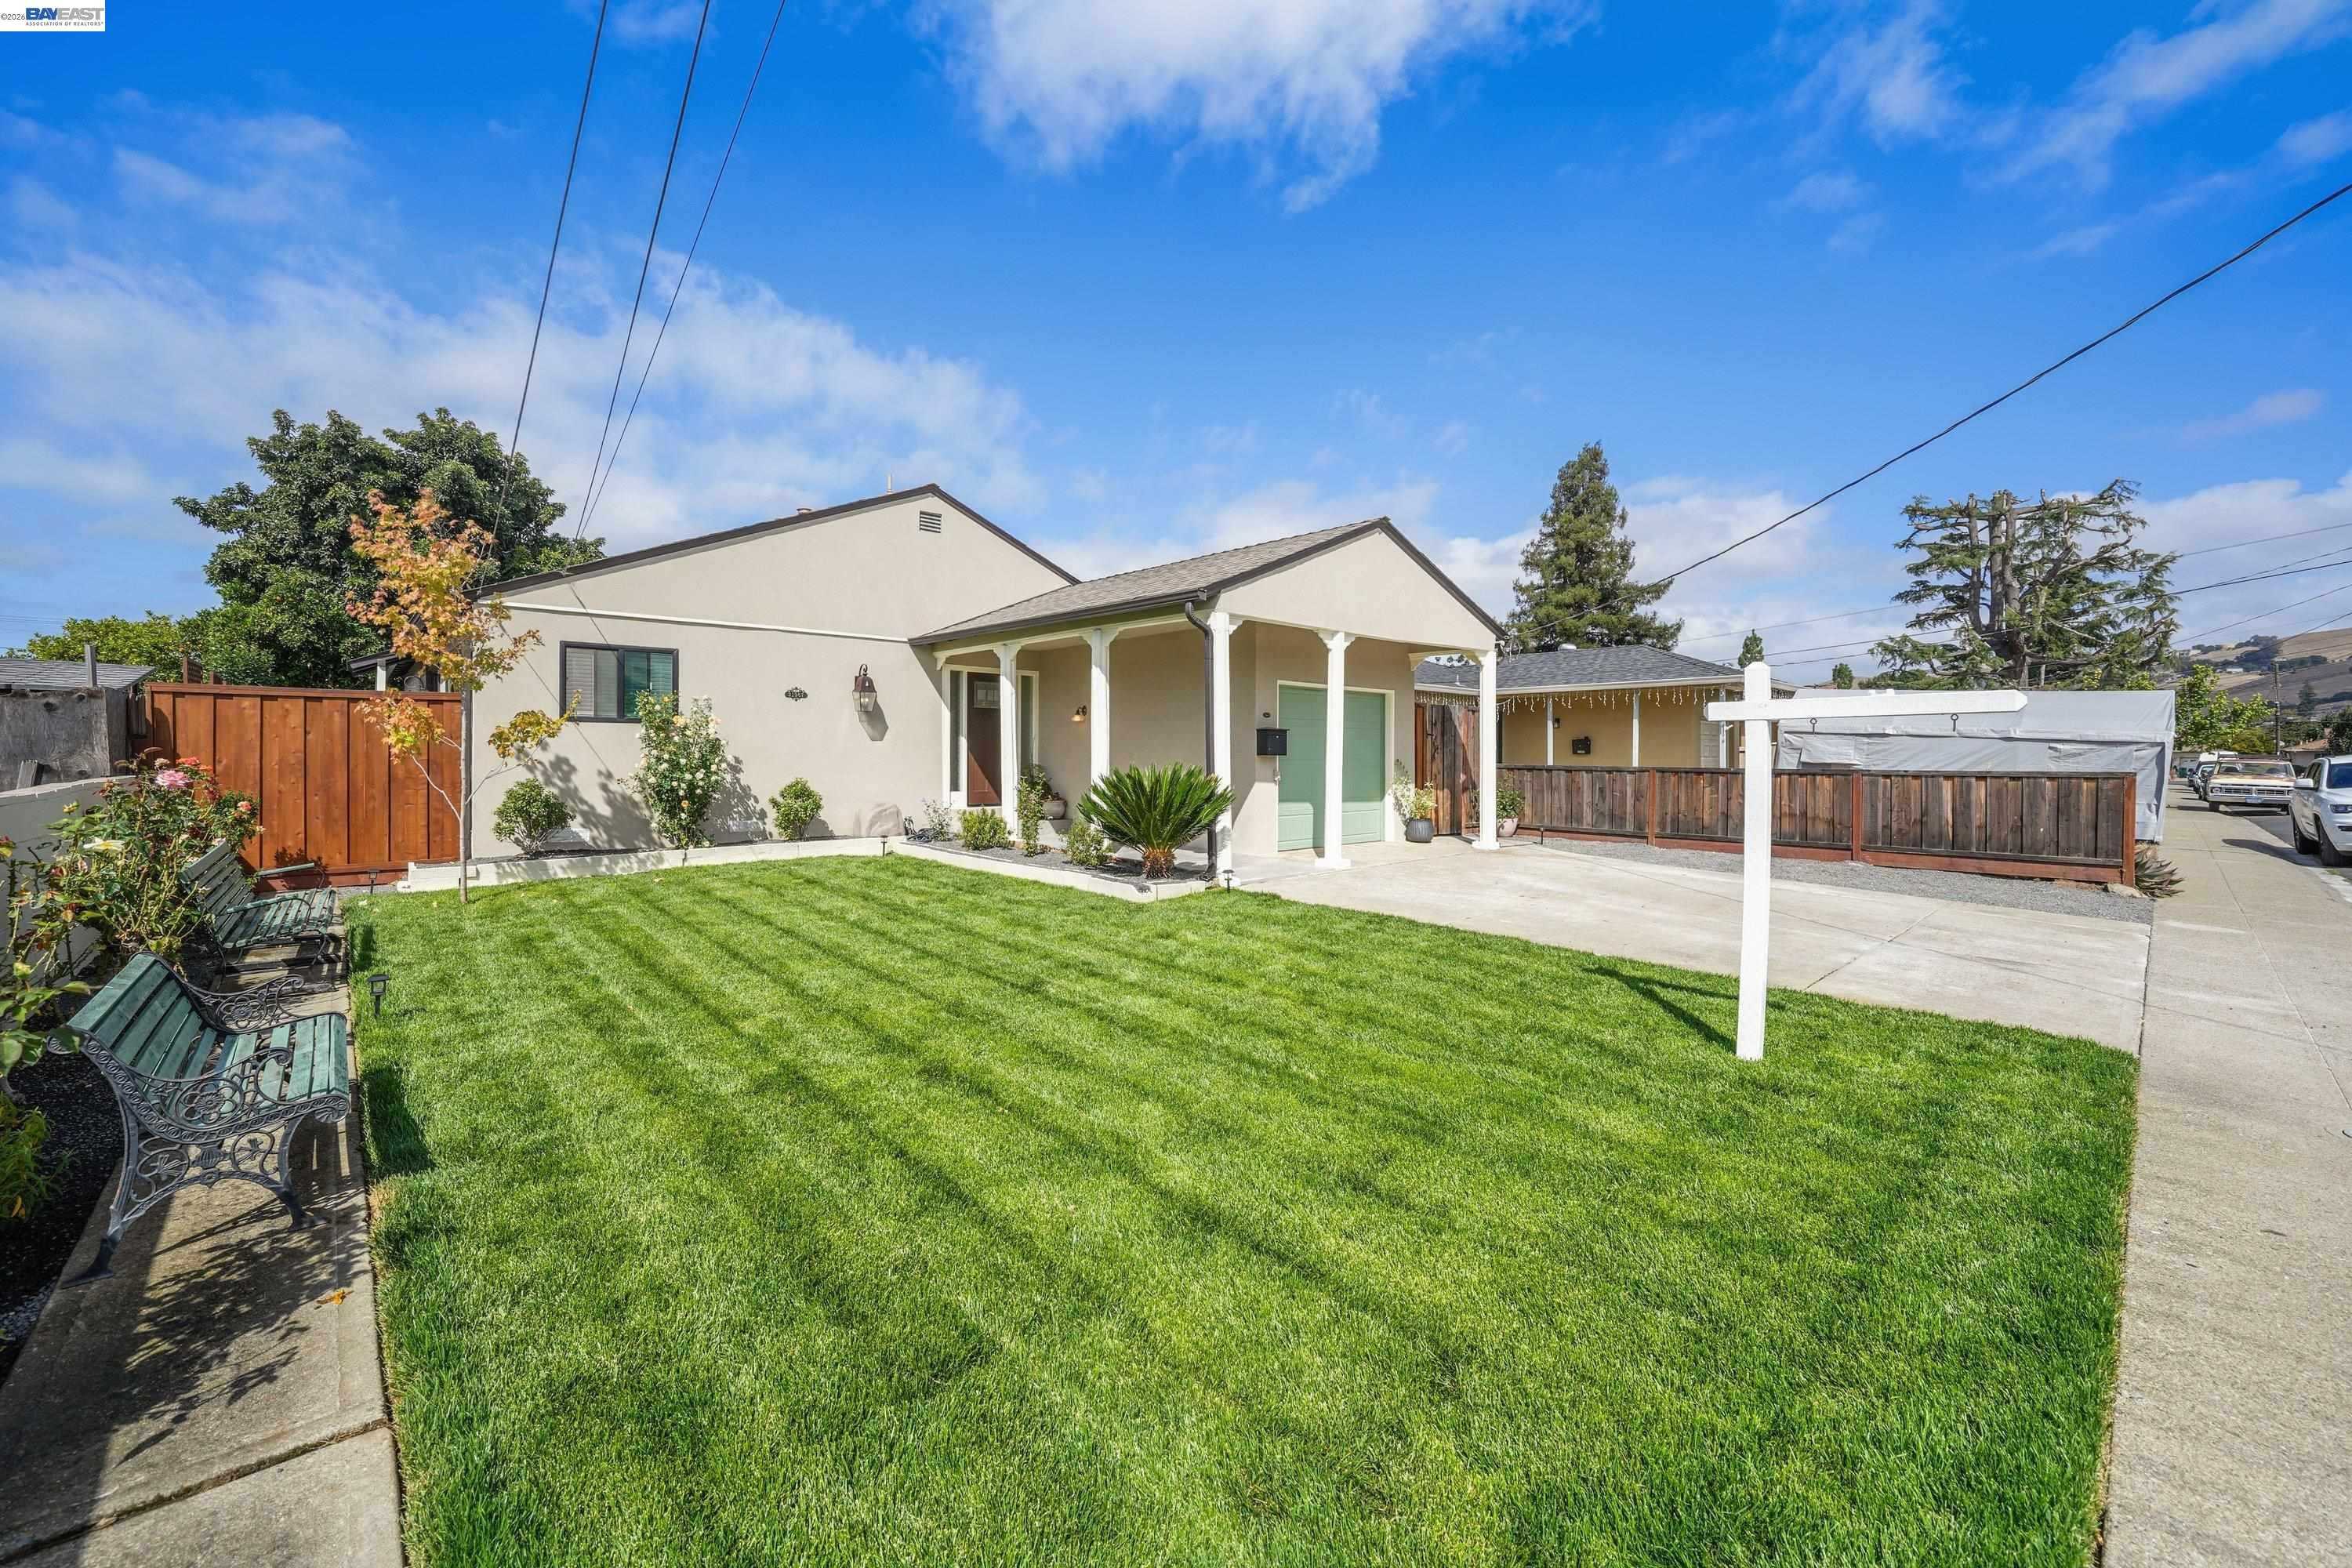
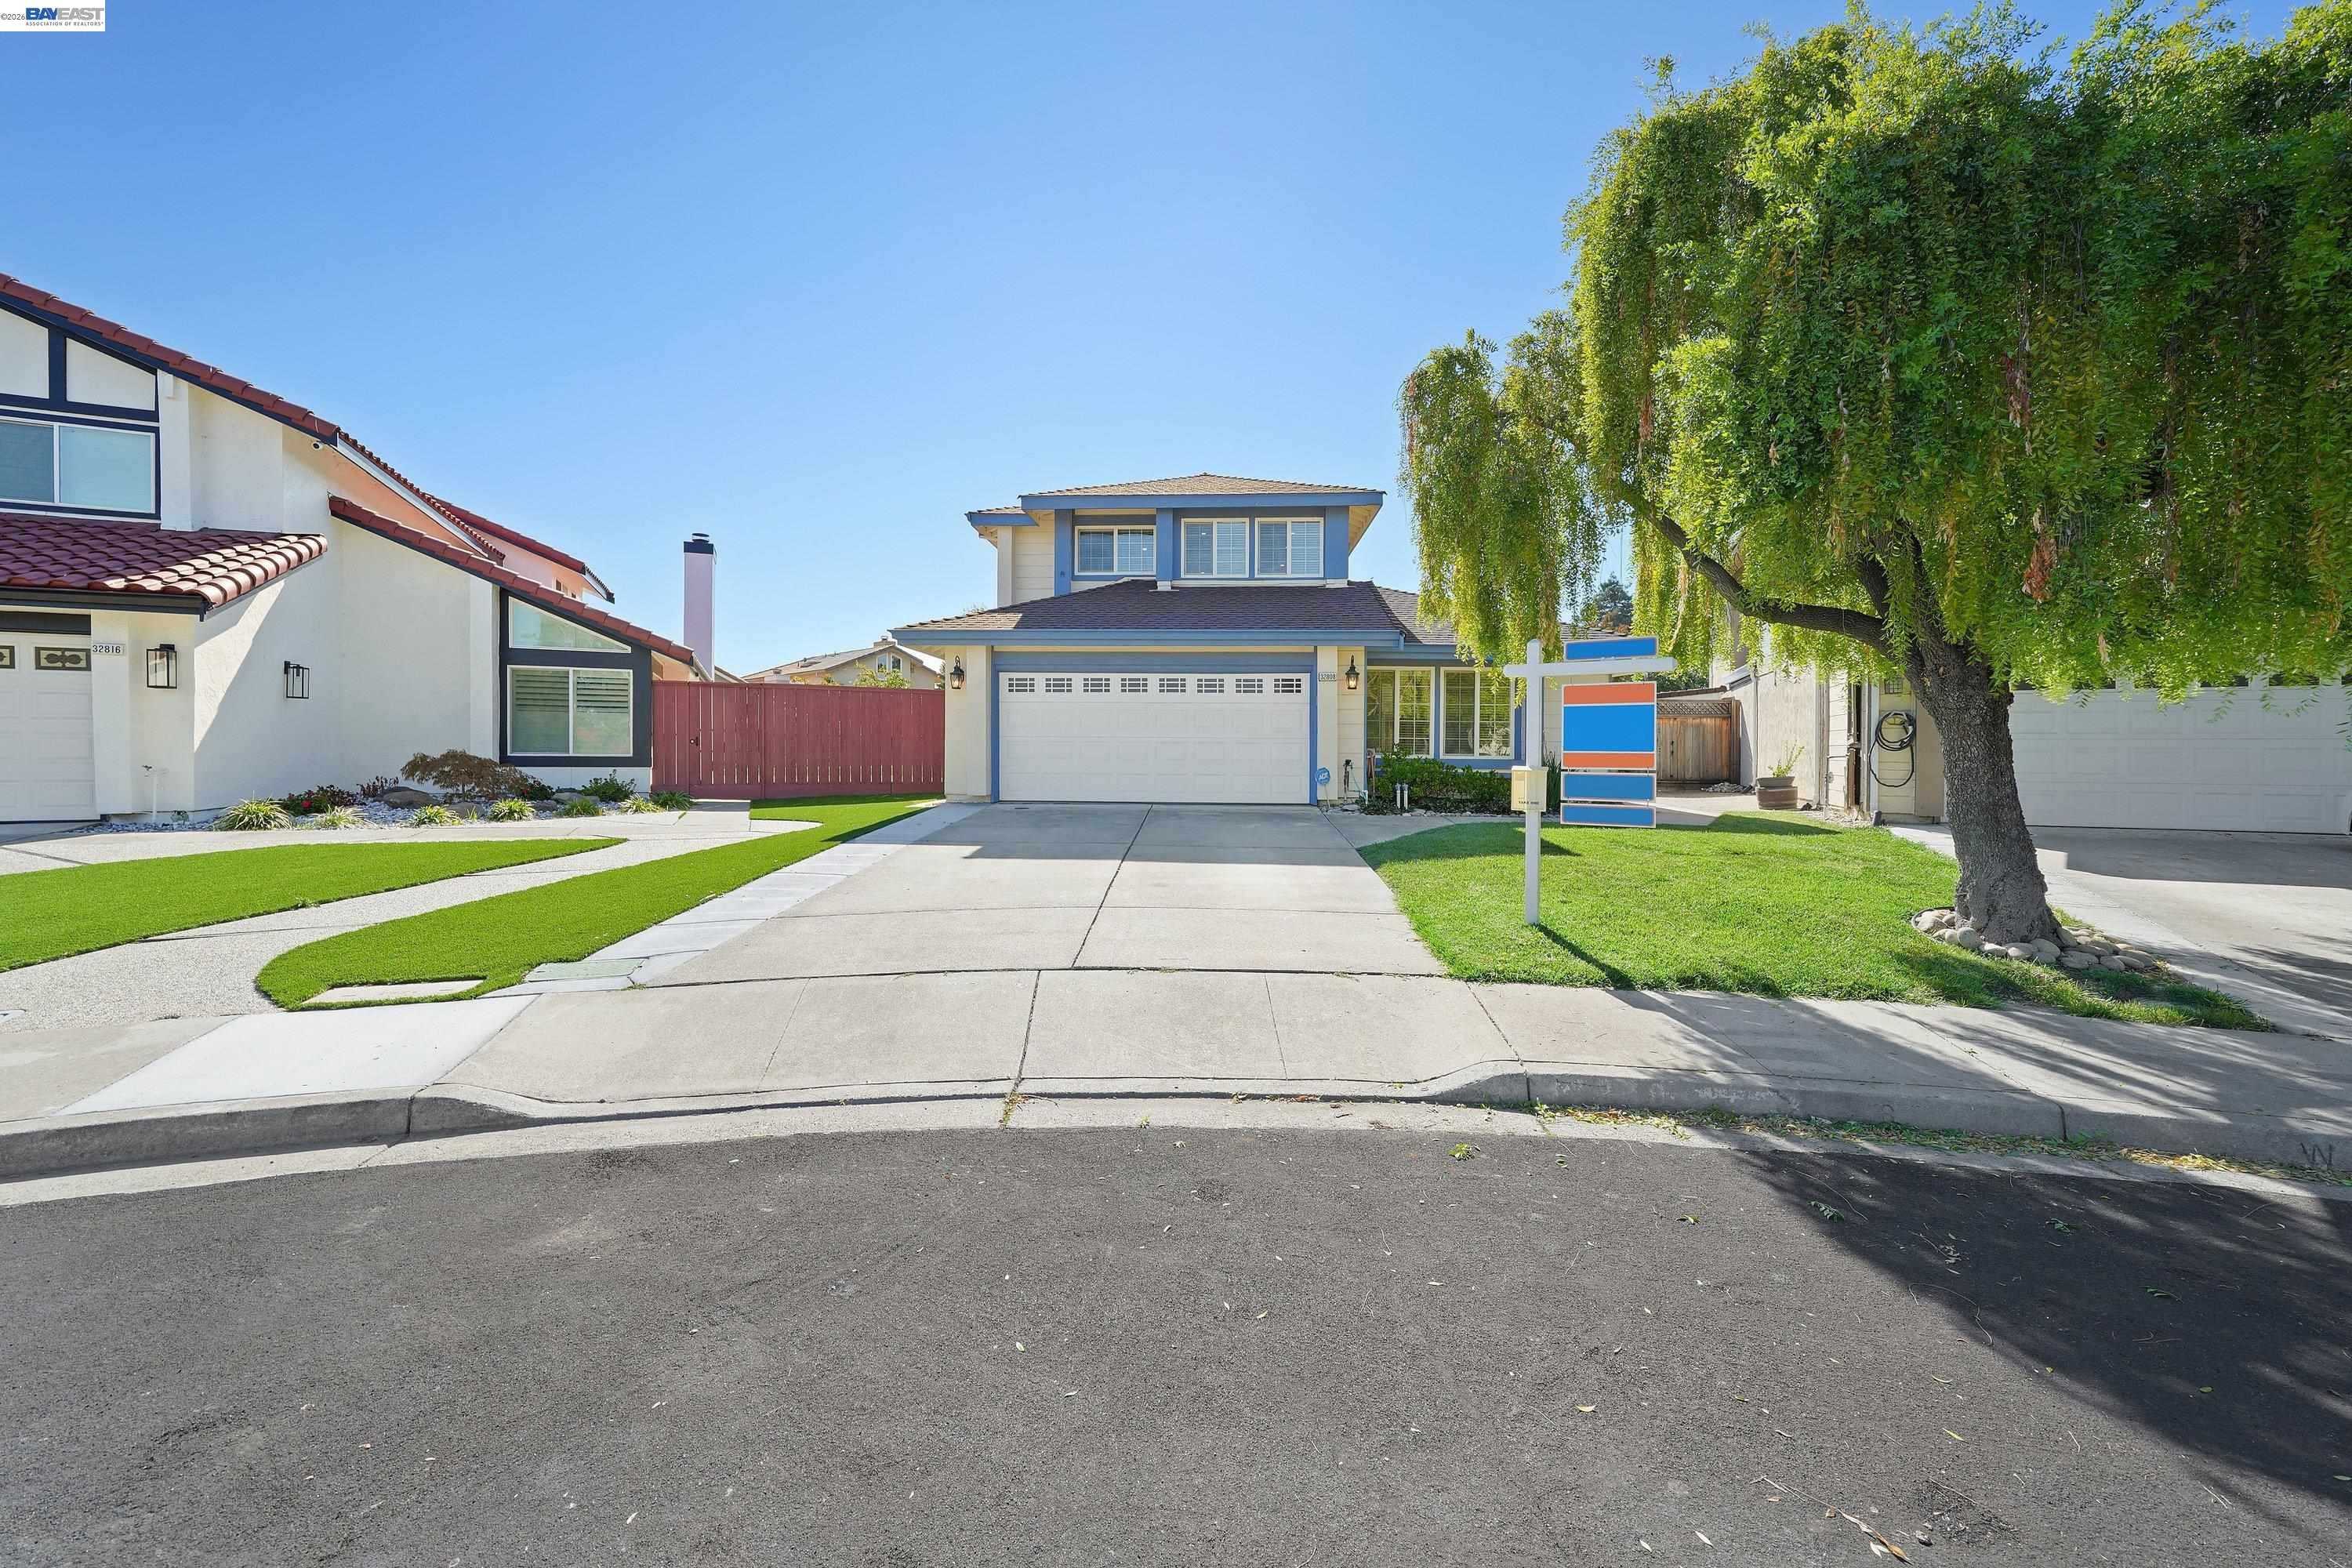
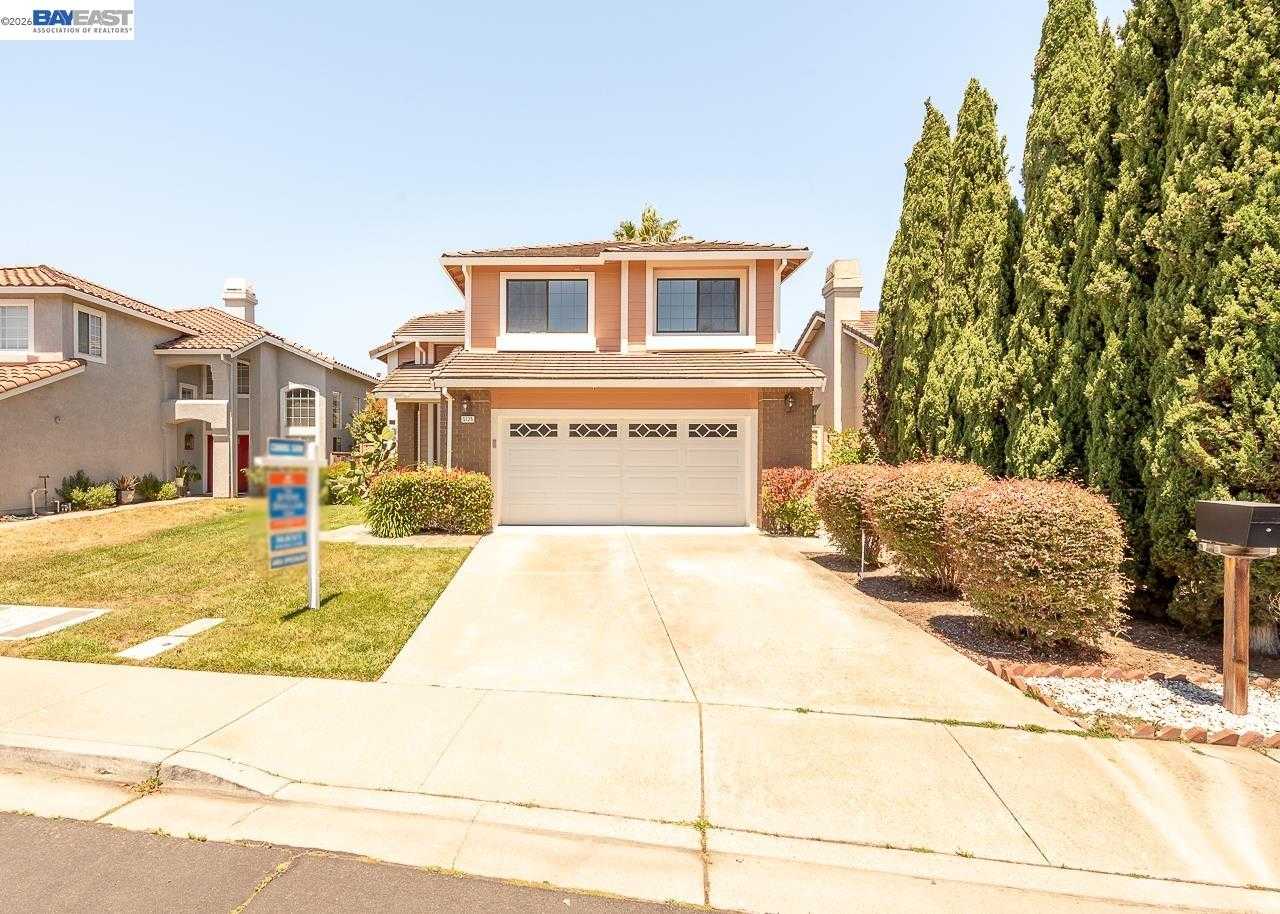
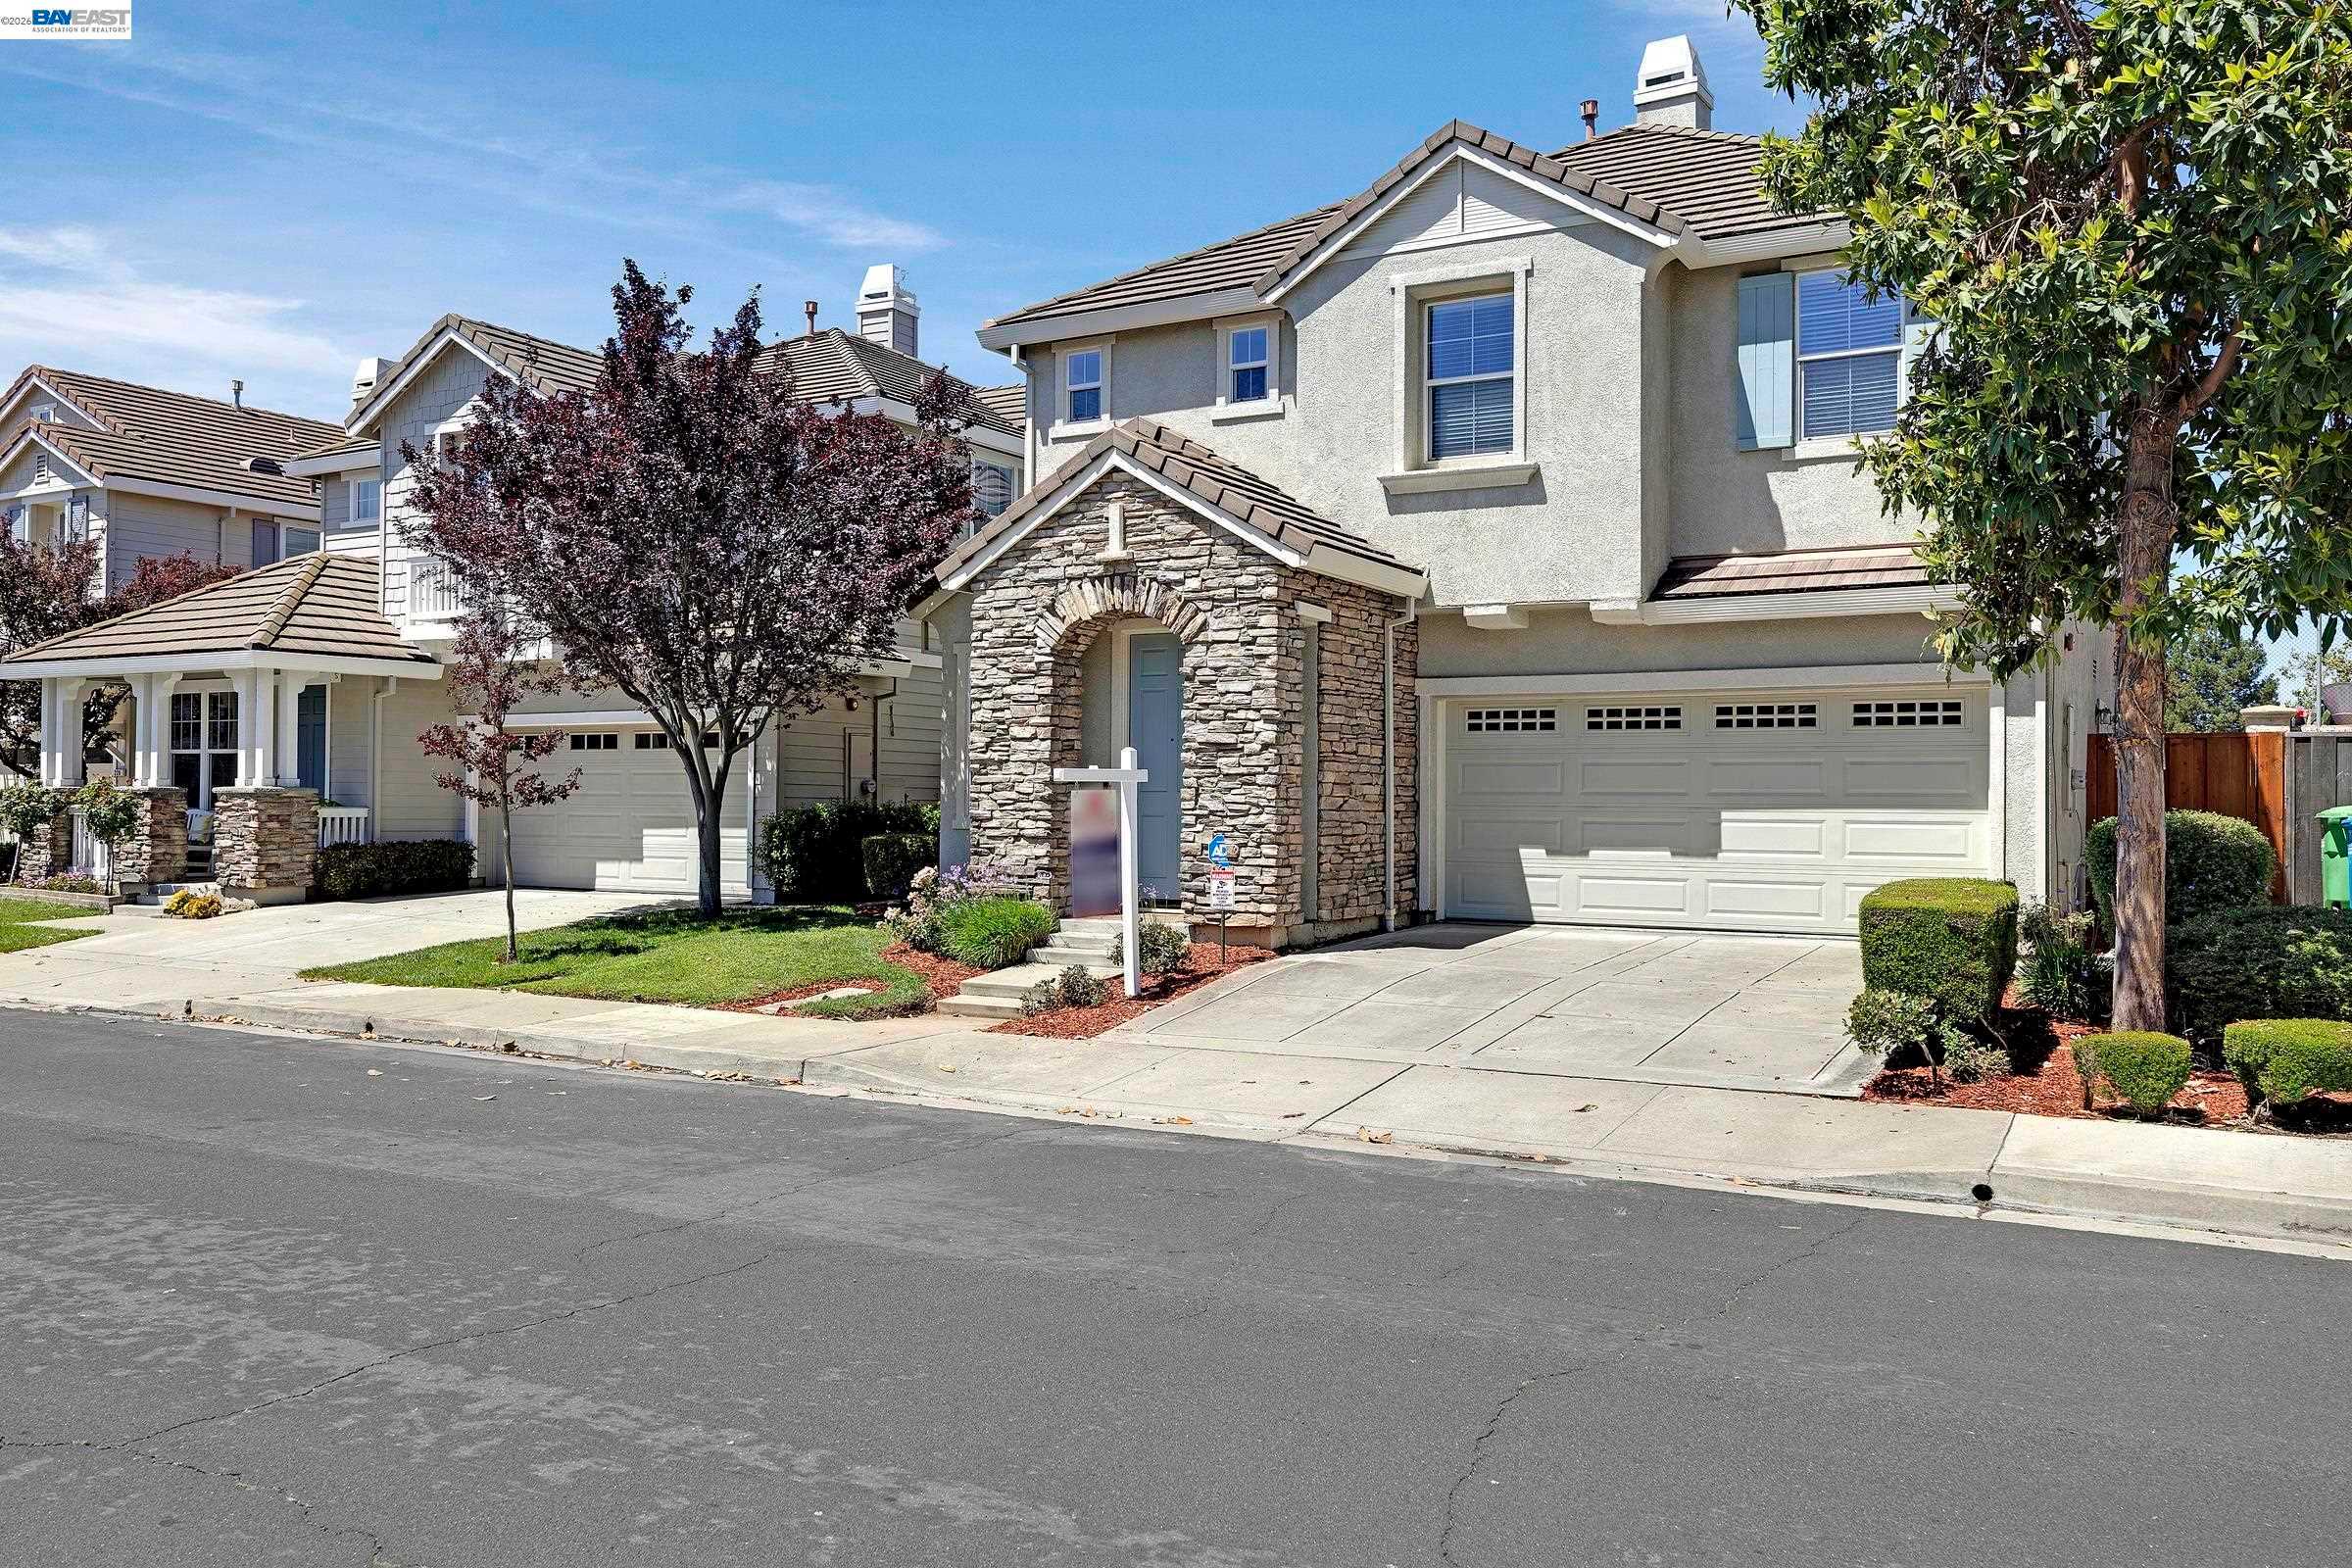
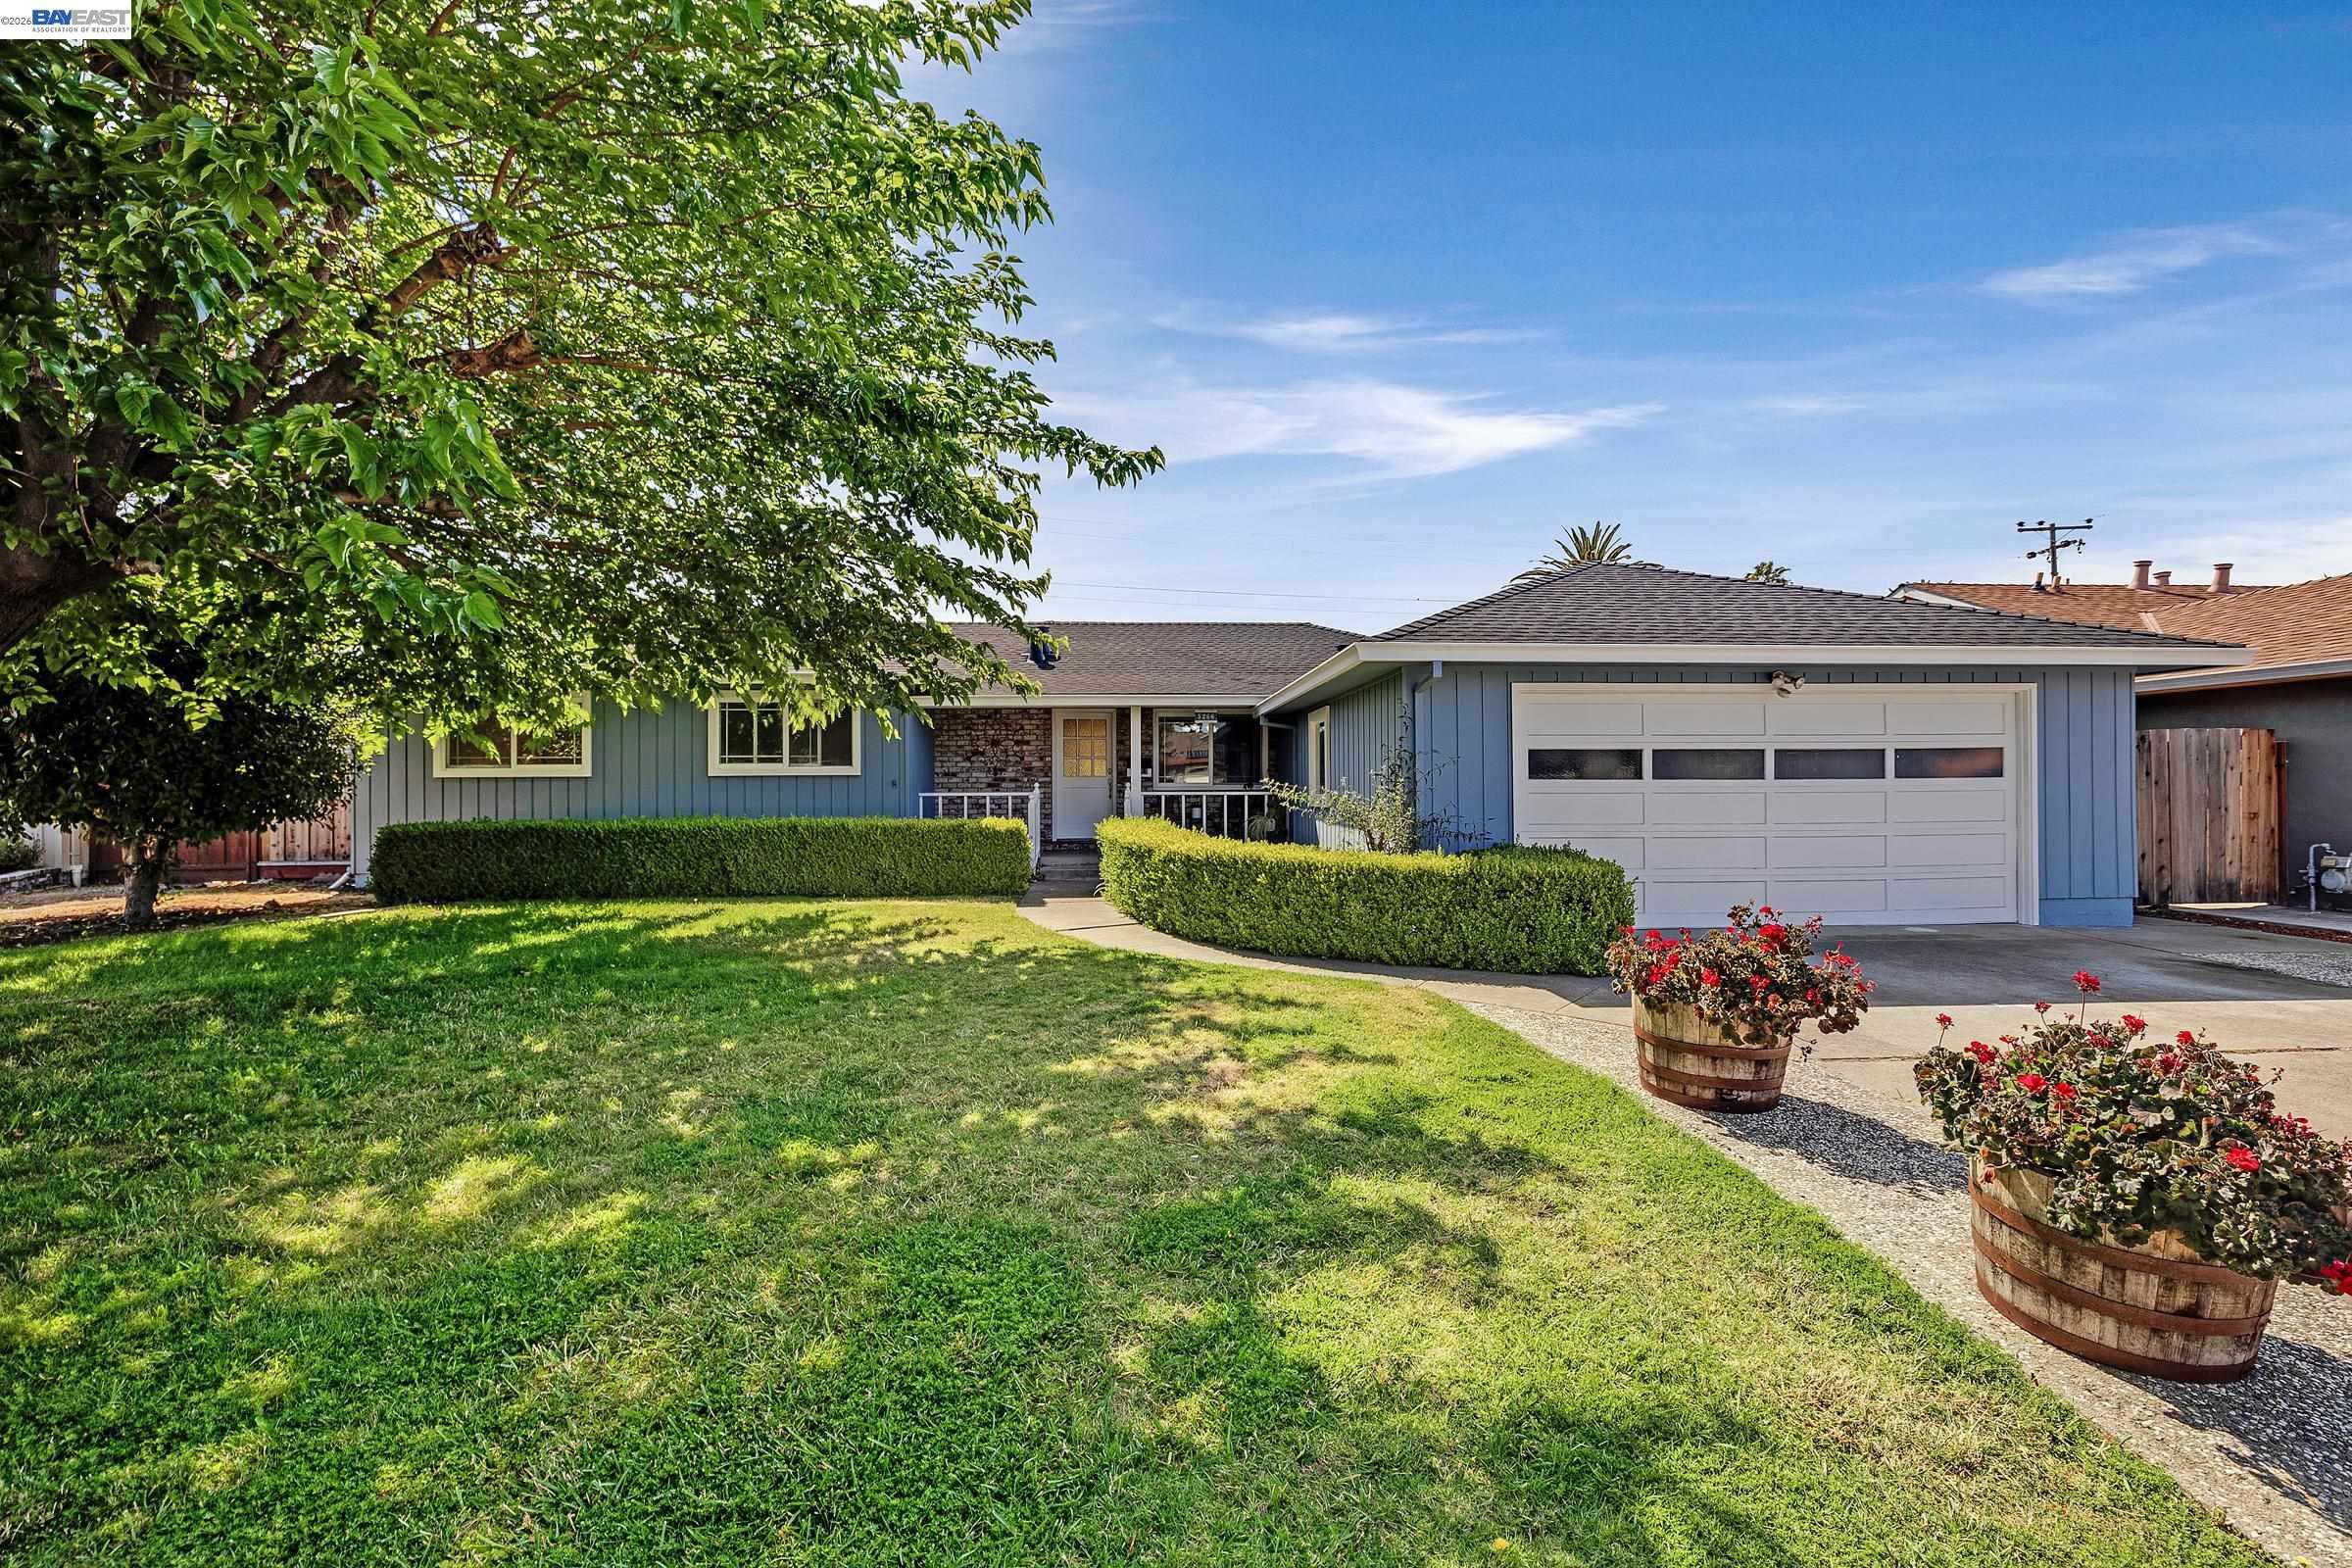
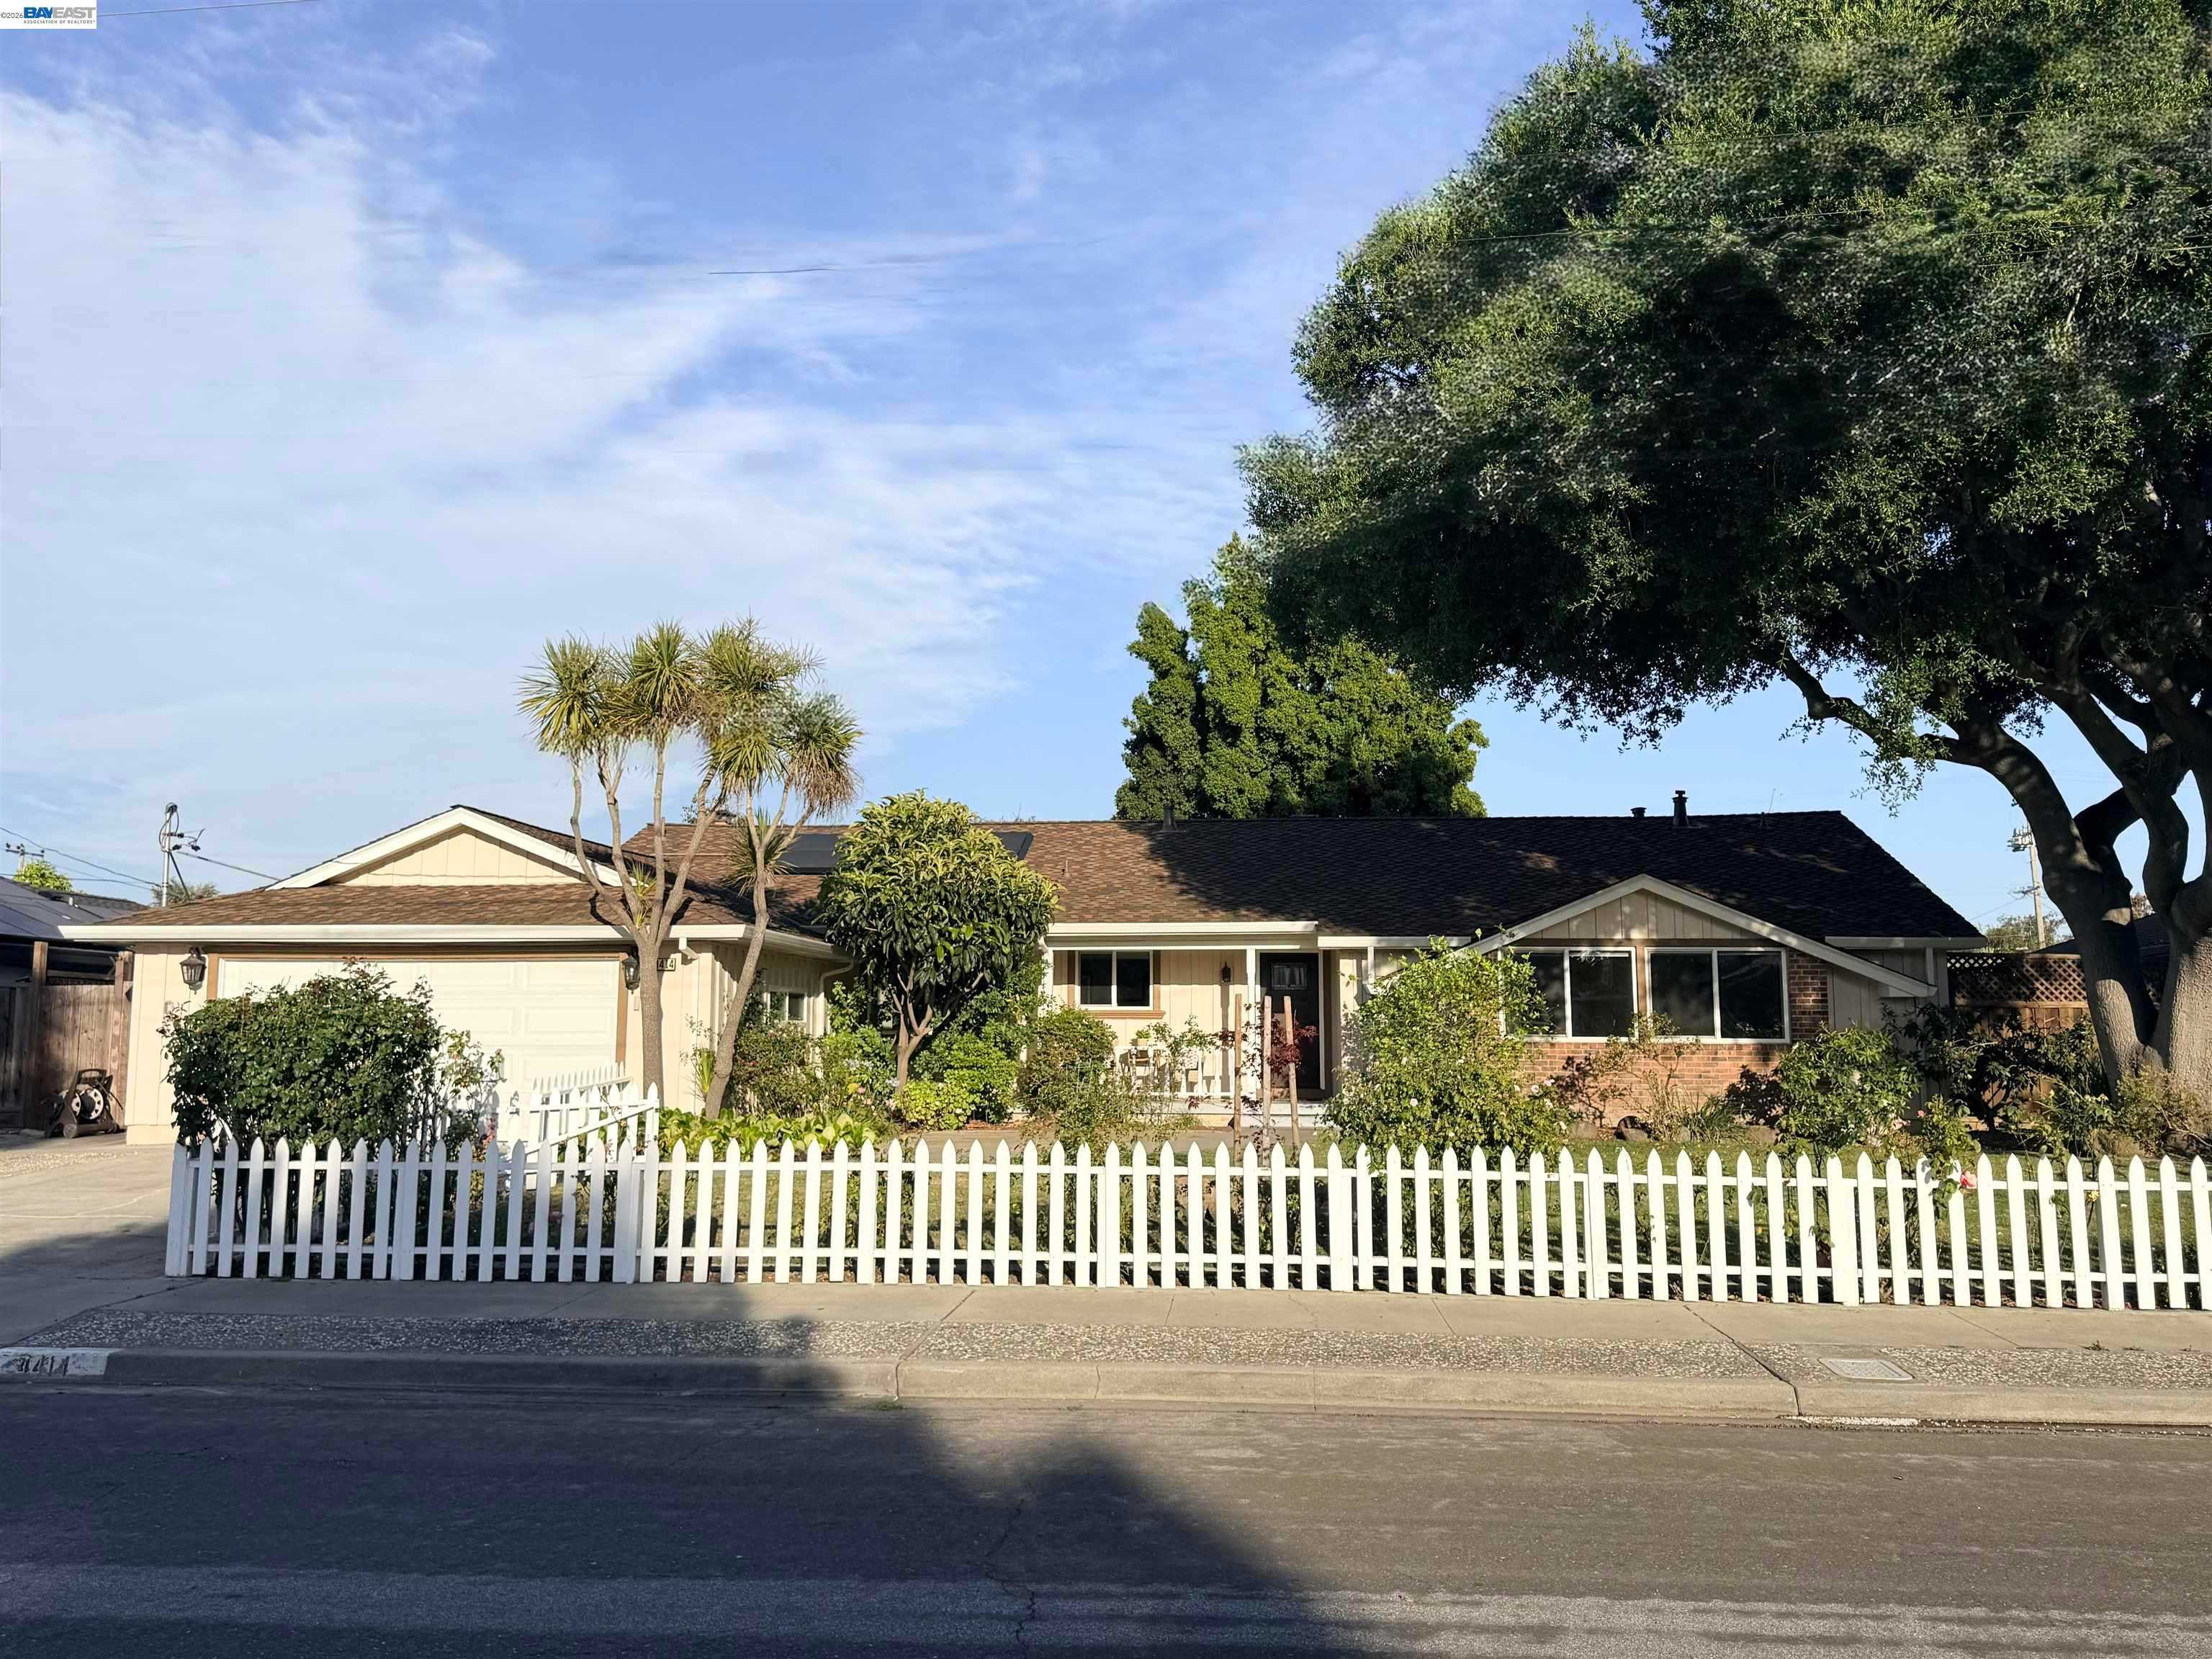
Behind these county totals: hundreds of homes still for sale in Fremont, Hayward, Union City, Newark and Milpitas, counted, priced and sorted every morning from the same MLS export, with a map search for the homes themselves.
30-Year Fixed: 6.89% +0.01 Friday | 15-Year Fixed: 6.49% +0.01 Friday
Nothing repriced today, but Friday changed the direction of travel. Markets are closed for Labor Day, so both rates above are Friday’s close and Mortgage News Daily will not publish again until Tuesday. The 30 year is up 0.73 percentage points since late February and sits two basis points under its 52 week high.
The reason is the jobs report, not the Fed. August payrolls landed at 162,000 against a consensus near 53,000, roughly three times what economists expected, while unemployment held at 4.1%. A labor market that strong gives the Federal Reserve room to tighten rather than ease. Fed funds futures moved from about a 49% chance of a September hike the day before the report to roughly 58% right after it, Treasury yields followed, and mortgage rates track the 10 year far more closely than they track anything said from the Fed podium. These are market implied odds from futures pricing, not a forecast and not an announcement.
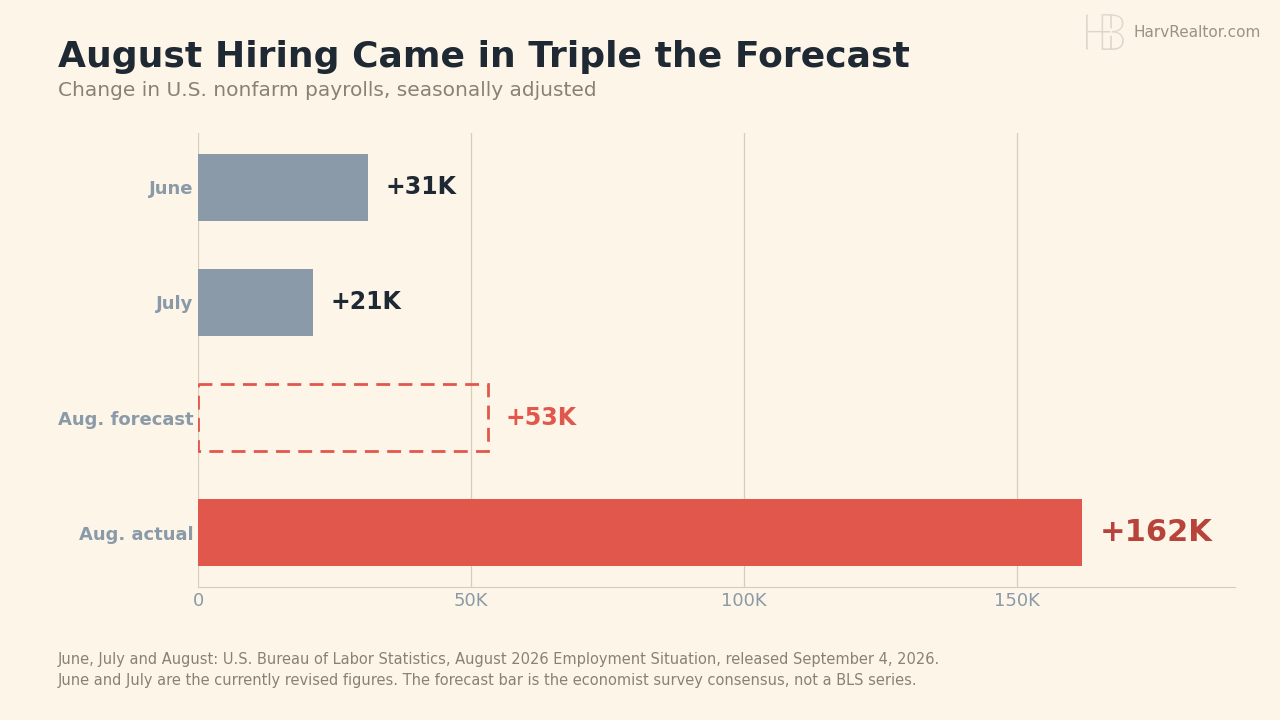
Locally the market did not pause for the holiday. Board wide: 2,616 listings across the 15 city table, counting active and in contract together, with 232 coming soon and 148 brand new. The five city ledger carries 684 live listings across Fremont, Hayward, Milpitas, Newark and Union City, 576 of them already on the market and 108 coming soon.
Fremont holds 260 live listings, 199 active, 45 coming soon and 16 brand new. The median on market list price is $1,250,000 at $815 a square foot, and the typical active listing has been out 26 days. Behind it: Hayward 183, Milpitas 114, Newark 74 and Union City 53. Across all five cities the median is $1,071,475 at $694 a square foot, 268 homes are priced under a million, and 148 have been sitting 60 days or longer.
That last figure is the one to hold onto. A quarter of the active inventory has now been waiting two months or more, which is where the negotiating room lives even in a market that still favors well prepared sellers. If you were waiting on a September rate cut to time a purchase, the futures market just moved the other way.
S&P 500: 7,718.60 -0.38% | Dow: 53,414.25 -0.51% | Nasdaq: 26,506.99 -0.29%
There is no tape today. The New York Stock Exchange and Nasdaq are both shut for Labor Day, so every level above is Friday’s closing bell and none of it moves until Tuesday. Friday was a mild pullback on strong economic news, which only sounds contradictory until you remember what a hot jobs report does to rate expectations.
Already on the calendar: three names join the S&P 500 on September 21, Bloom Energy, Illumina and Everpure. Molson Coors, The Trade Desk and Builders FirstSource make room. The entry bar is a market value of at least $22.7 billion.
10-Year Treasury: 4.78% +0.01 | Gold: $4,476.60 -0.34% | Silver: $66.75 -0.34% | Brent: $96.28 +0.80%
This is the most expensive Labor Day at the pump on record. GasBuddy projected a national average of $4.03 a gallon when it published its holiday forecast on September 1. The holiday arrived higher: AAA has the national average at $4.15 this morning, about 96 cents above last Labor Day and the first time this holiday has ever opened above four dollars. The prior record was $3.83 in 2012, which the chart below marks as a line so the claim is visible rather than asserted.
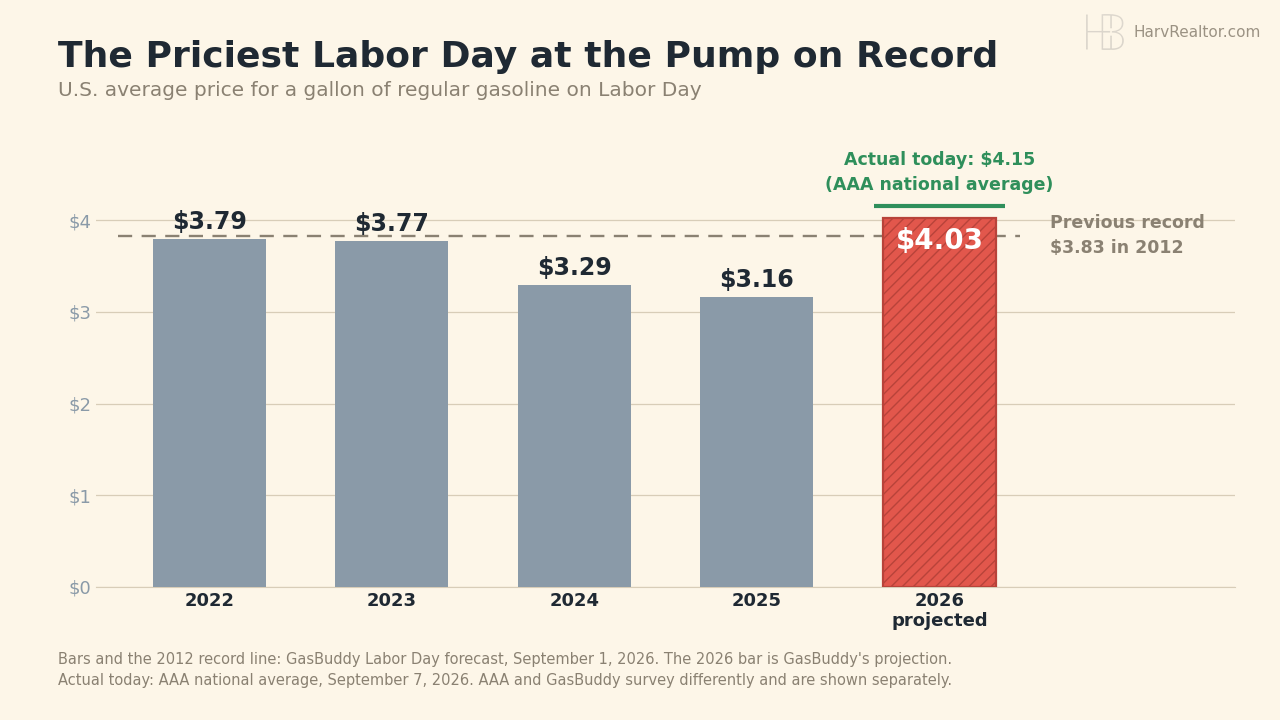
California reads that number differently. The state average is $5.86 today, a full $1.71 above the national figure, and the Bay Area typically prices above the state line. Diesel is worse: a record $5.85 on Friday and another nickel over the weekend, which matters for anyone moving, renovating or hauling this fall.
The cause is supply. Conflict involving Iran has choked traffic through the Strait of Hormuz and drone strikes on Russian refineries have cut capacity, pushing refining margins to records and disconnecting pump prices from crude. Brent settled Friday at $96.28. Relief may arrive after September 15, when the cheaper winter blend returns.
A note on today’s newsletter numbers, because several did not survive checking. Market Briefs printed gold at $4,459 and Brent at $96.81; the COMEX front month closed Friday at $4,476.60 and Brent’s ICE front month settled at $96.28. It showed the 10 year up 0.02 points, while Treasury’s own daily curve has 4.78% against Thursday’s 4.77%, a move of 0.01. Silver was omitted entirely again, so it was sourced independently.
Bitcoin: $78,882 -1.01% | Ethereum: $2,474.63 -0.26% | XRP: $1.39 -1.65%
Crypto is the only market open today, so unlike everything above these are live quotes pulled at 9:14 AM PT with 24 hour changes. The newsletter quoted Bitcoin at $79,884 and Ethereum at $2,511 as of Sunday afternoon; both have drifted lower since, which is why these get requoted rather than reprinted.
El Salvador’s holdings are back in the news. The government tracker shows 7,764 BTC while the IMF counts 6,224, a gap of 1,540 coins that documents attribute to donations and wallet transfers rather than public money. Separately, FinCEN put cumulative crypto investment scam losses at $12.7 billion and wants banks and exchanges sharing information on suspicious transfers.
Sources
- Mortgage News Daily (30 and 15 year fixed, September 4 close)
- U.S. Bureau of Labor Statistics, August 2026 Employment Situation (payrolls and unemployment, released September 4)
- GasBuddy Labor Day gas price forecast (September 1, 2026, and the 2012 record)
- AAA Fuel Prices (national average and diesel, September 7)
- AAA state averages (California, September 7)
- U.S. Treasury daily yield curve (10 year, September 4)
- COMEX gold and silver front month and ICE Brent front month (Friday settlements)
- CoinGecko (Bitcoin, Ethereum and XRP, live at 9:14 AM PT September 7)
- REALTY EXPERTS® Live Inventory (five city ledger, September 7)
Disclaimer: The market data, rates, and information provided are for informational purposes only and should not be considered financial advice. Always verify rates and data with your lender or financial advisor before making any decisions.