



"At a Glance" Local Housing STATS and News 09/06/26
September 6, 2026 · Alameda County Market Dashboard
TODAY'S LIVE INVENTORY
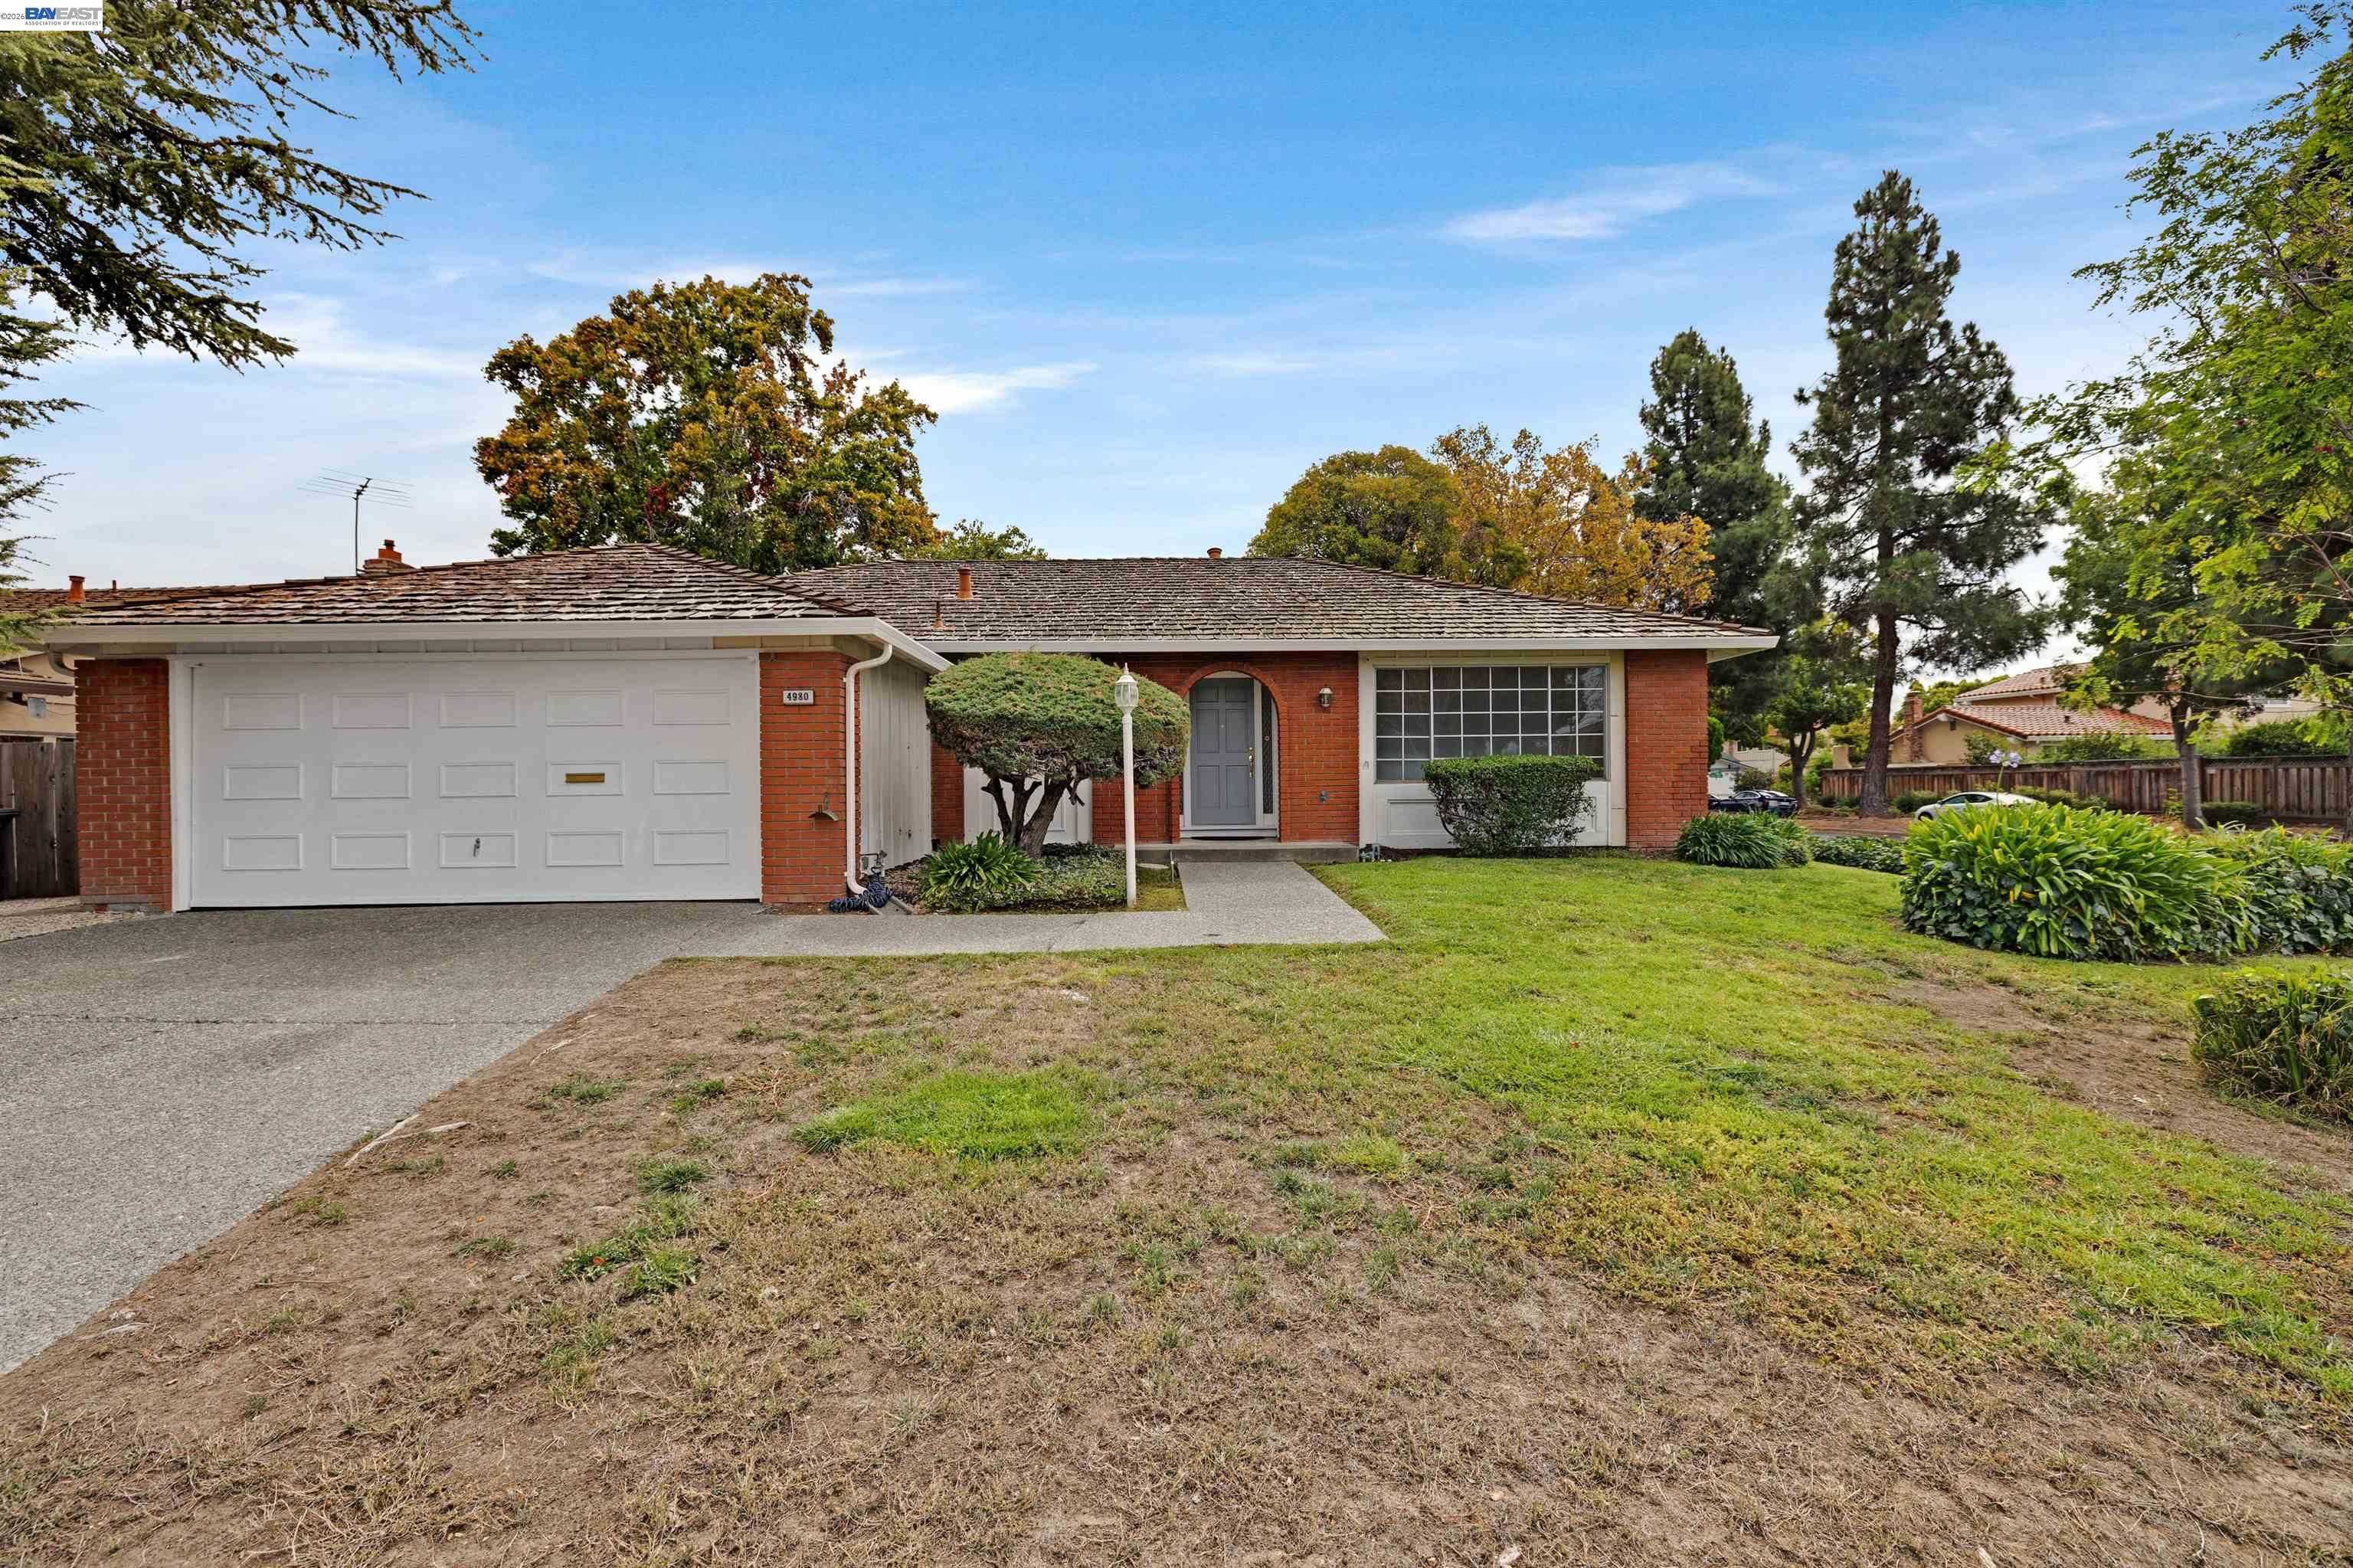
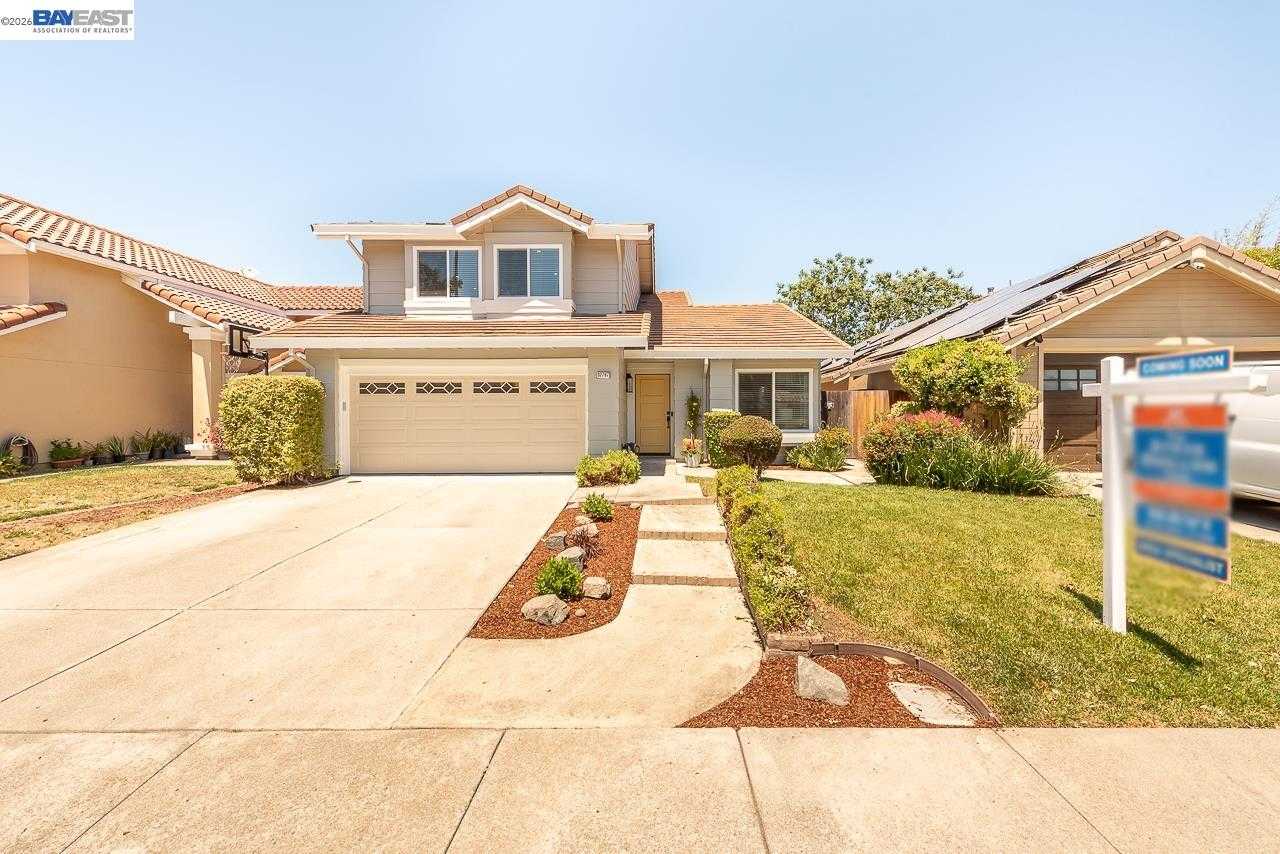
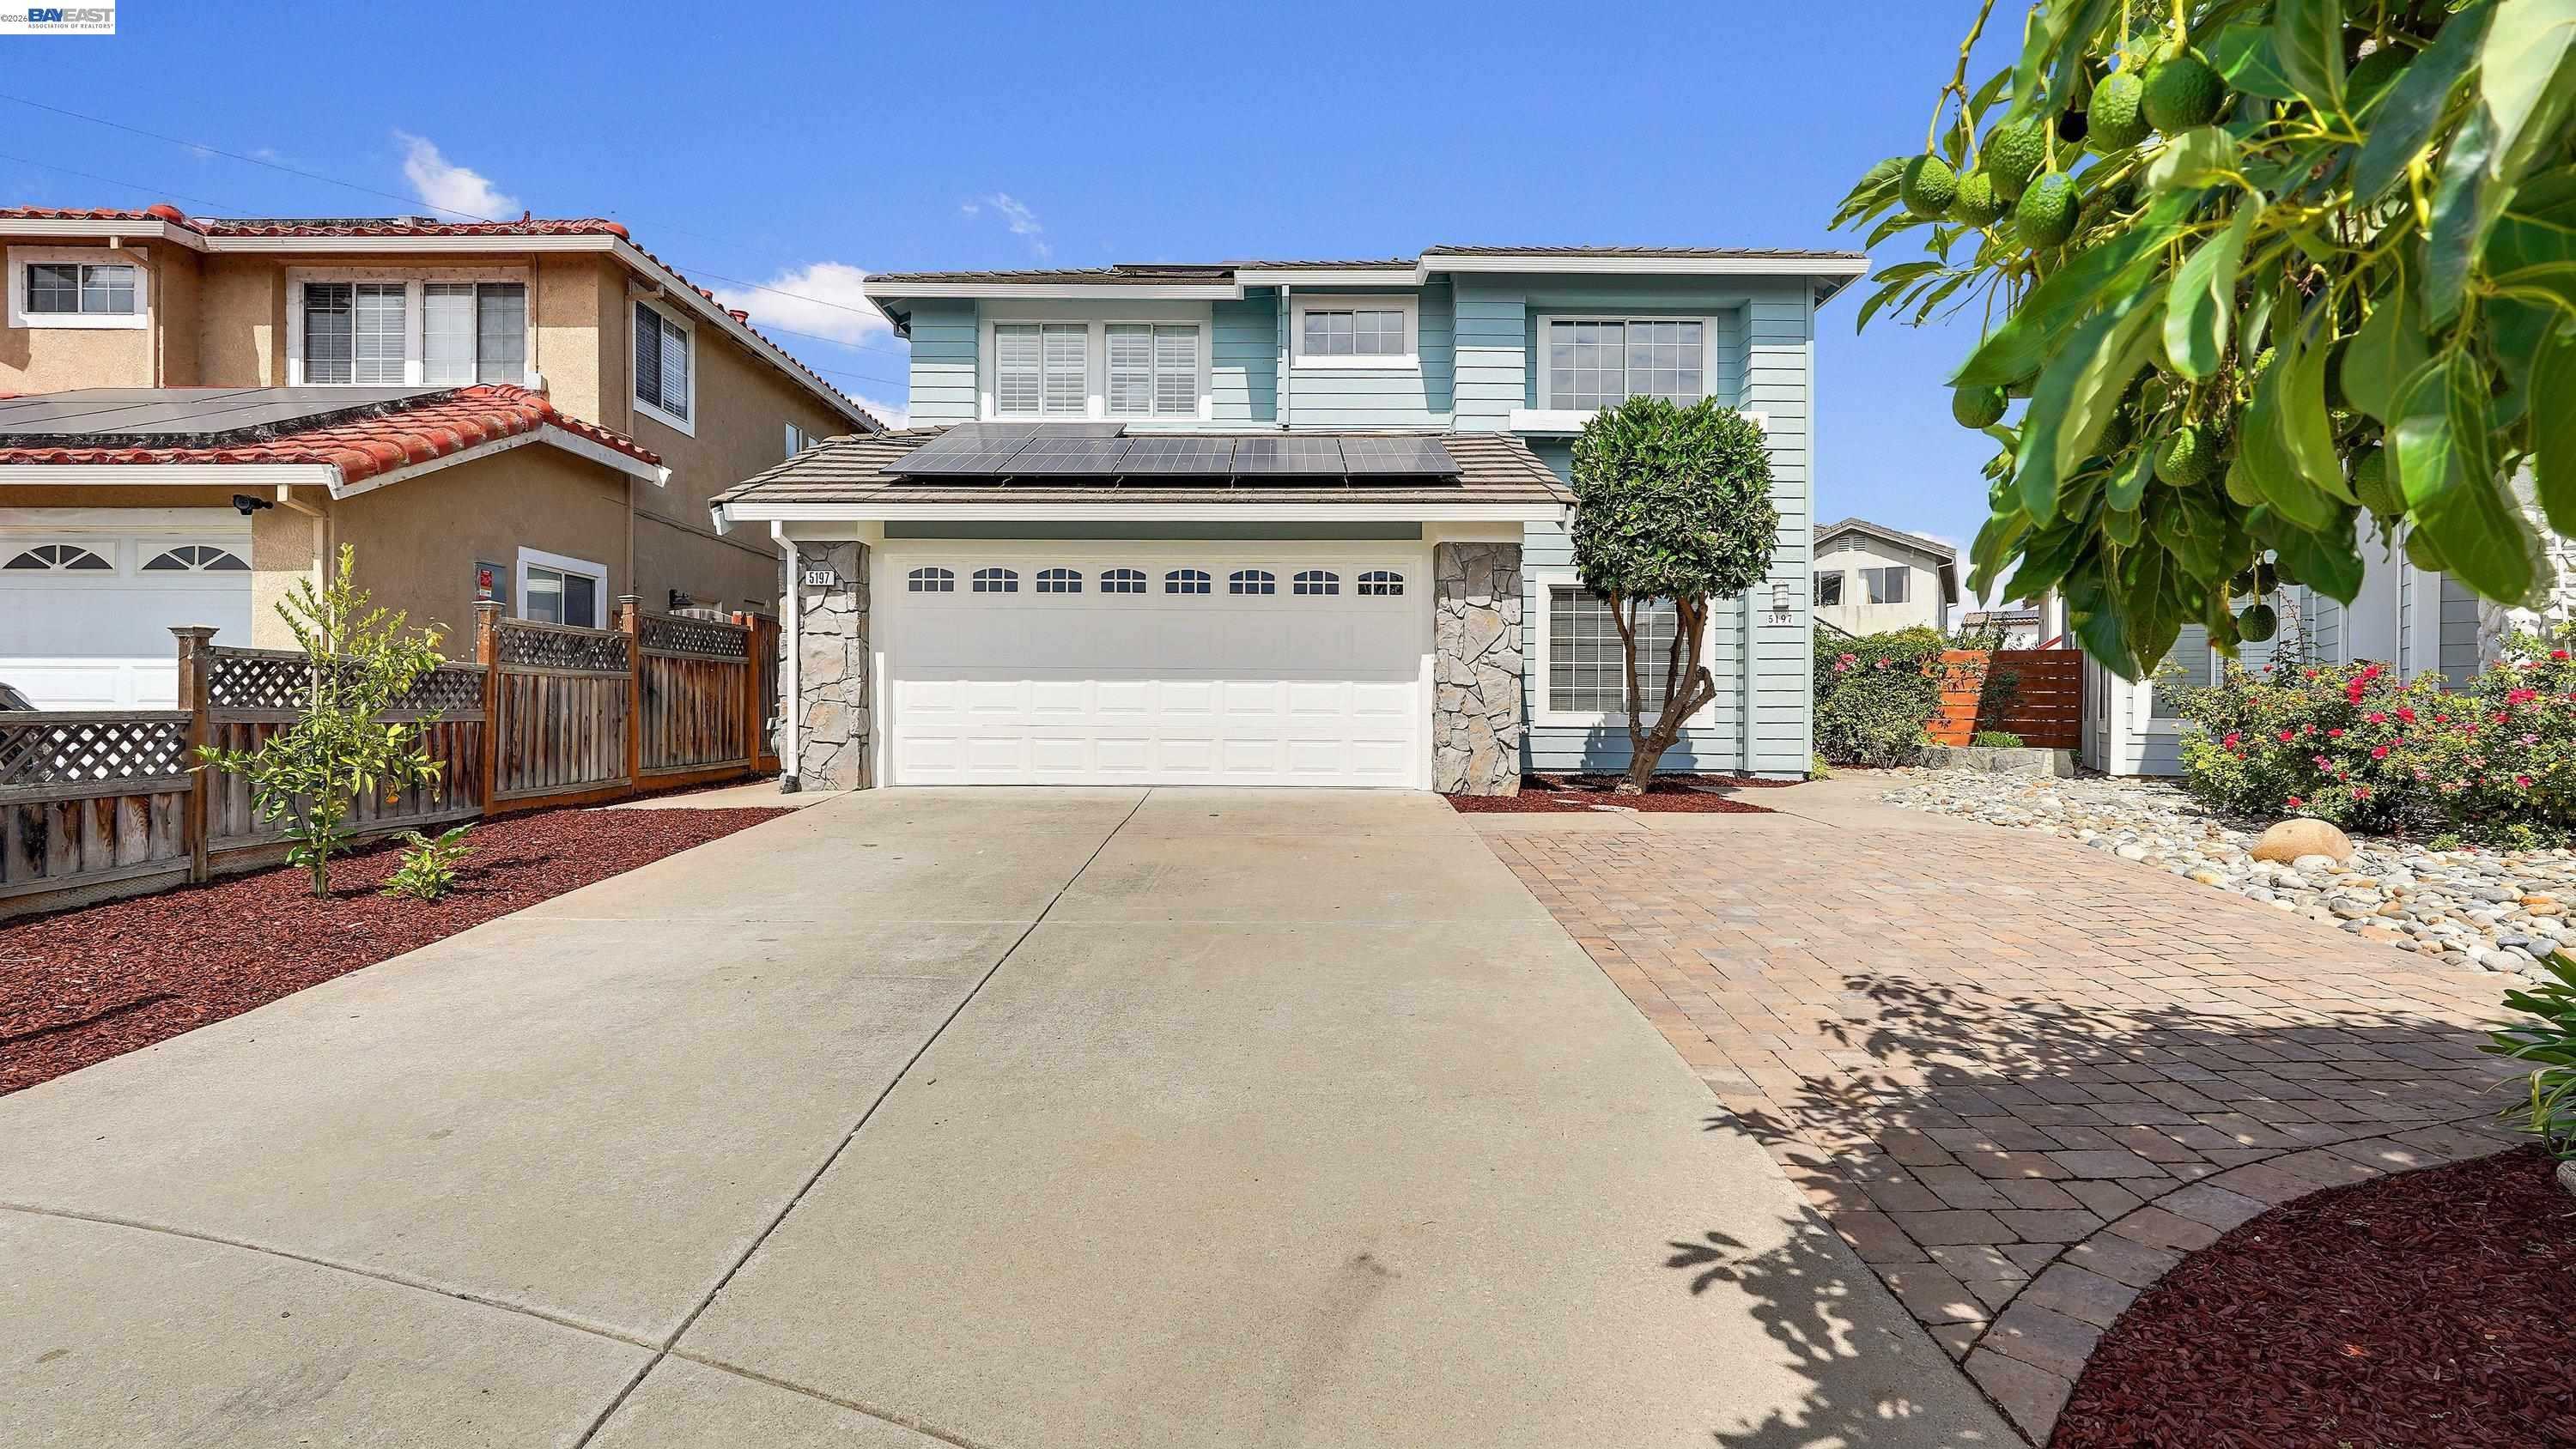
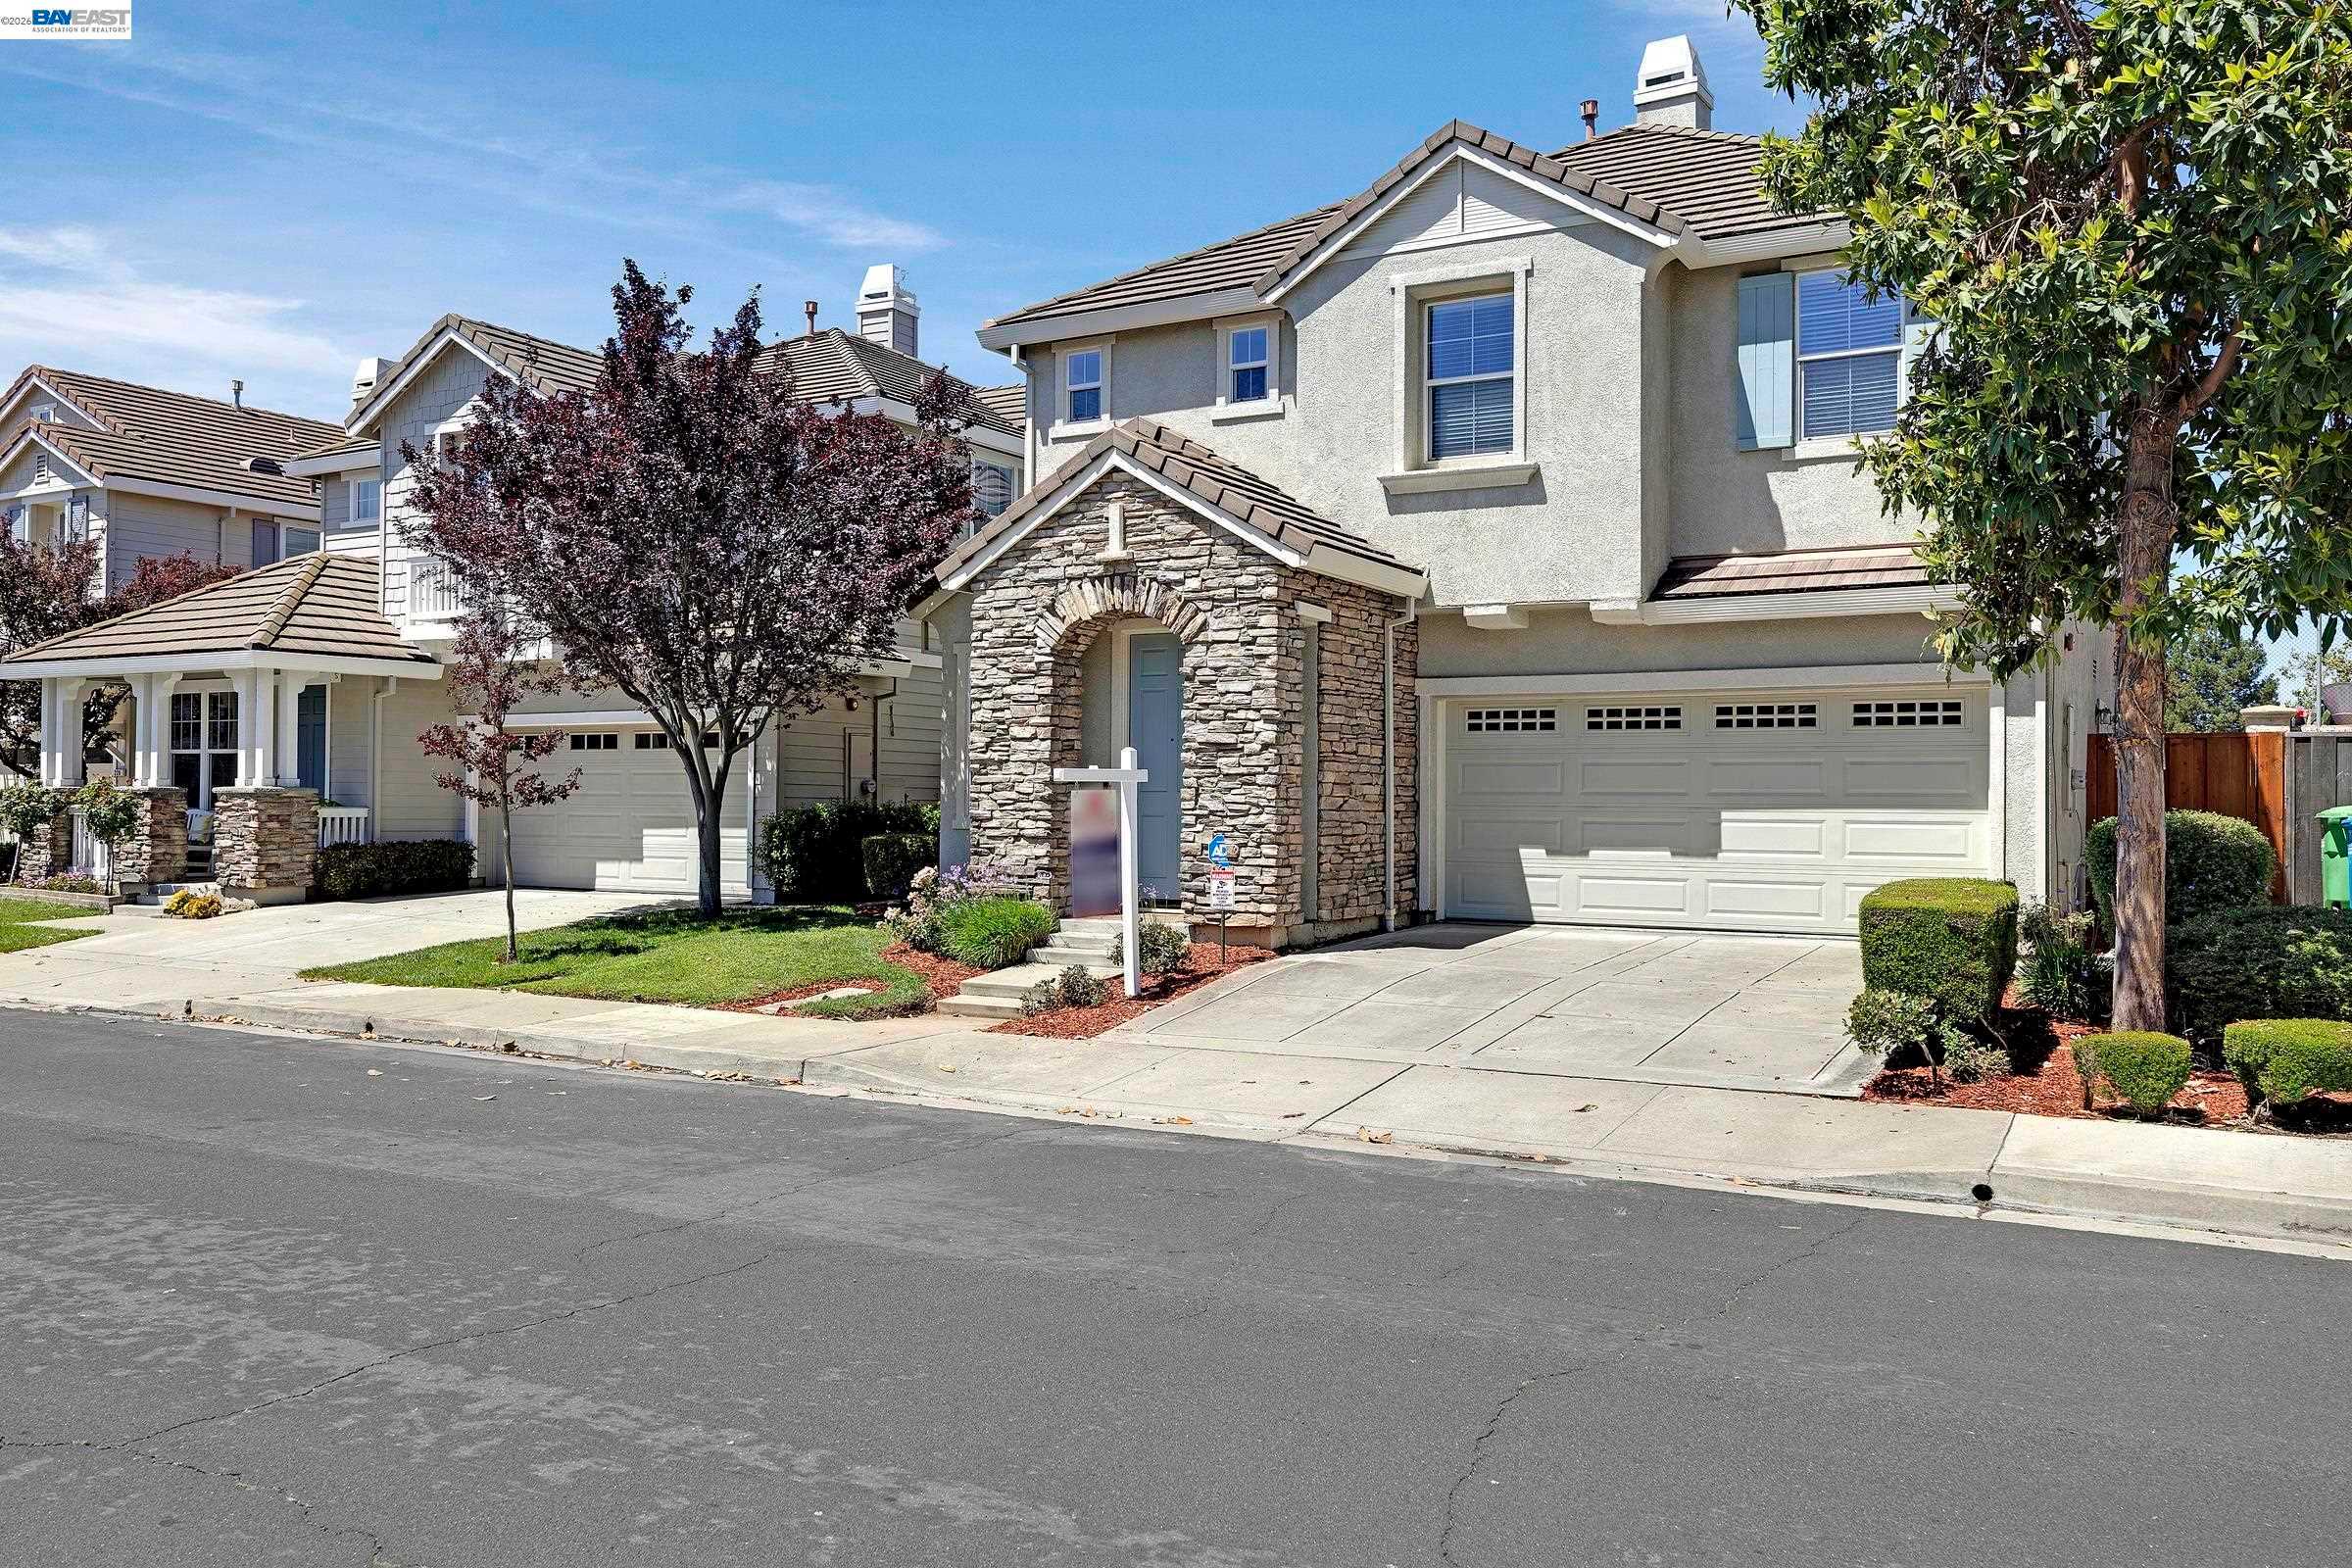
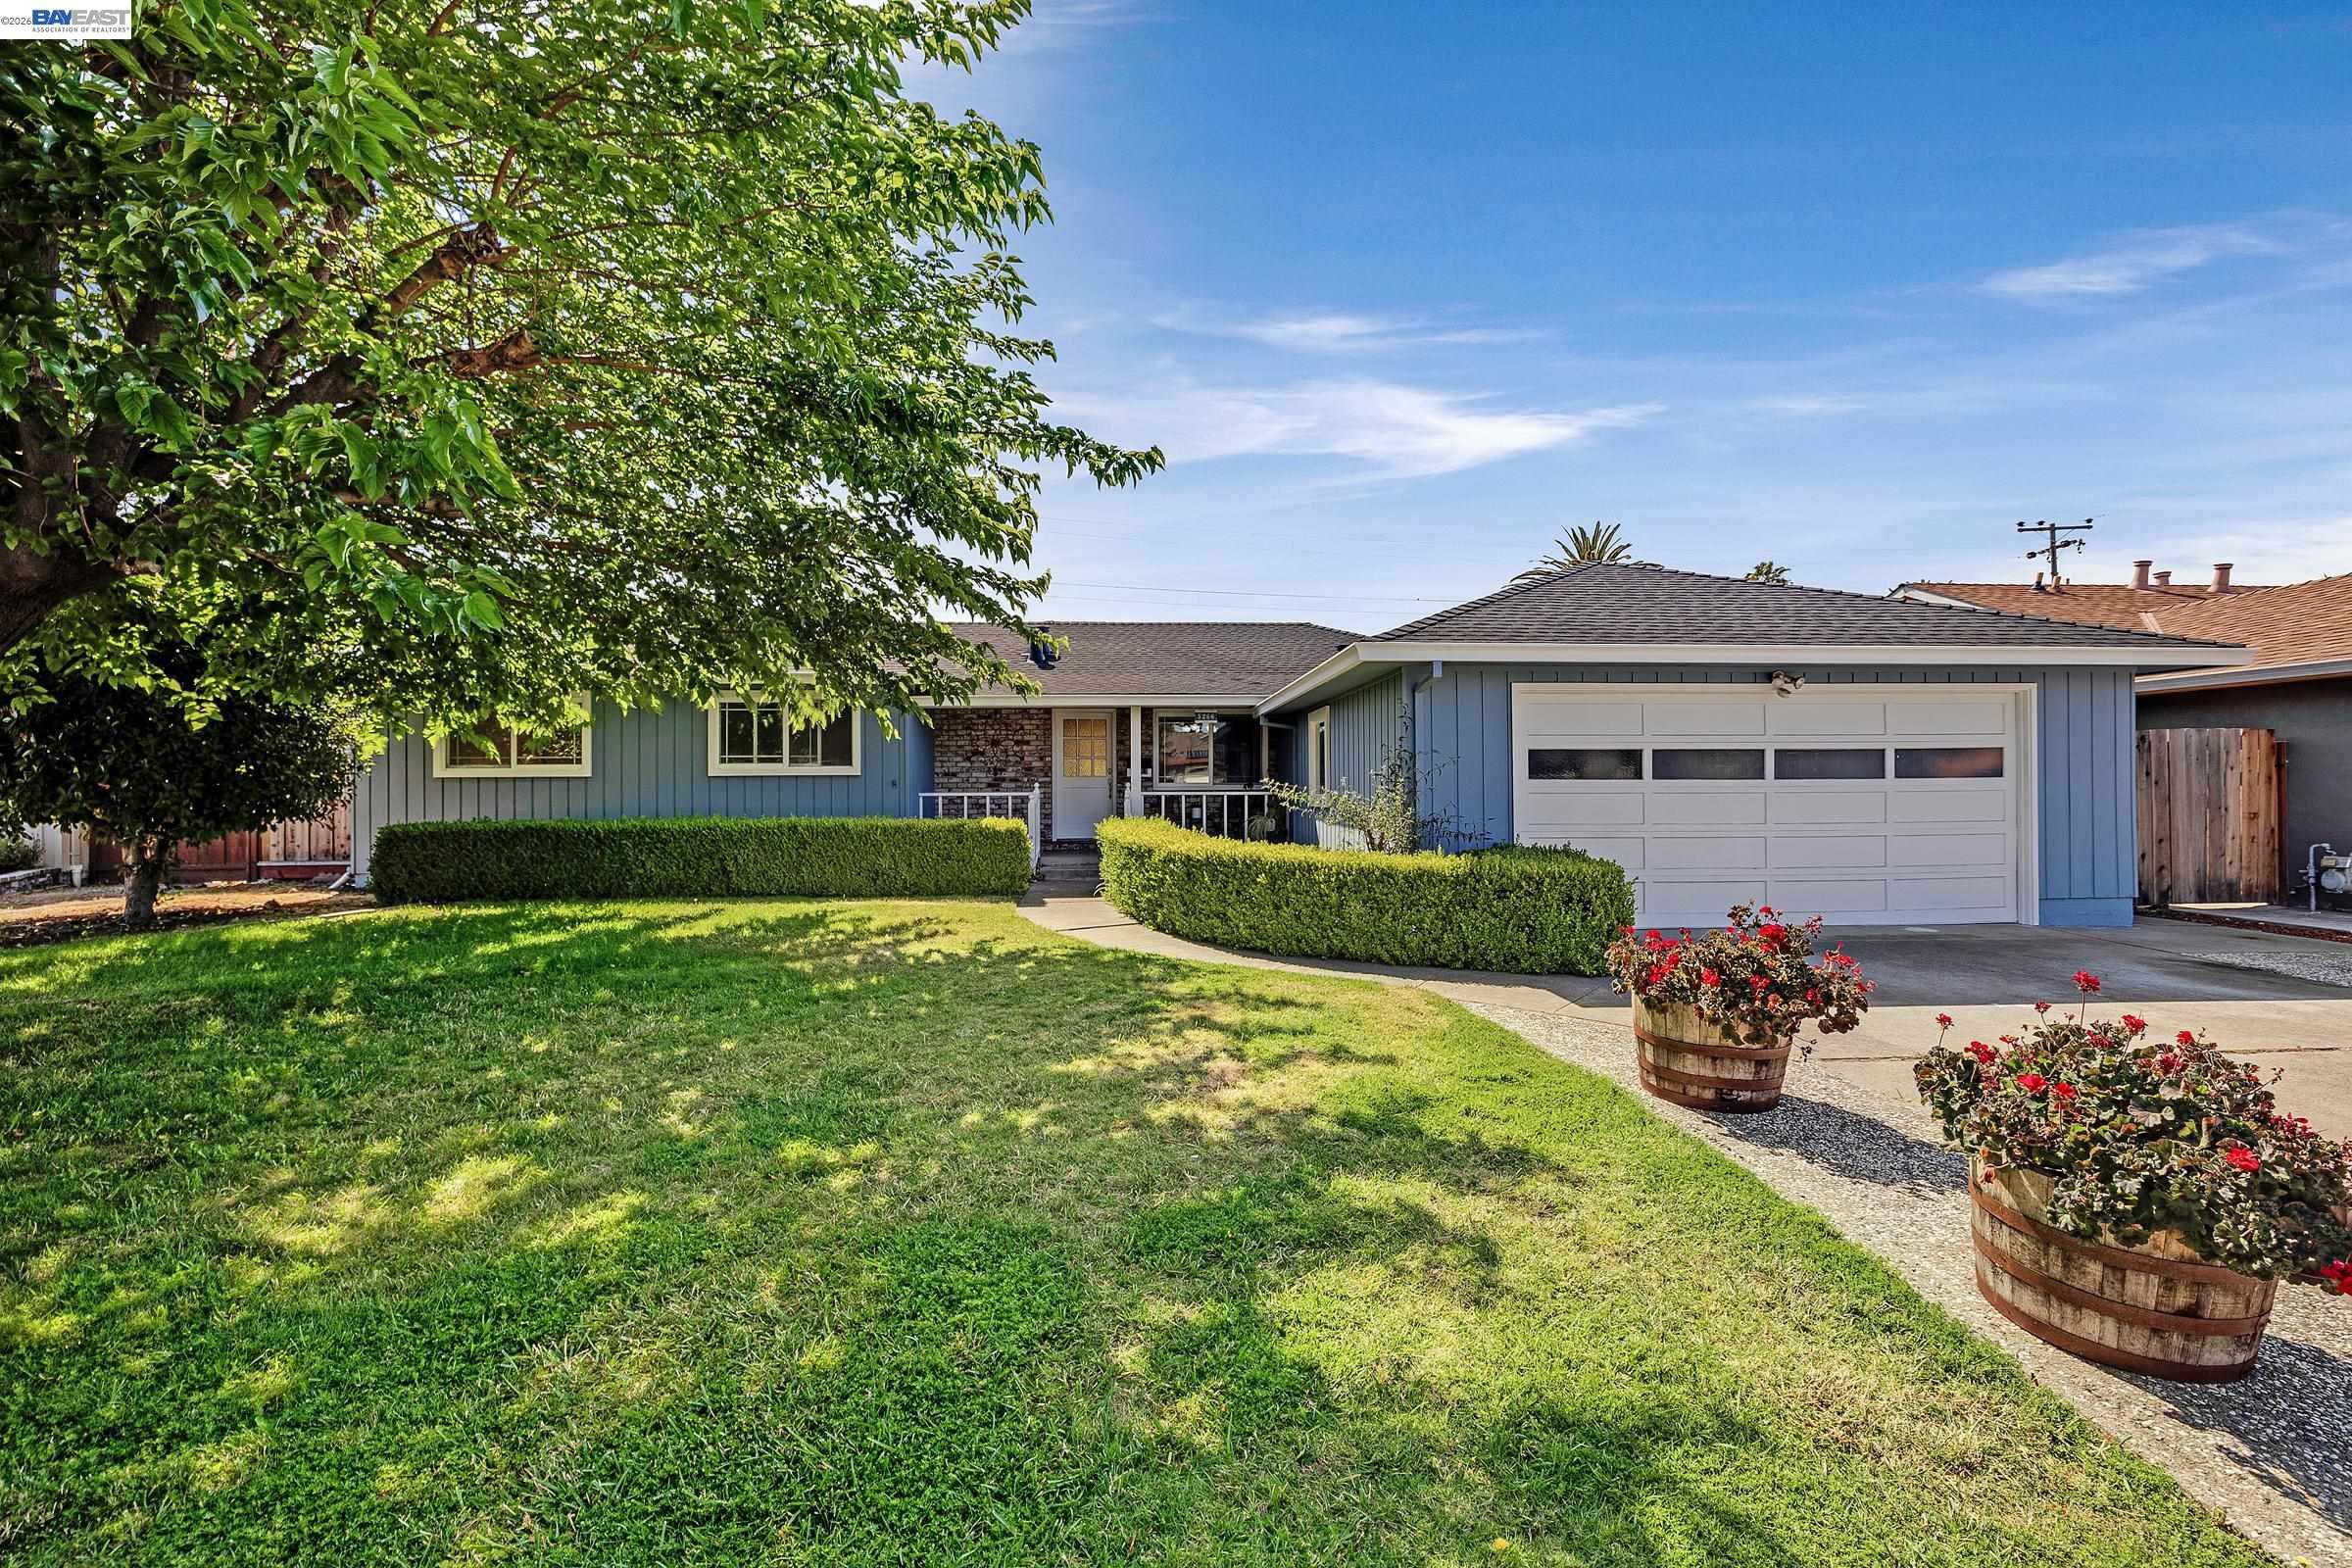
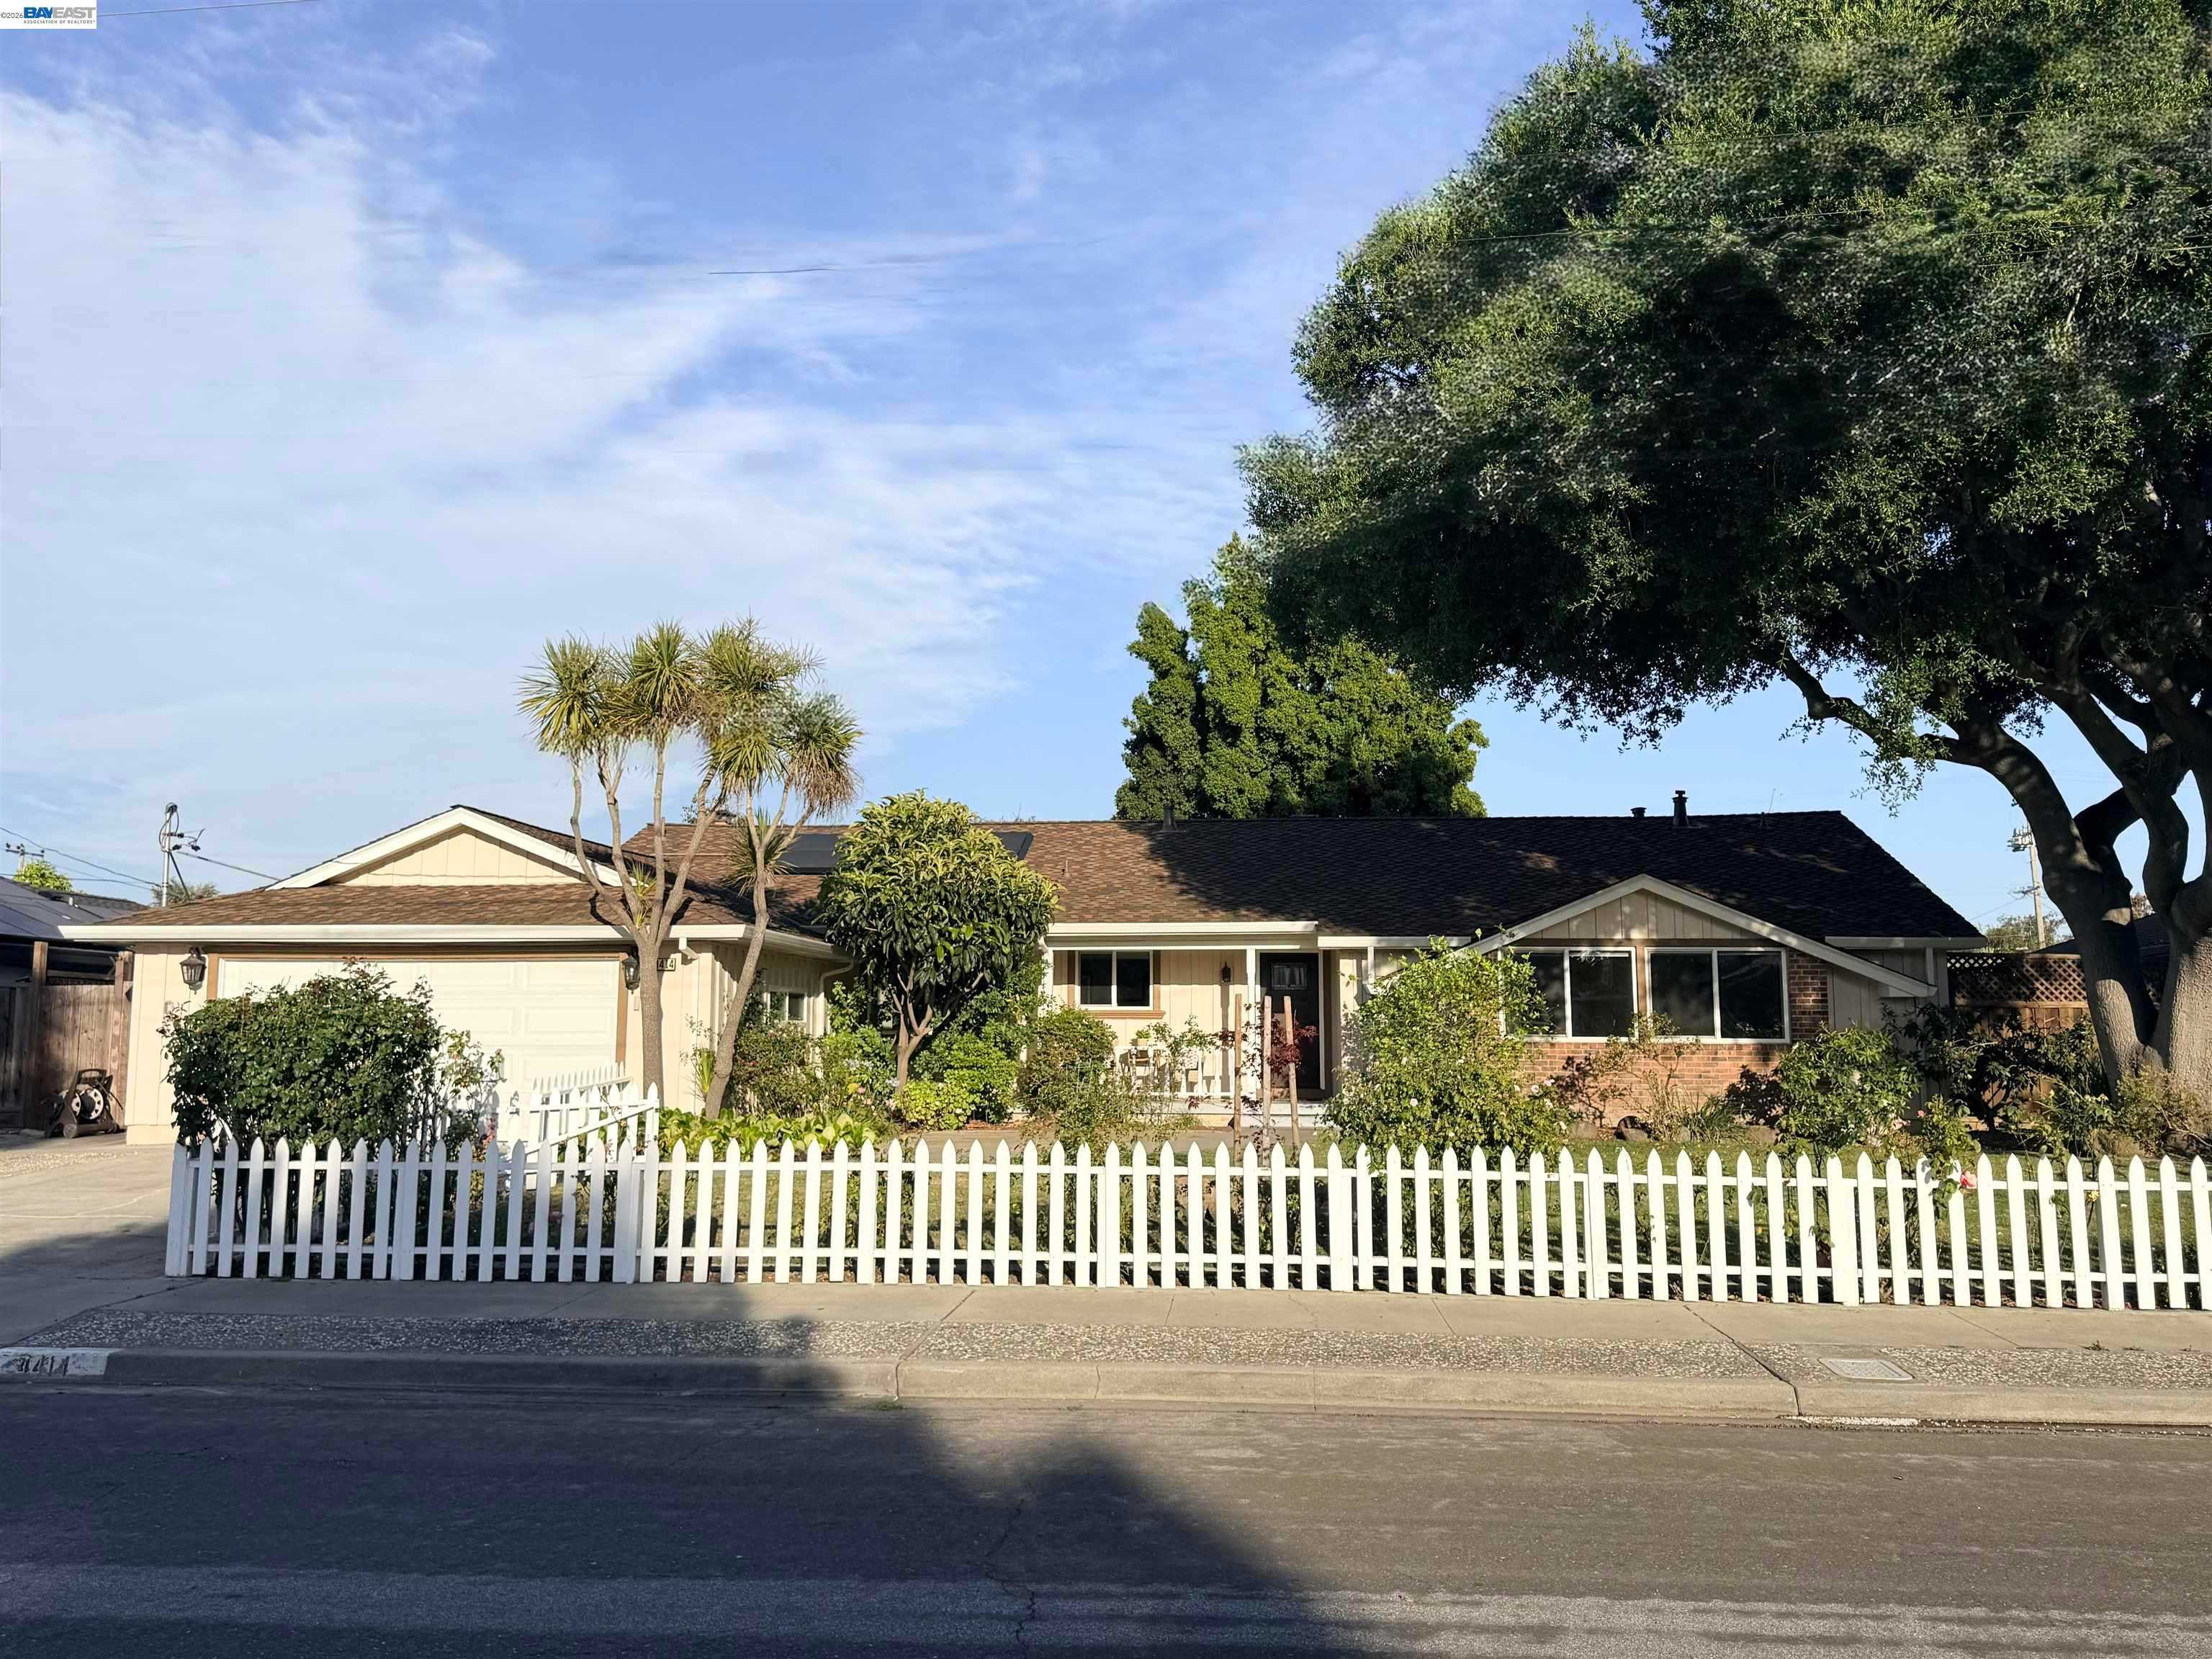
Behind these county totals: hundreds of homes still for sale in Fremont, Hayward, Union City, Newark and Milpitas, counted, priced and sorted every morning from the same MLS export, with a map search for the homes themselves.
30-Year Fixed: 6.89% unchanged | 15-Year Fixed: 6.49% unchanged
California cooled again last week, and this side of the bay did not. Both rates above are Friday’s close, since Mortgage News Daily does not publish on weekends. The 30 year sits two basis points under its 52 week high of 6.91%, which is most of the reason the statewide market is losing steam.
The statewide scorecard. For the week ending August 29, C.A.R. counted 456 closed sales a day, down 7.6% from the prior week, 458 pendings a day, down 13.8%, and 542 new listings a day, down 15.2%. Of C.A.R.’s five regions only the Central Coast gained. The Bay Area slipped 7.5%, the second smallest decline in the state.
The number underneath all of it is 0.59. C.A.R. calls it the inventory replenishment rate, and it is just the 542 new listings divided by the 914 homes that closed or went into contract. For every 100 homes that left the market last week, only 59 arrived to replace them. Anything below 1.0 means inventory is shrinking, which is the opposite of what a cooling sales pace usually looks like.
So does the slowdown reach us? Not on the two measures that decide how you price a house. One note on method first, because it matters: the weekly report prints a statewide 29 days on market, but that figure is weekly and covers every property type, so it cannot be set beside a monthly single family city report. The comparable number is 26, from C.A.R.’s own July release. Everything below is the same month, the same property type and the same publisher.
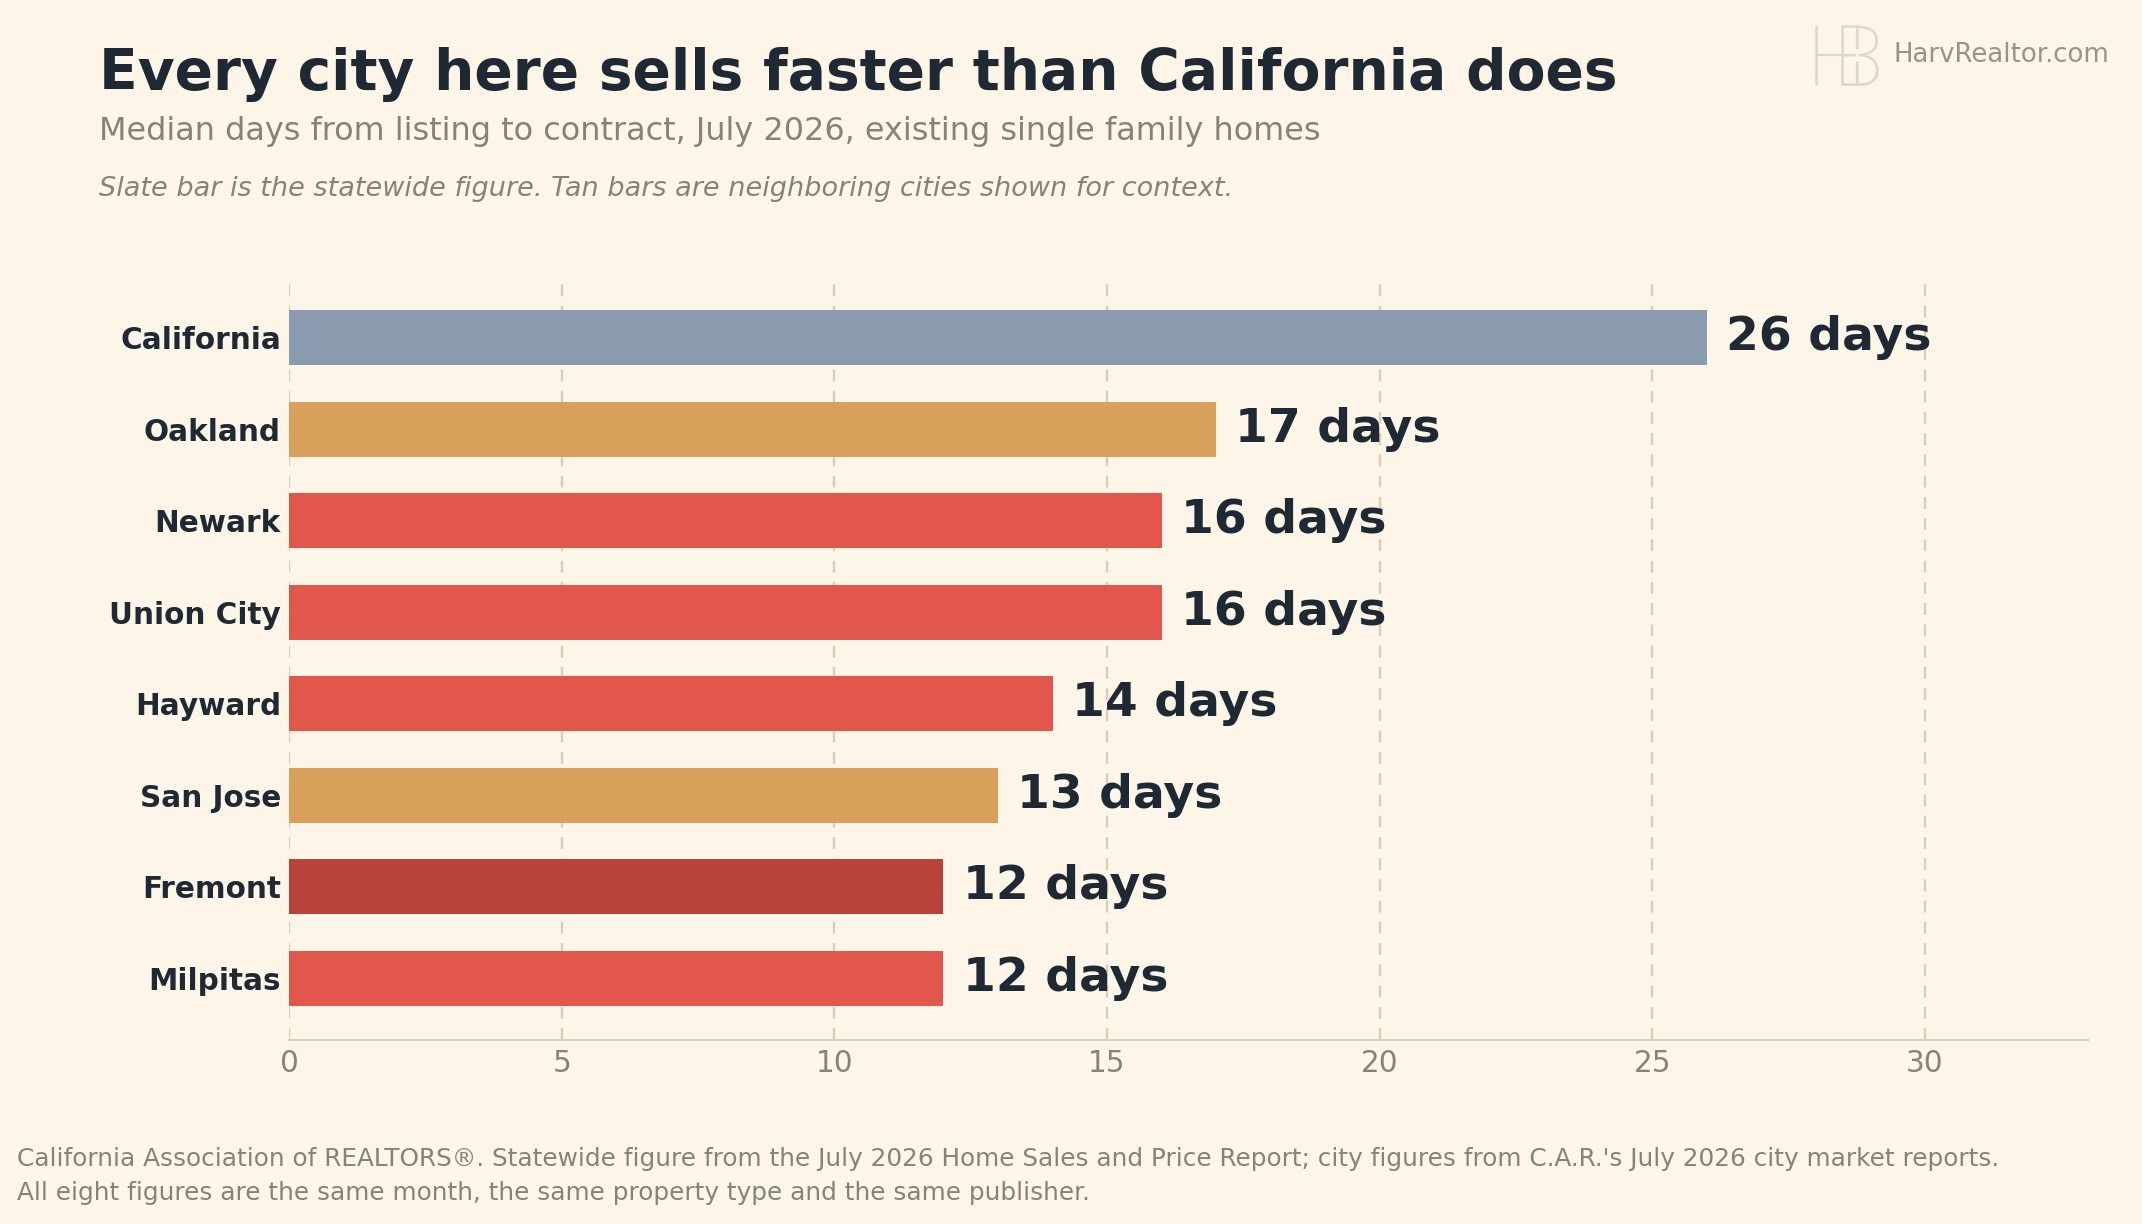
Speed. The typical California home took 26 days to go under contract in July. Fremont took 12, Milpitas 12, San Jose 13, Hayward 14, Newark 16, Union City 16 and Oakland 17. Every one of them beat the state, most by roughly half.
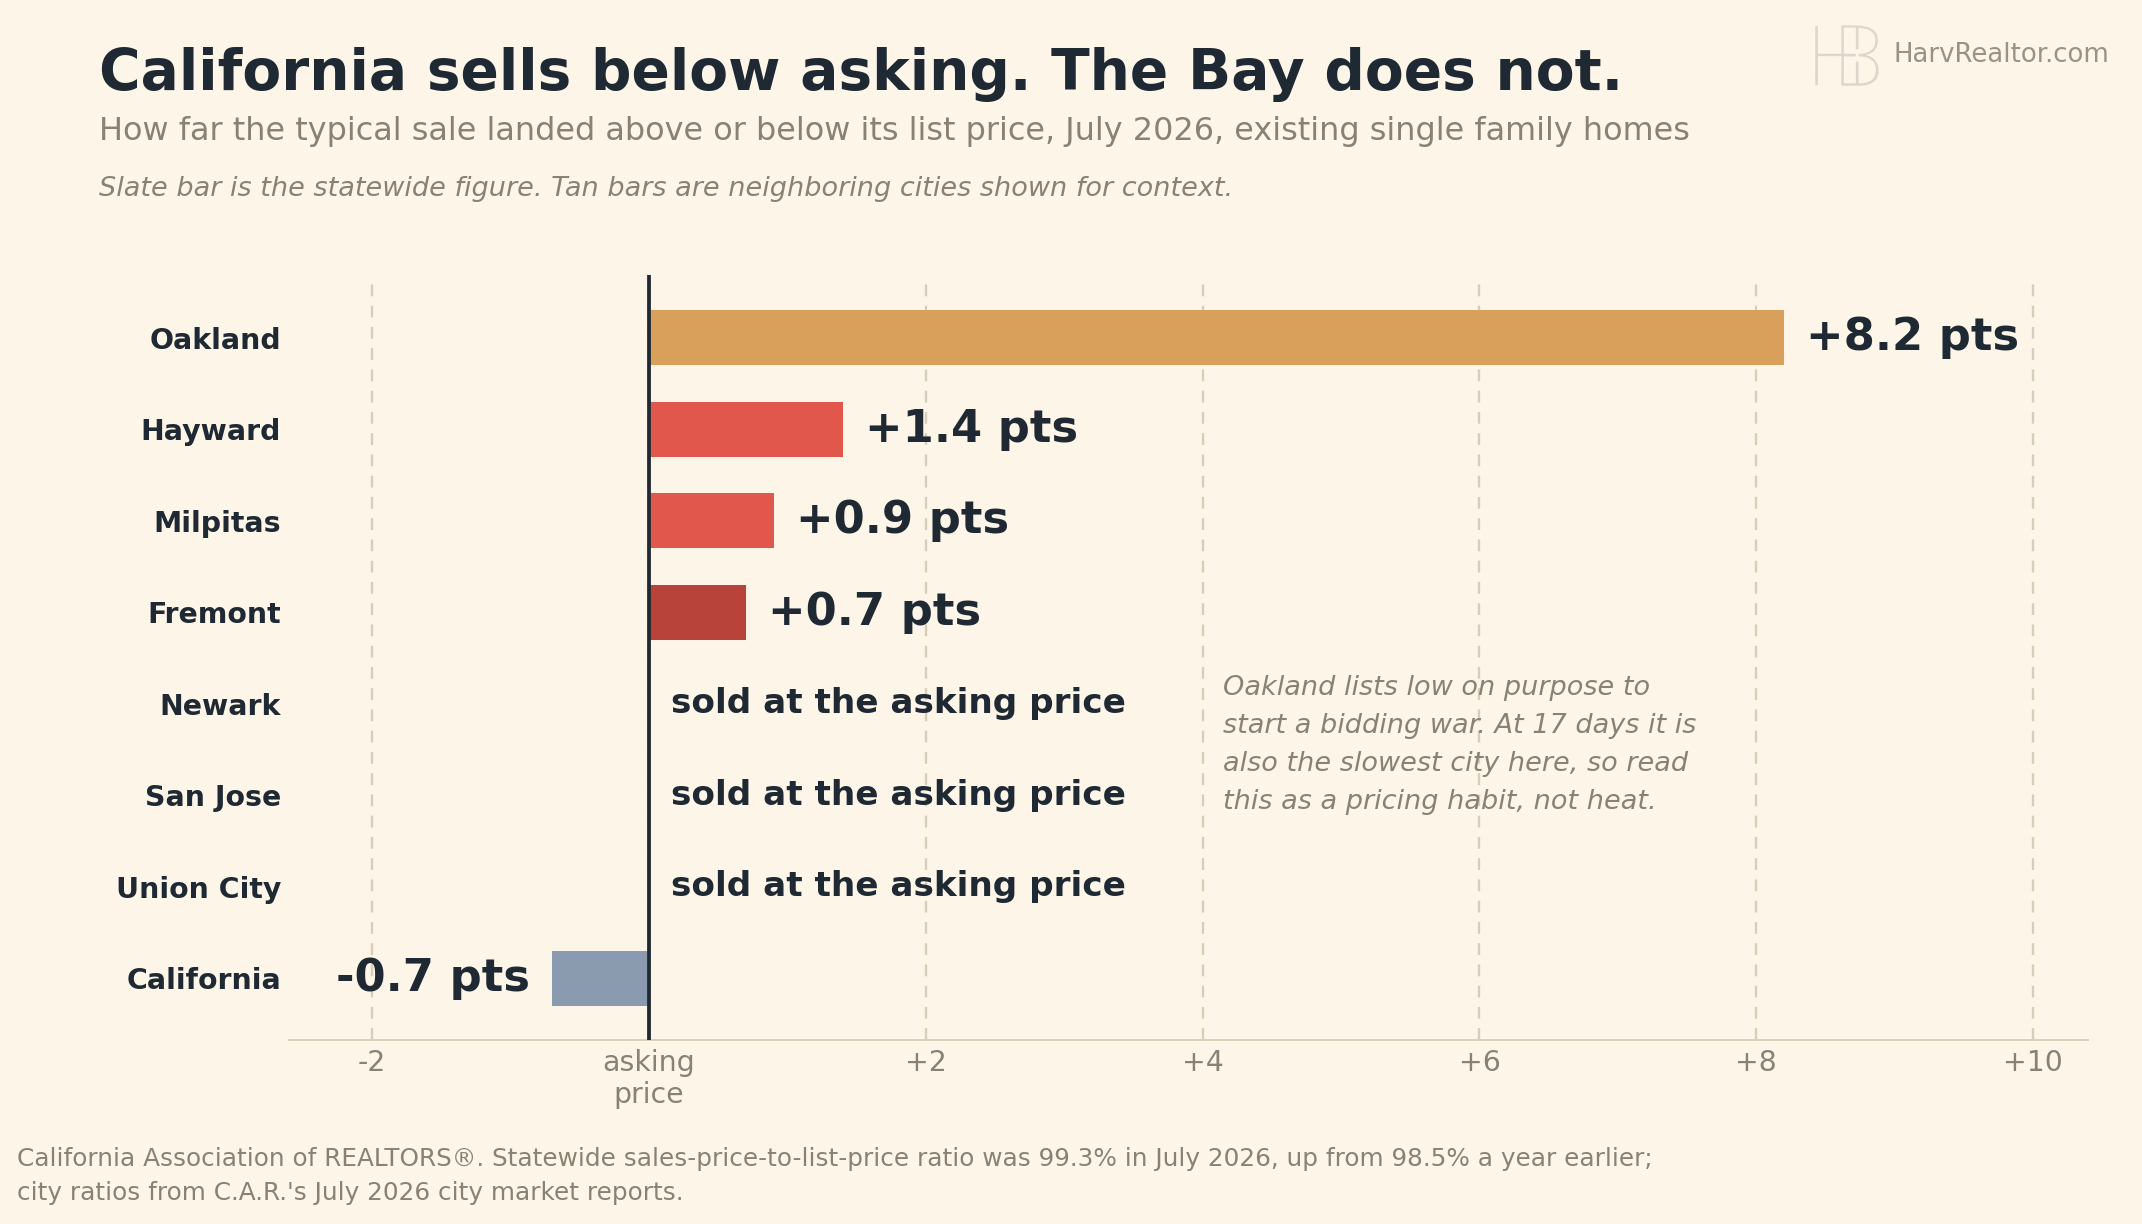
Price discipline. The typical California sale closed at 99.3% of asking, so the seller left 0.7% on the table. No local city did. Fremont closed at 100.7%, Hayward at 101.4%, Milpitas at 100.9%, and Newark, Union City and San Jose landed exactly at asking. Oakland’s 108.2% is real but it is a listing convention rather than heat: agents there price low on purpose to start a bidding war, and Oakland is also the slowest city in the set at 17 days.
Fremont in July. 77 existing single family sales, up 6.9% from a year ago, at a median of $1.66M. That median is down 11.5% year over year, which reads worse than it is: it rests on 77 sales and swings with whatever happened to close that month. Active listings were 114, down 8.8%, and only 27.2% of them had cut their price.
Live inventory, September 6. Board wide: 2,618 listings across the 15 city board, counting everything active alongside everything in contract, with 226 coming soon and 163 brand new. That is 9 fewer than yesterday. The five city live ledger carries 678 homes across Fremont, Hayward, Milpitas, Newark and Union City, down 8 from yesterday: Fremont 258, Hayward 182, Milpitas 113, Newark 74 and Union City 51. Median list price is $1,068,000 and 267 of them are under $1M.
One caveat before anyone quotes the 12 days. C.A.R.’s 12 measures homes that actually sold. The ledger’s median of 31 days measures the age of what is still sitting. Both are true and they answer different questions, because quick homes leave quickly and whatever remains gets older by definition. If you are pricing this week, the 12 sets the expectation and the 31 is the pile you have to stand out from.
10-Year Treasury: 4.78% ▲ 0.01% | Gold: $4,476.60 ▼ 0.34% | Silver: $66.75 ▼ 0.34% | Brent: $96.28 ▲ 0.80%
Every quote above is Friday, September 4. Markets are closed Sunday. The 10 year is the Treasury daily yield curve close, gold and silver are COMEX front month settlements and Brent is the ICE front month settlement.
Where a mortgage rate actually comes from. The buyers of American debt have changed. Foreign governments now hold about 40% of it, down from more than half around 2008, with China’s holdings off roughly $400B since 2011 and Japan’s share down to 4%. Money market funds and hedge funds filled the gap, and hedge funds alone now hold about $2.4 trillion of Treasuries against $600B in 2014. Treasury said on August 19 it would double its own bond buybacks from $2B to at least $4B a session between September 9 and November 4, which against a roughly $30 trillion market is a rounding error.
Why that lands on a Fremont buyer. The 30 year Treasury crossed 5% in May and again in July, the highest since 2007, and mortgage rates track long yields far more closely than they track the Fed. Until the 10 year falls from 4.78%, 6.89% is roughly what the loan costs. The Fed meets September 16, and after Friday’s jobs report futures put the odds of a rate hike near 58%, up from 49% the day before.
New homes are where the national softness shows. Sales fell 10.5% in July to a 607,000 annual pace, a six month low, and the median new home price dropped to $393,800. We checked that against the Census series rather than taking it on faith: it is the lowest median in exactly five years, with July 2021 the last month at or below it. Builders hold 9.6 months of supply and are discounting to move it. The West was the exception, up 6.2% on the month and 2.2% above last July.
Rents are steadying. Apartment List’s national median reached $1,390 in August, a seventh straight monthly rise and the first August increase since 2022, though still 0.8% below a year ago. Vacancy eased to 7.1%, the lowest since September 2025.
One correction to the source material. C.A.R.’s weekly write up reports consumer confidence falling 0.8 points “in July to 89.4 from a downwardly revised 90.2 in July.” The reading is August’s, not July’s. The Conference Board published 89.4 for August, down from July’s 90.2, with the Expectations Index off 5.8 points to 68.2. The numbers are right and the month label is wrong.
Sources
- Mortgage News Daily (30 and 15 year fixed, September 4 close)
- C.A.R. July 2026 Home Sales and Price Report (statewide 26 days, 99.3% of list)
- C.A.R. July 2026 city market reports (per city days on market and sales to list)
- U.S. Census Bureau and HUD, New Residential Sales, July 2026
- FRED MSPNHSUS (median new home price history, used to check the five year low)
- U.S. Treasury daily yield curve (10 year)
- Apartment List National Rent Report, August 2026
- The Conference Board Consumer Confidence Index
- REALTY EXPERTS® Live Inventory (five city ledger, September 6)
Disclaimer: The market data, rates, and information provided are for informational purposes only and should not be considered financial advice. Always verify rates and data with your lender or financial advisor before making any decisions.