



"At a Glance" Local Housing STATS and News 09/01/26
September 1, 2026 · Alameda County Market Dashboard
TODAY'S LIVE INVENTORY
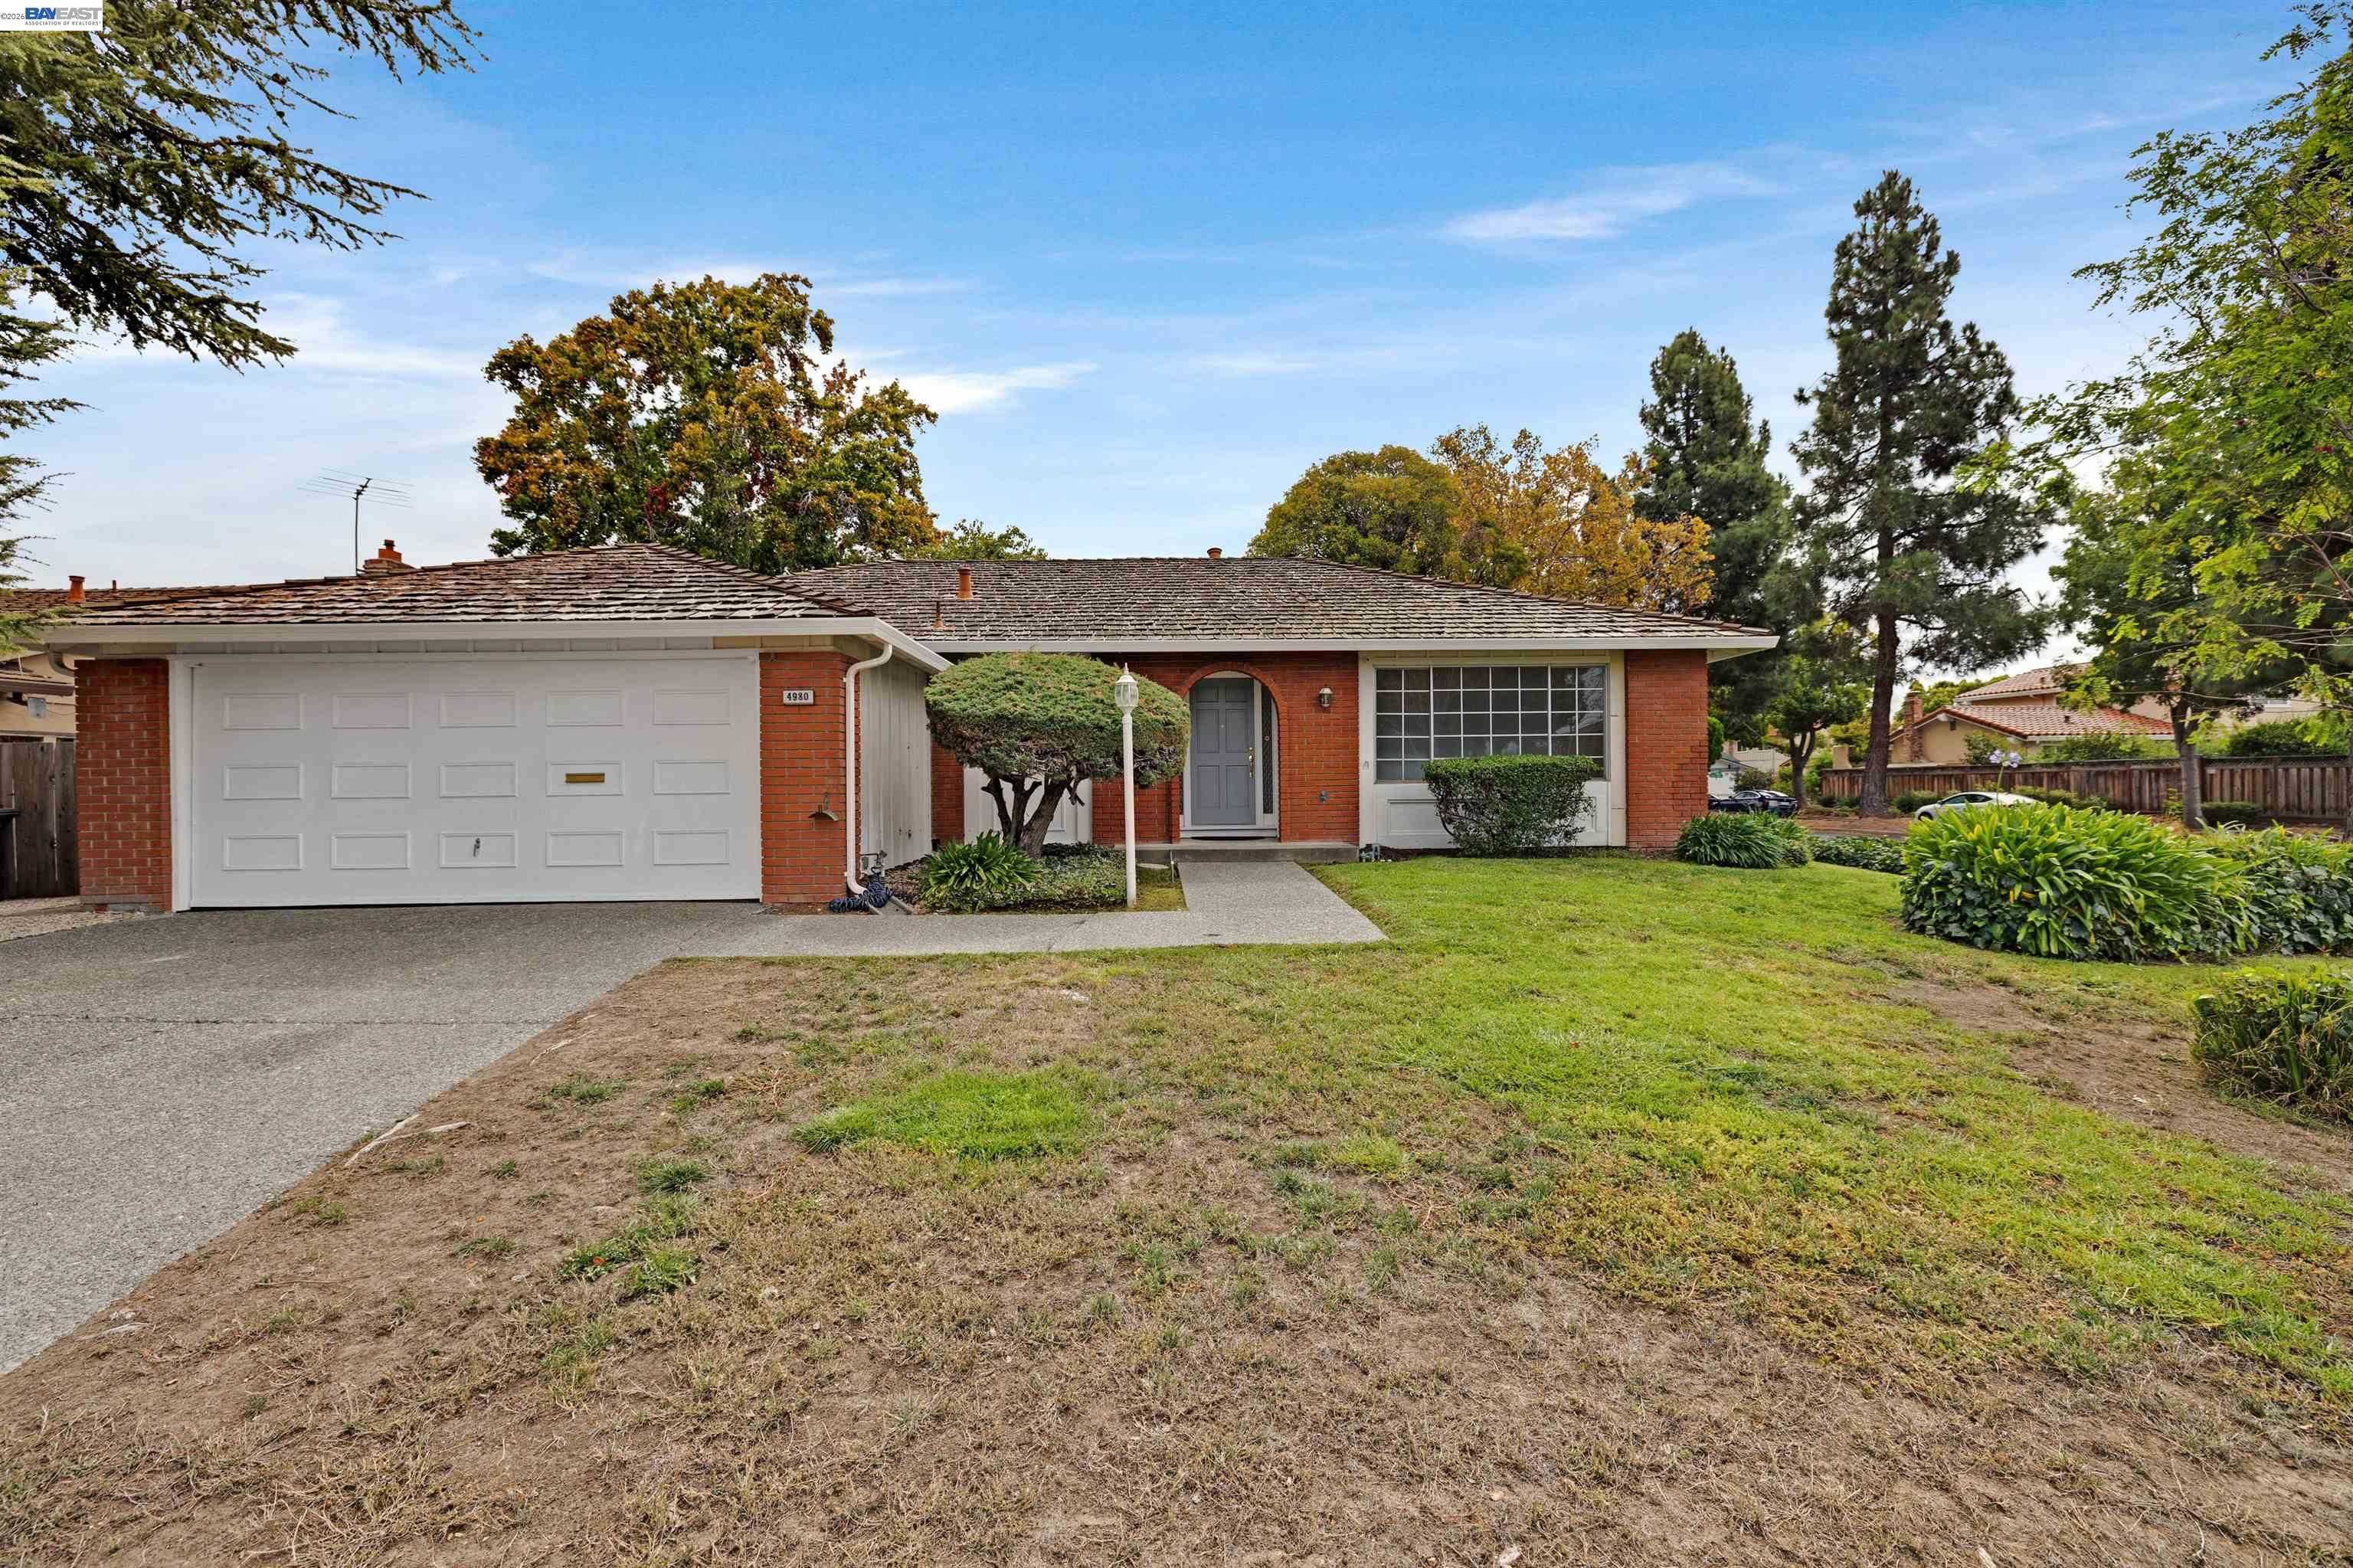
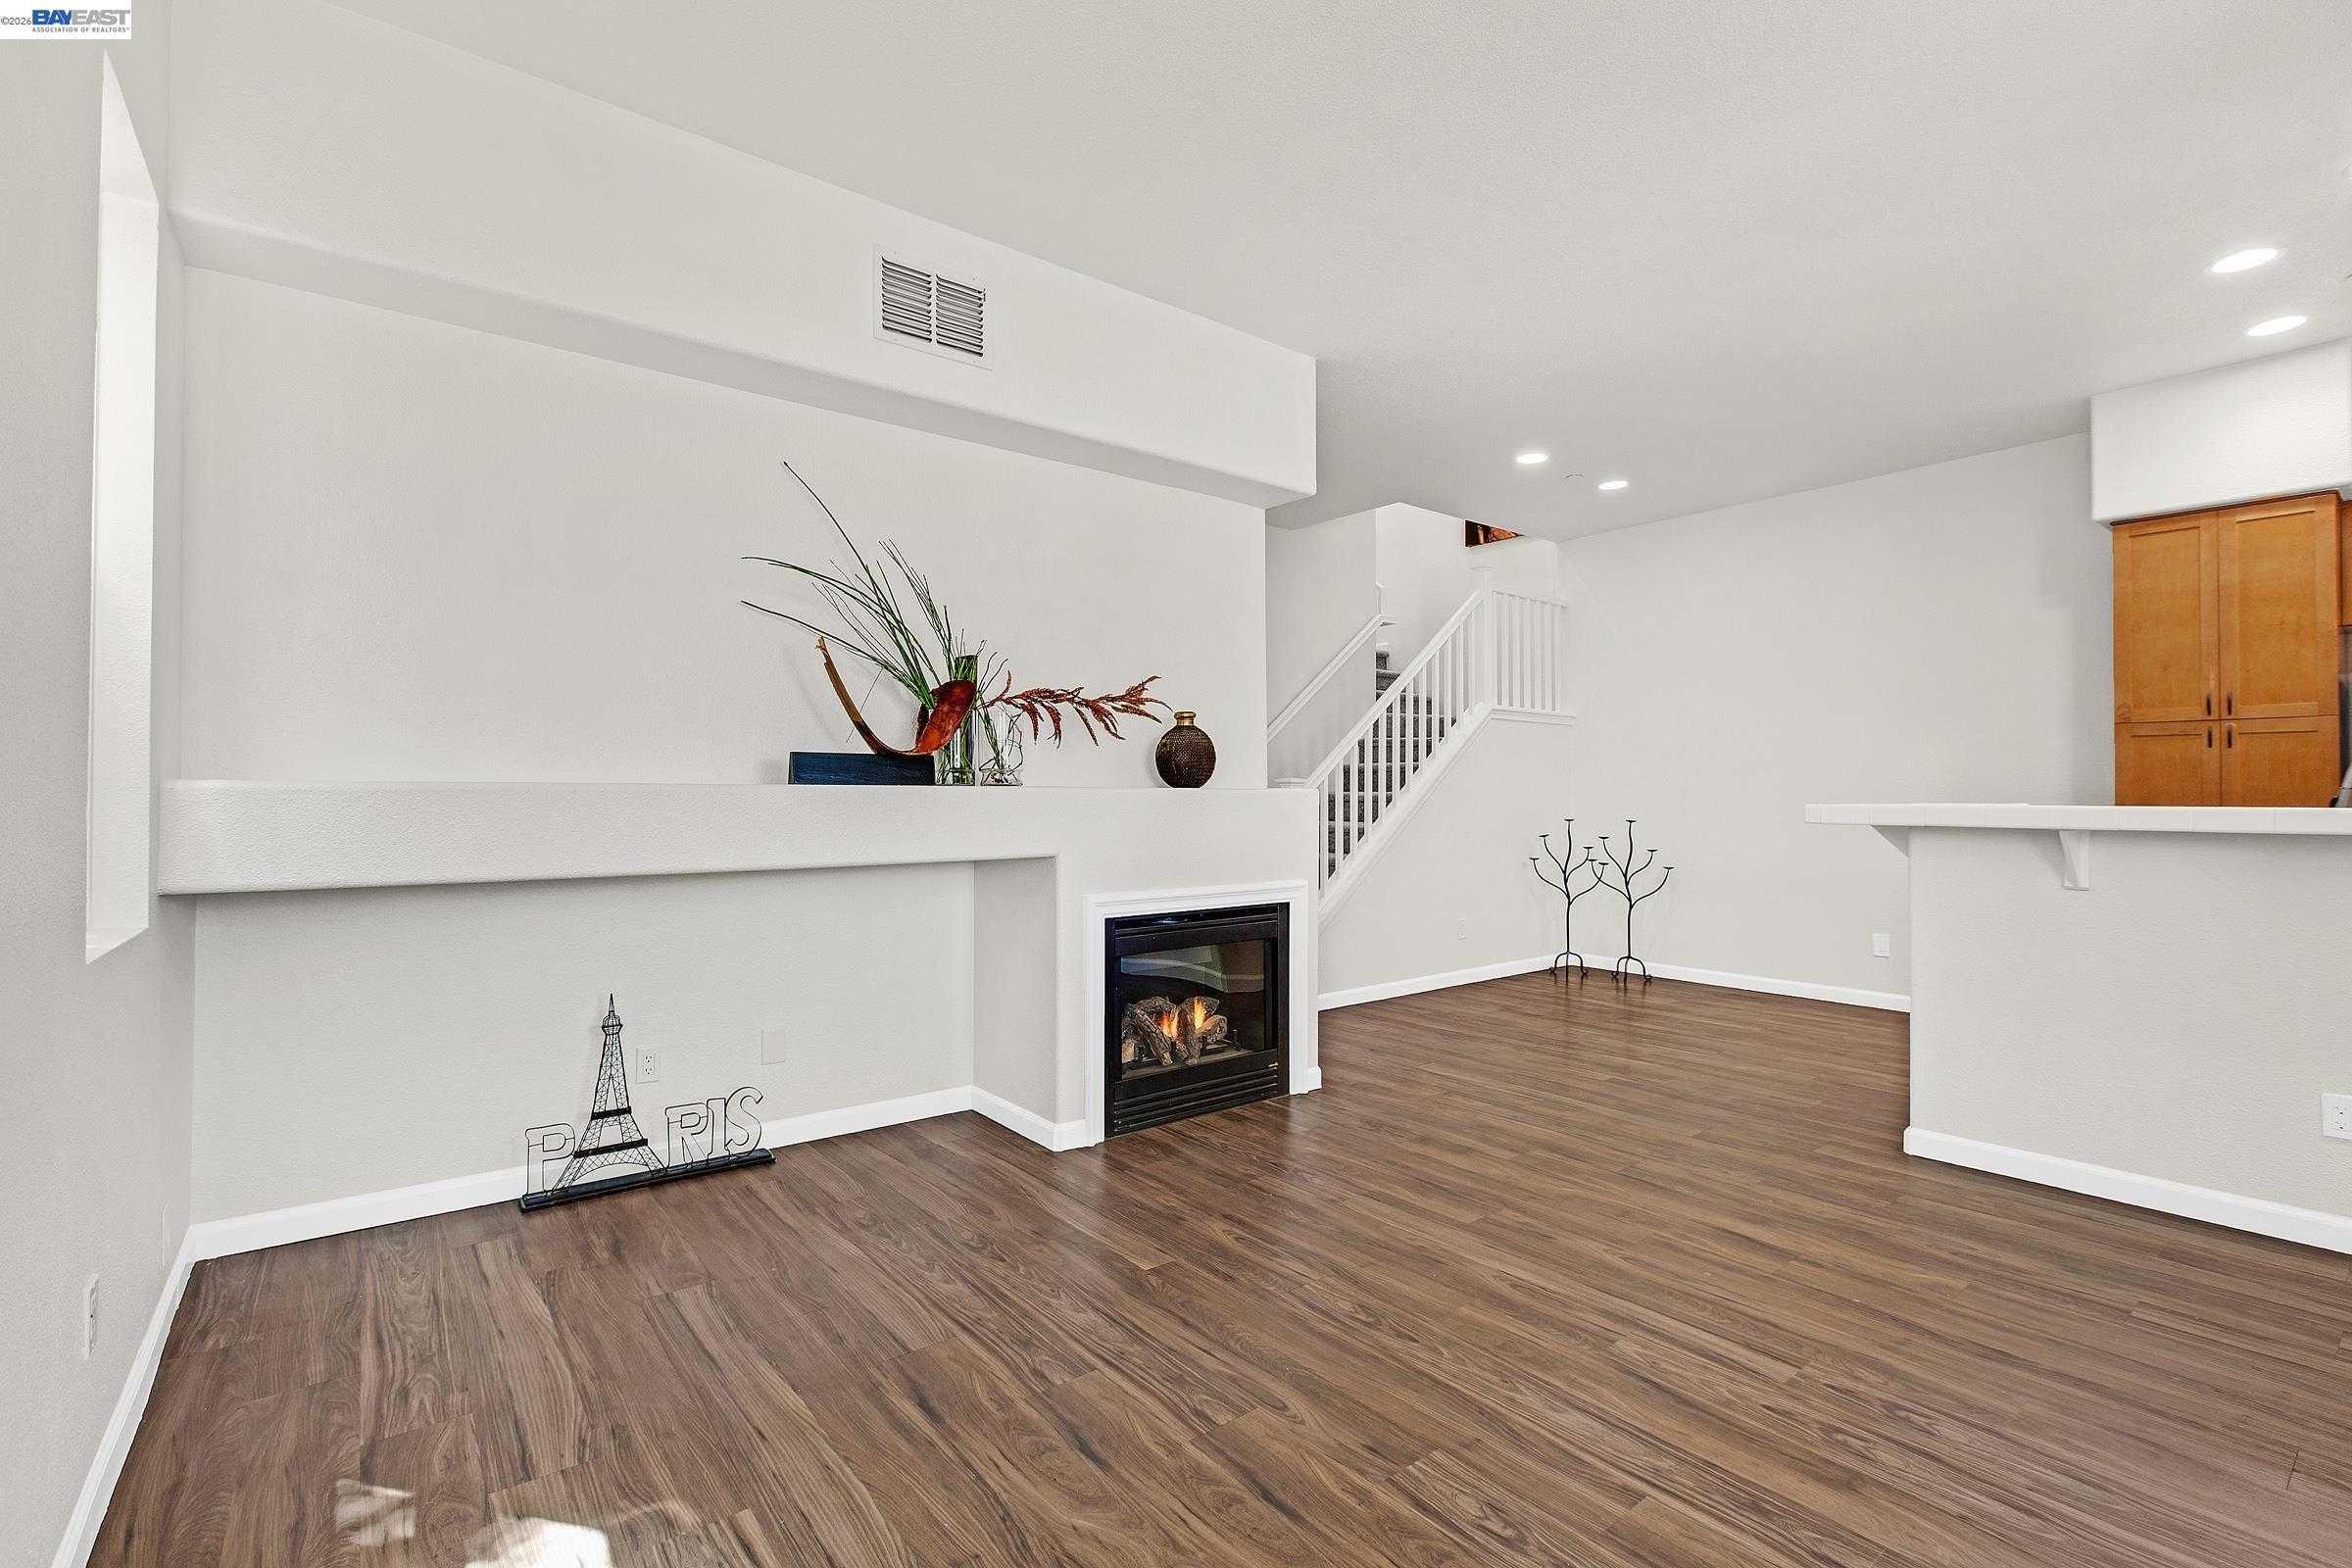
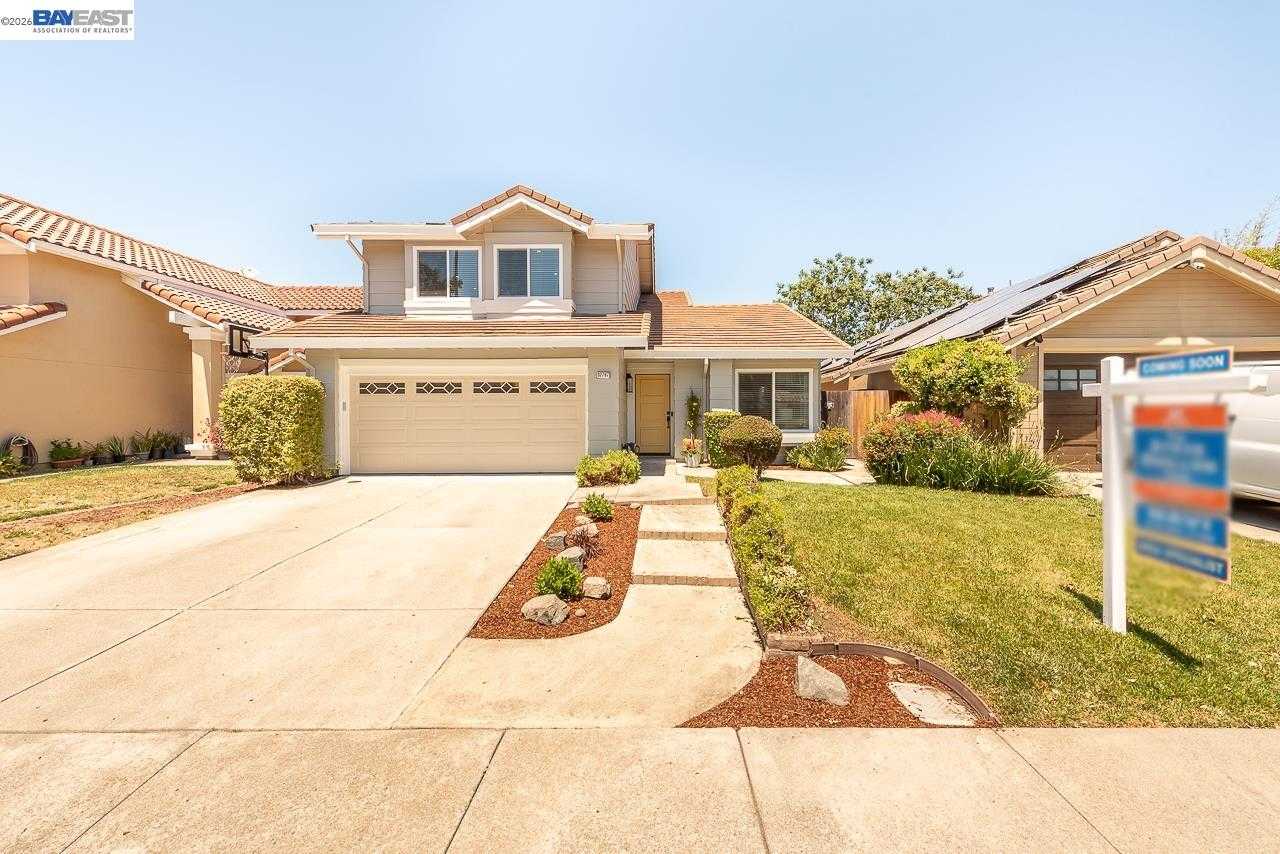
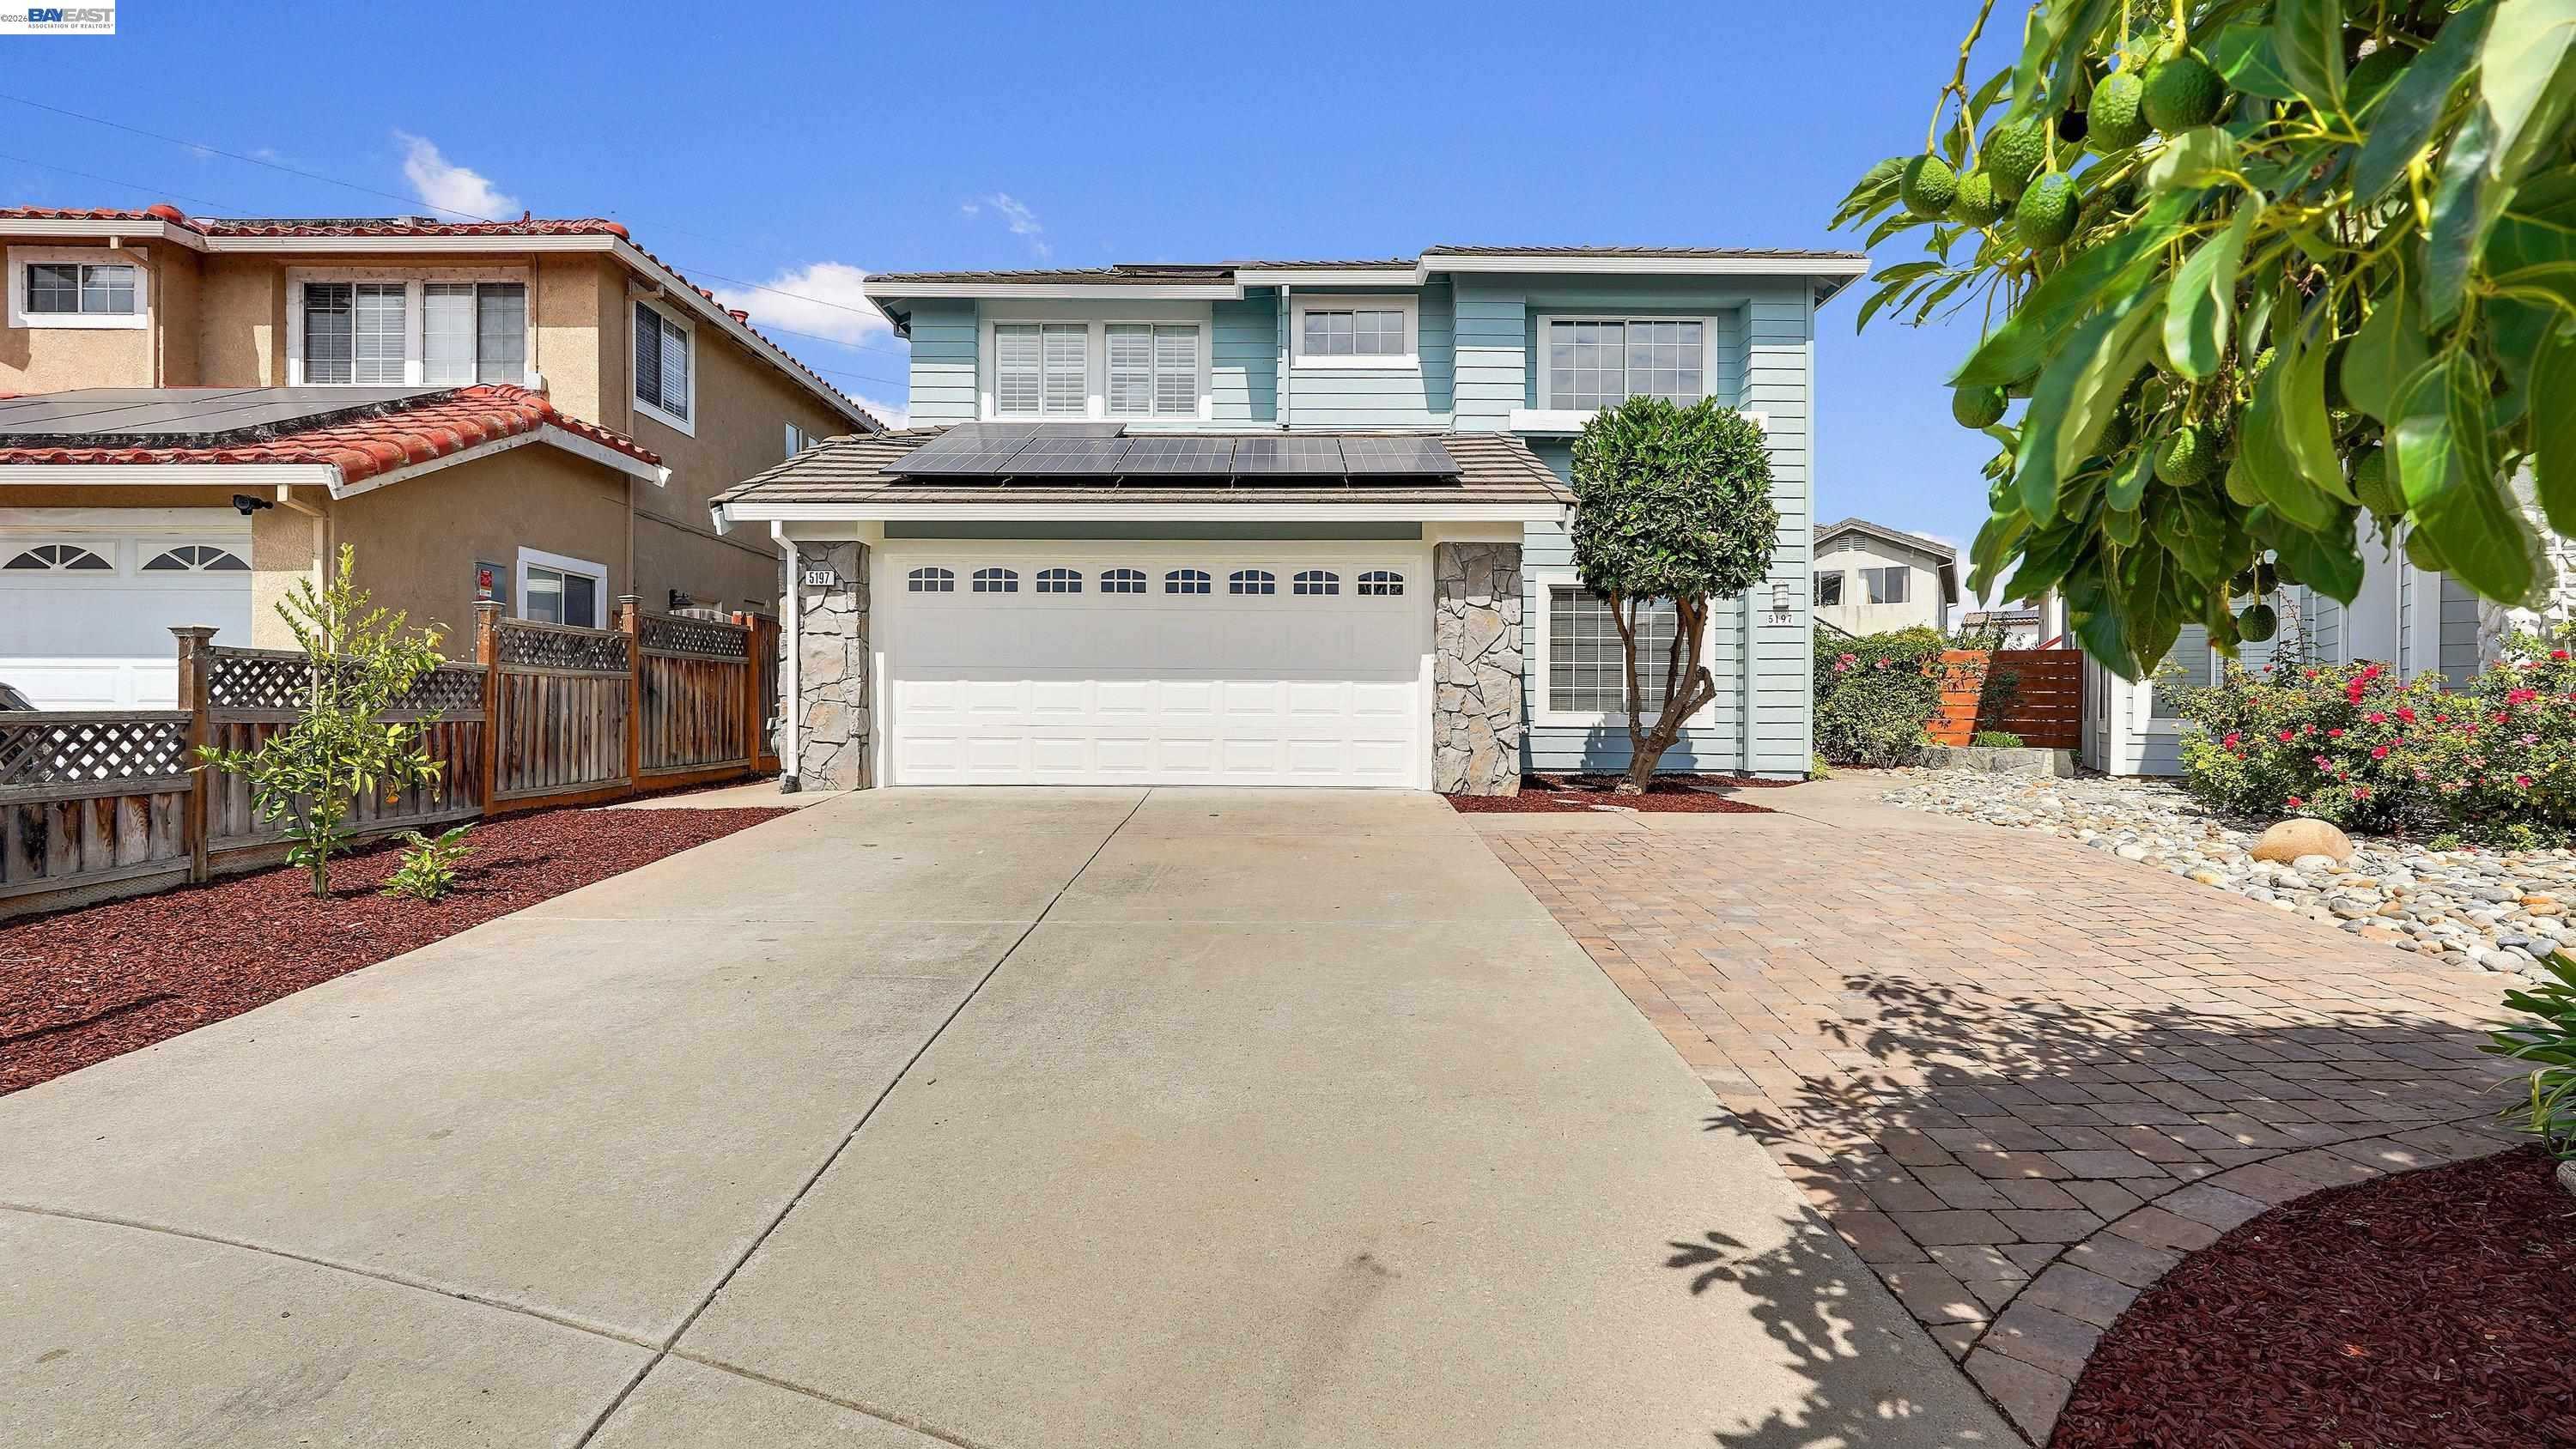
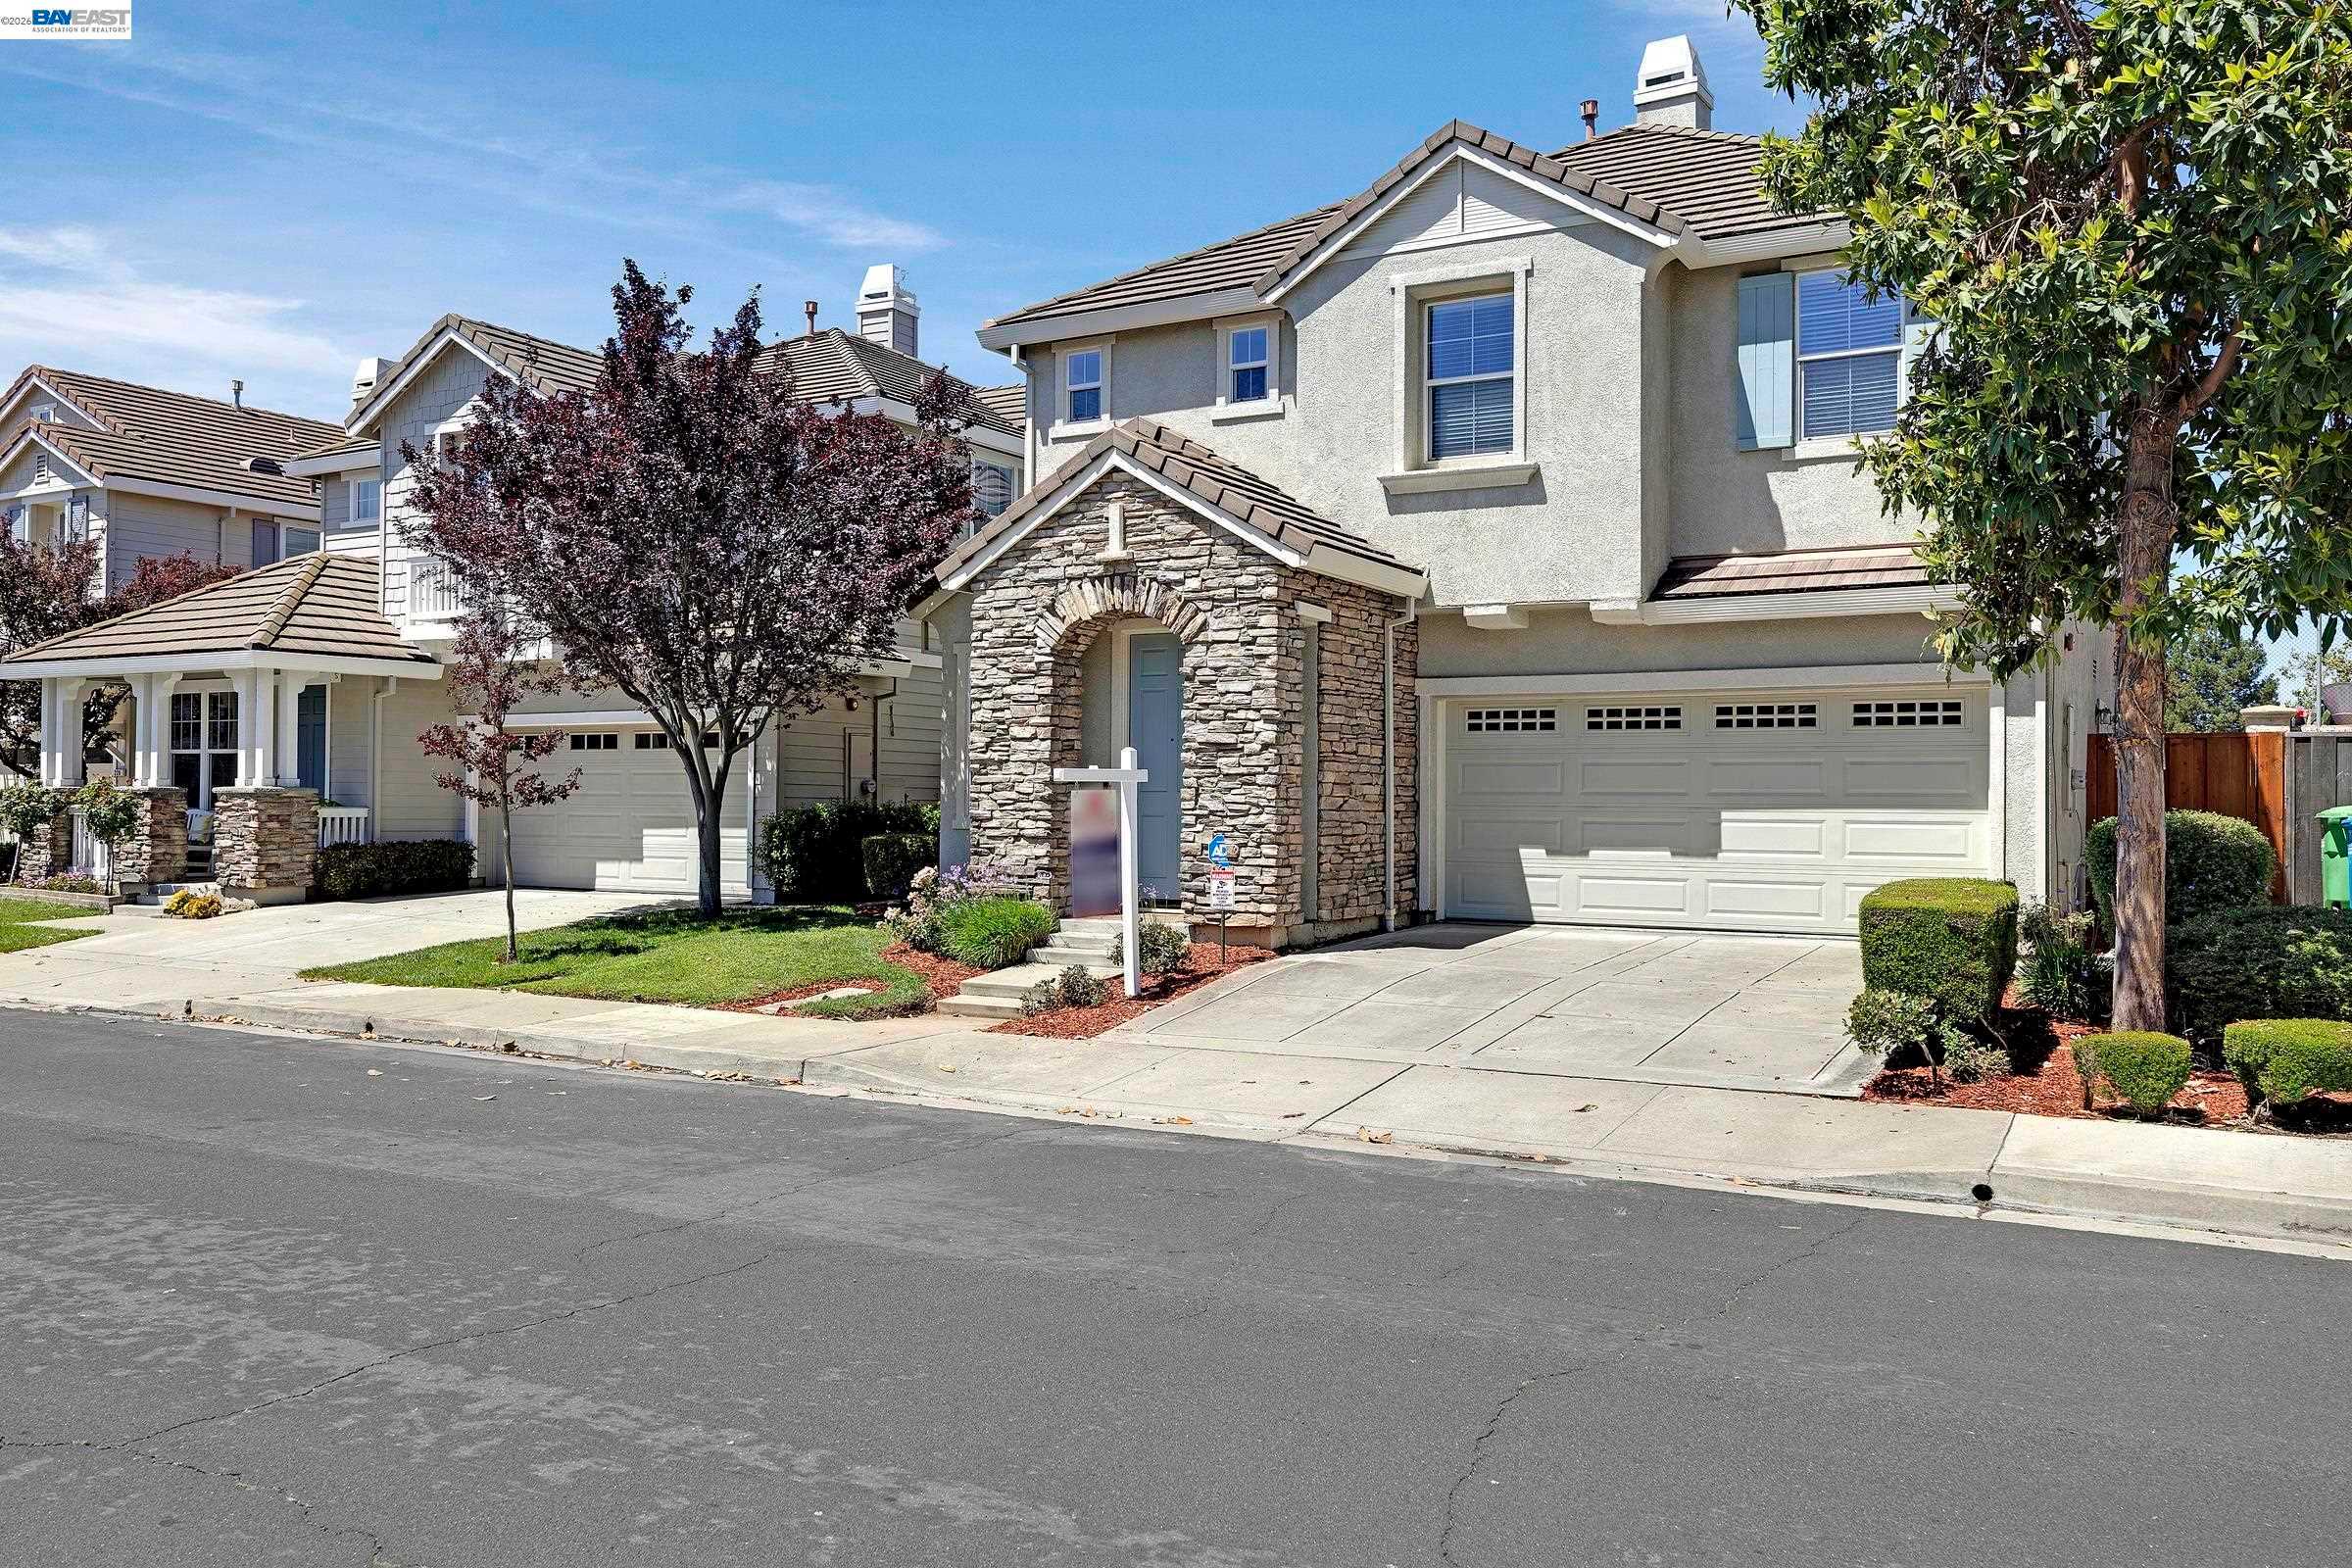
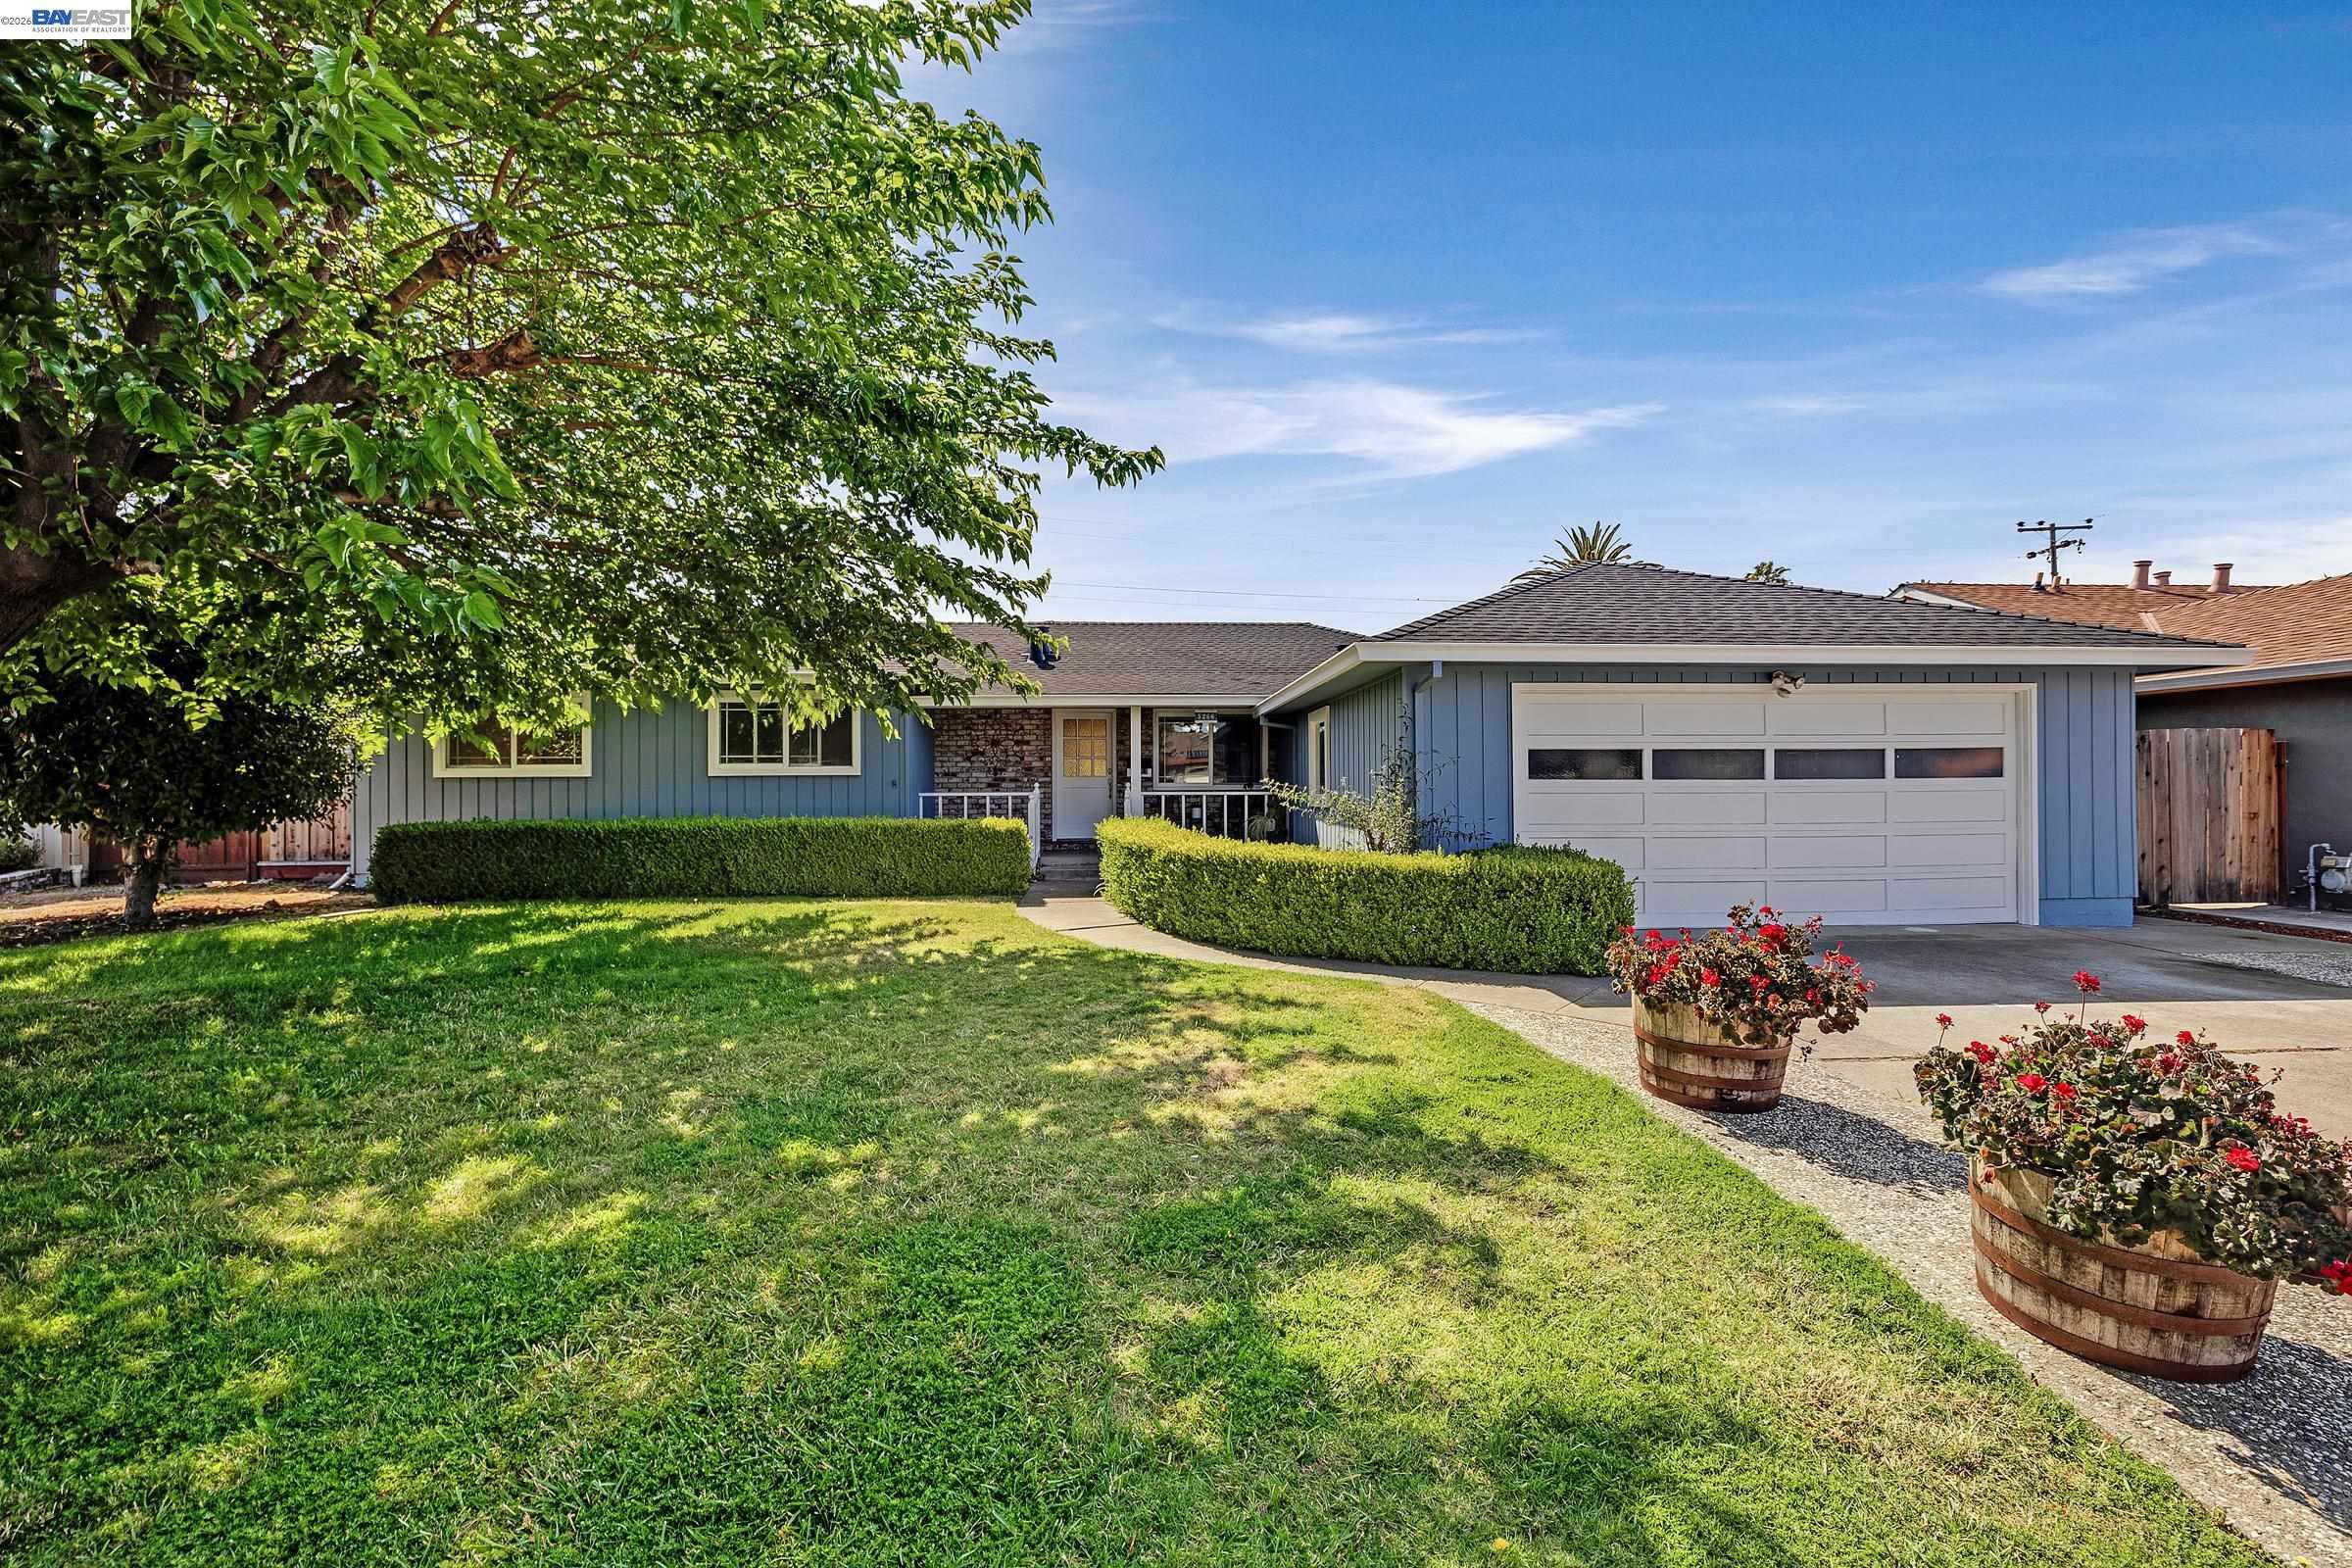
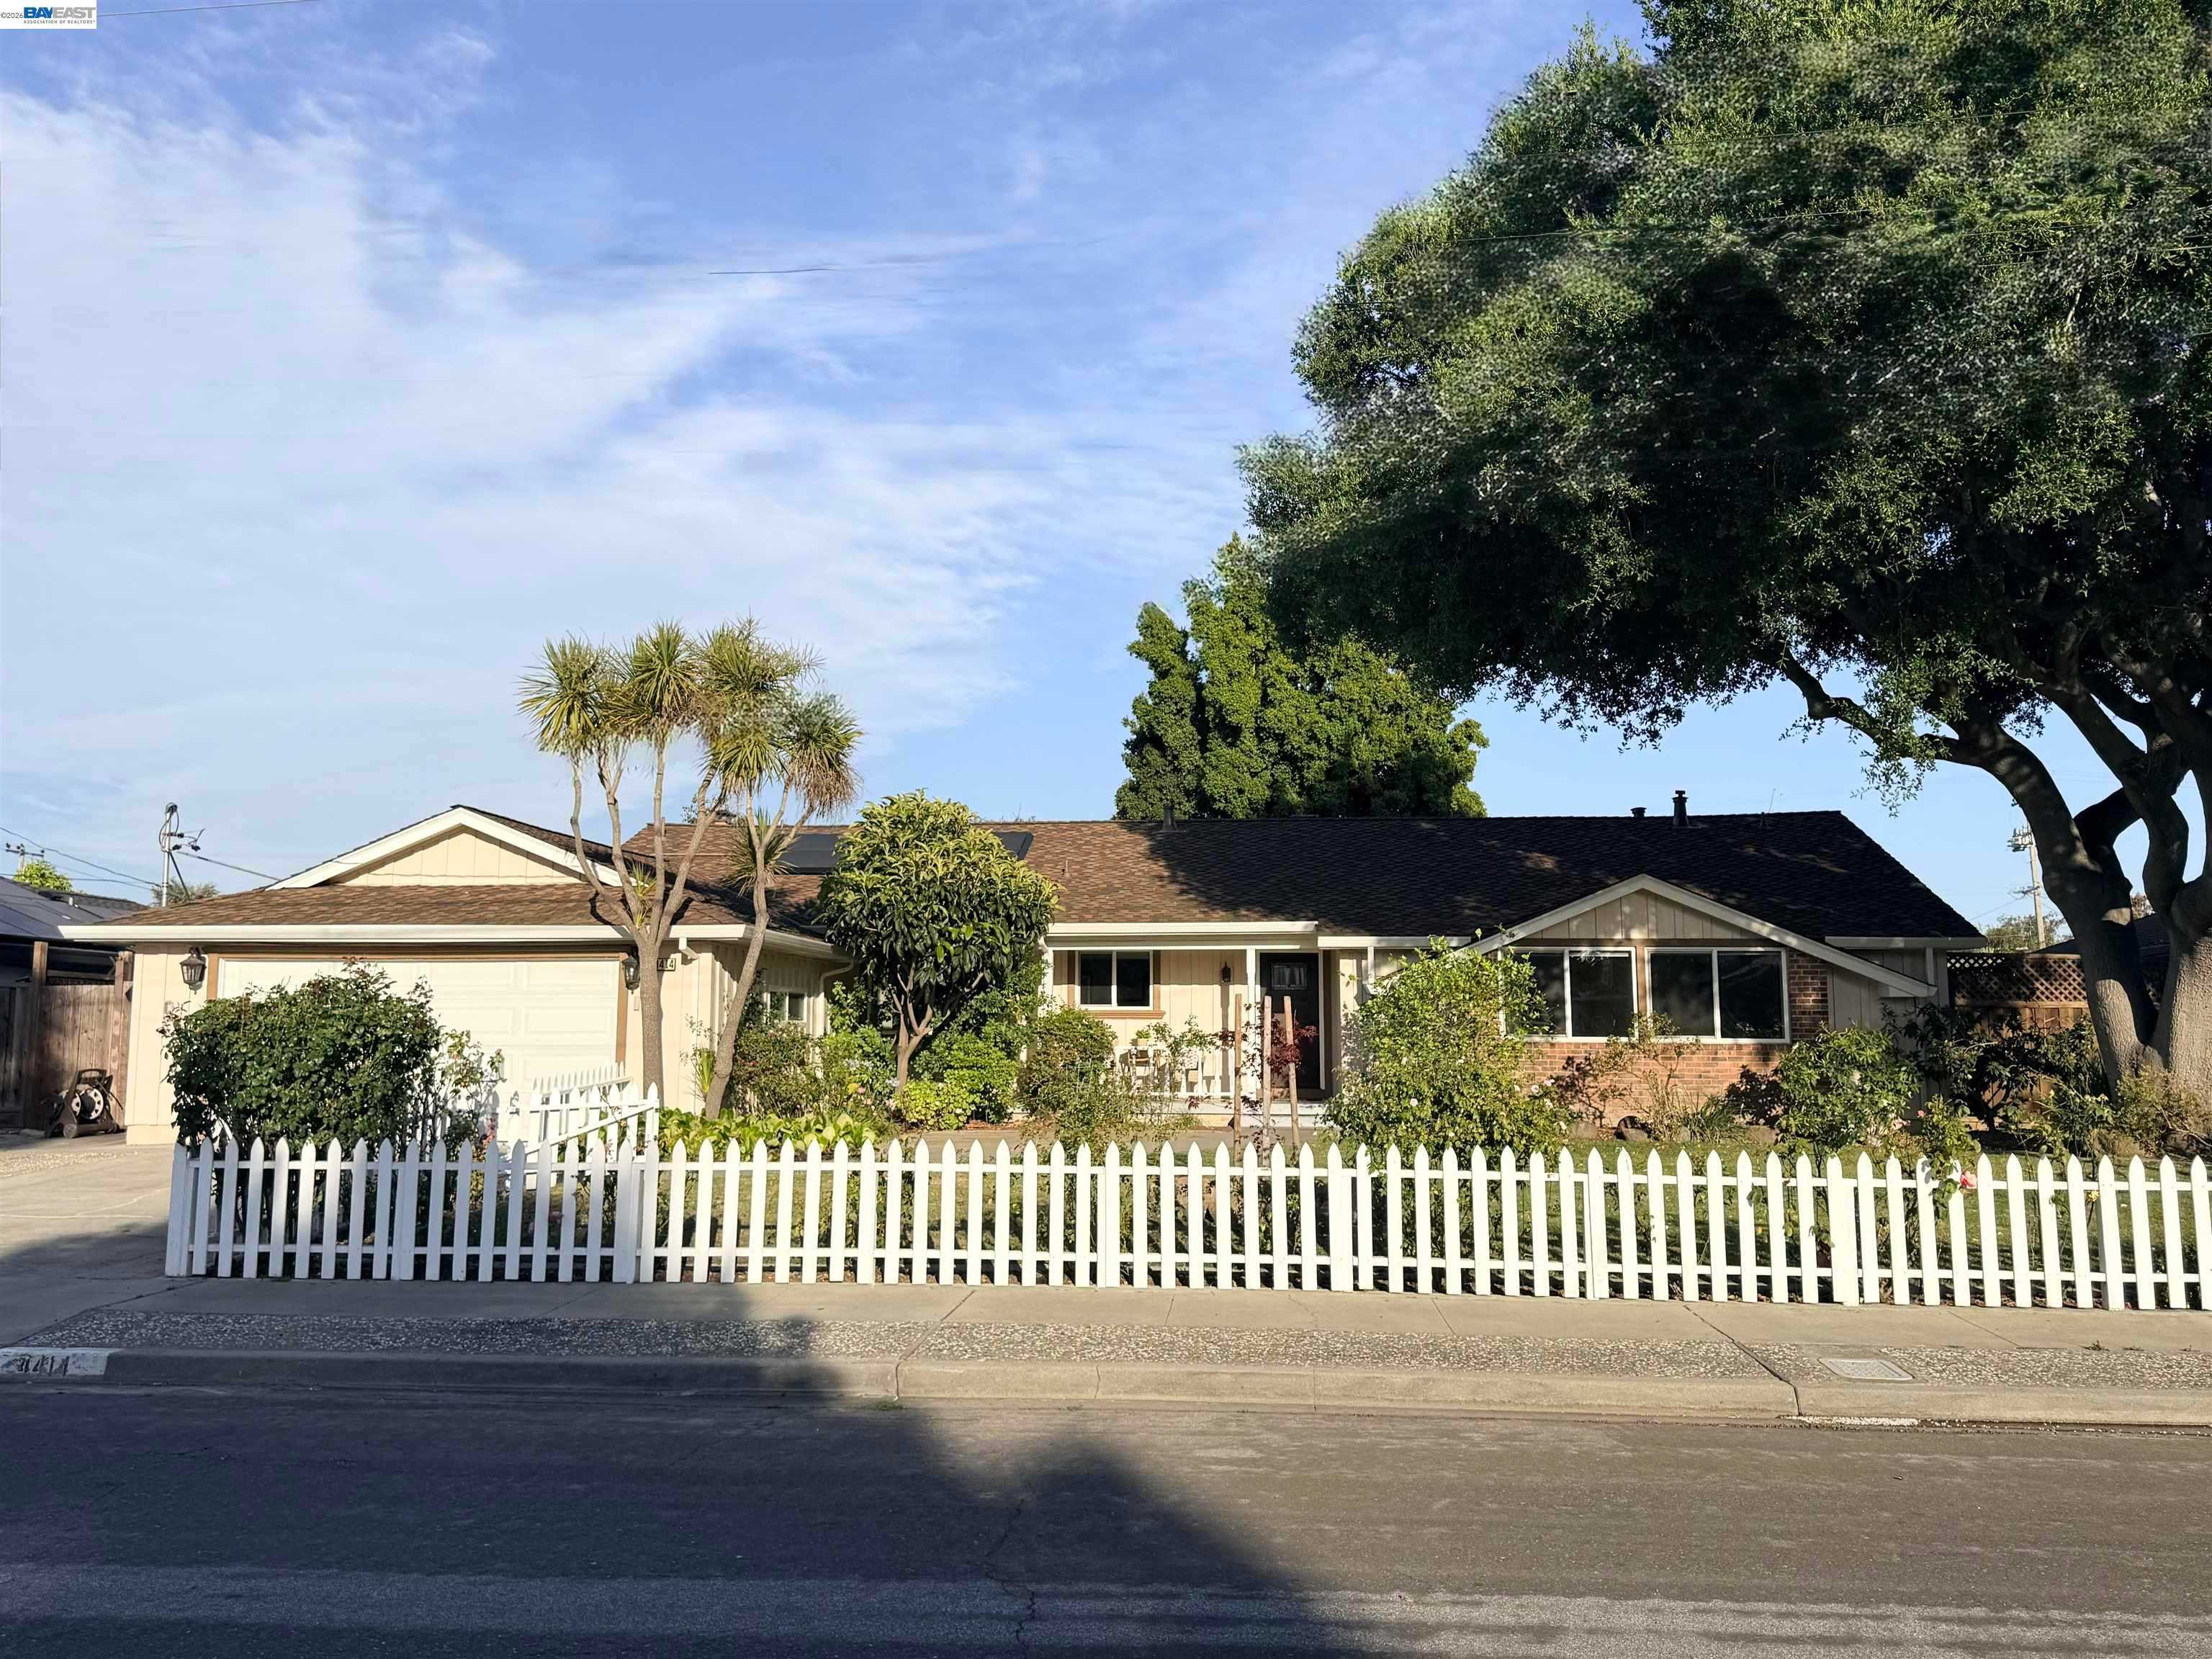
Behind these county totals: hundreds of homes still for sale in Fremont, Hayward, Union City, Newark and Milpitas, one live ledger with prices, sizes and a market read, refreshed each morning from the same MLS export.
30-Year Fixed: 6.87% ▲ 0.06% | 15-Year Fixed: 6.38% ▲ 0.03%
Both rates are now at 52 week highs. The 30 year rose six basis points to 6.87% and the 15 year three to 6.38%, per Mortgage News Daily. On its own published 52 week ranges, 5.99% to 6.87% and 5.55% to 6.38%, both sit exactly at the top. Not near it. At it.
Why, in one line: the long end of the Treasury curve is at a 19 year high. The chart in the Economy section below shows the 30 year yield peaking at 5.31% in August, a level it has not exceeded since June 2007. Mortgages are priced off that curve, so this is not really a mortgage story. It is a bond story that mortgages inherit.
One nuance worth keeping. Mortgage News Daily attributes yesterday's move largely to mechanical month end bond trading rather than to fresh economic news. That distinction matters: month end mechanics can unwind within days, while a 19 year high in the long bond is a slower thing to reverse.
What it costs a buyer, concretely. On a $450,000 purchase with 20% down, the monthly payment is now roughly $2,363, about $207 more than in February.
Locally the board is carrying 2,664 listings across the 15 city board, counting everything active alongside everything in contract, with 196 coming soon and 208 brand new today. That is 80 fewer than yesterday, which is exactly what the first of the month looks like: August's closings came off the board together. Our own 5 city ledger shows 692 homes a buyer can pursue right now, including 64 brand new listings and 98 more coming soon. The full, always-updating ledger lives at harvrealtor.net/live-inventory.
Today’s Live Inventory (buyable now)
- Fremont: 267 available (200 active, 28 new, 39 coming soon)
- Hayward: 185 available (149 active, 20 new, 15 coming soon)
- Milpitas: 111 available (79 active, 3 new, 29 coming soon)
- Newark: 74 available (56 active, 9 new, 9 coming soon)
- Union City: 55 available (45 active, 4 new, 6 coming soon)
Do not read the drop as demand leaving. Board wide supply fell 80 and Fremont's active count fell 10 to 237, but 208 listings came on new this morning and 196 more are staged as coming soon. This is the calendar turning over, not the market thinning out.
Fremont's pending count is 97, back under 100 after yesterday's 101. Across seven sessions it has printed 102, 102, 102, 101, 99, 101, 97. That is a market drifting sideways with a slight downward tilt, not one that is turning.
Median asking in Fremont is $1,289,000 at 29 median days on market, up about $39,000 from yesterday. That is a mix effect running the opposite direction from yesterday's drop, and it is precisely why one day's median move is not a price signal. Newark remains the quickest of the five at 25 median days.
For a seller listing this week: rates just hit a 52 week high on both terms, so your buyer's monthly payment went up while your asking price did not come down. The listings that move in September are the ones priced for the payment, not for the comp.
US 10-Year: 4.75% ▲ 0.02% | Gold: $4,331 ▼ 2.41% | Silver: $65.03 ▼ 3.44% | Brent: $90.49 ▲ 1.32%
The 30 year yield is back where it was in 2007
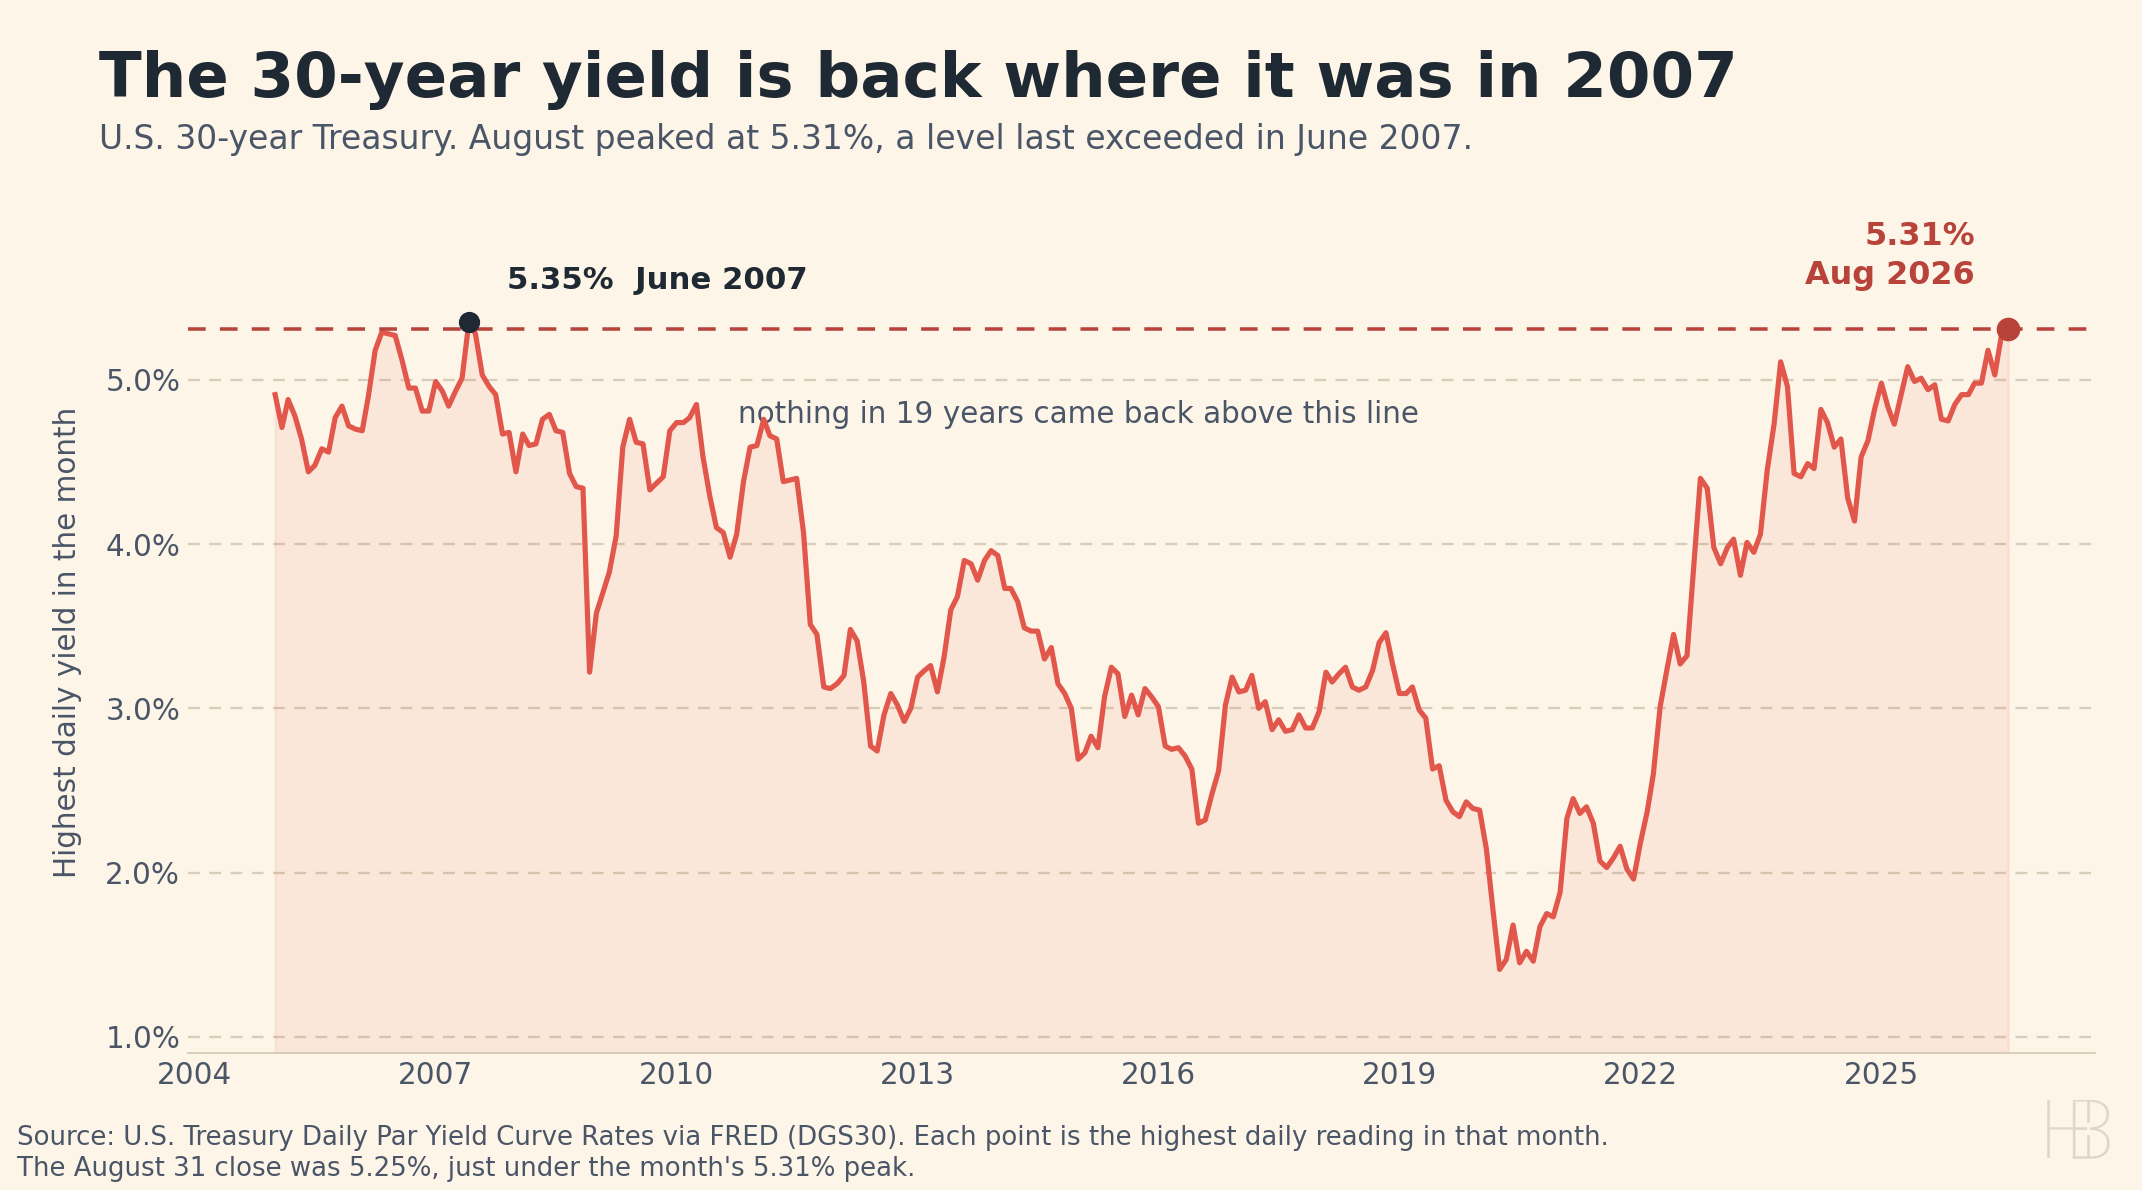
The version of this chart circulating this morning plots only the eight months of 2026, which asserts the nineteen year claim without letting you see it. This one runs back far enough that the eye can check it. Every mortgage in the country is priced off the long end of this curve, which is what ties it to the Real Estate section above.
The metals slide is now three sessions old and it is the biggest move in this section. On our own series gold has gone $4,608 Friday morning, $4,438 yesterday, $4,331 today, and silver $70.62 to $67.35 to $65.03. That is roughly 6% off gold and 8% off silver inside three mornings.
One caveat on today's gold figure. Fortune's spot print is $4,331 and its own table puts the day down 2.41% from yesterday's $4,438, which reconciles. But gold futures are near $4,406 as this is written, about 1.7% above that spot print, and the same page's prose calls the move a gain when its own numbers show a decline. The direction is not in doubt and neither is the three day trend, but the size of today's move specifically is uncertain by roughly a percentage point, and it is worth quoting that way.
The ten year finished August at 4.75%, two basis points higher, on Treasury's own daily curve. Brent settled at $90.49, up 1.32% from Friday.
S&P 500: 7,686 ▼ 0.33% | DOW: 53,185 ▼ 0.70% | NASDAQ: 26,370 ▼ 0.12%
August closed soft. The DOW gave back seven tenths, the S&P a third, the NASDAQ a tenth.
About that September statistic
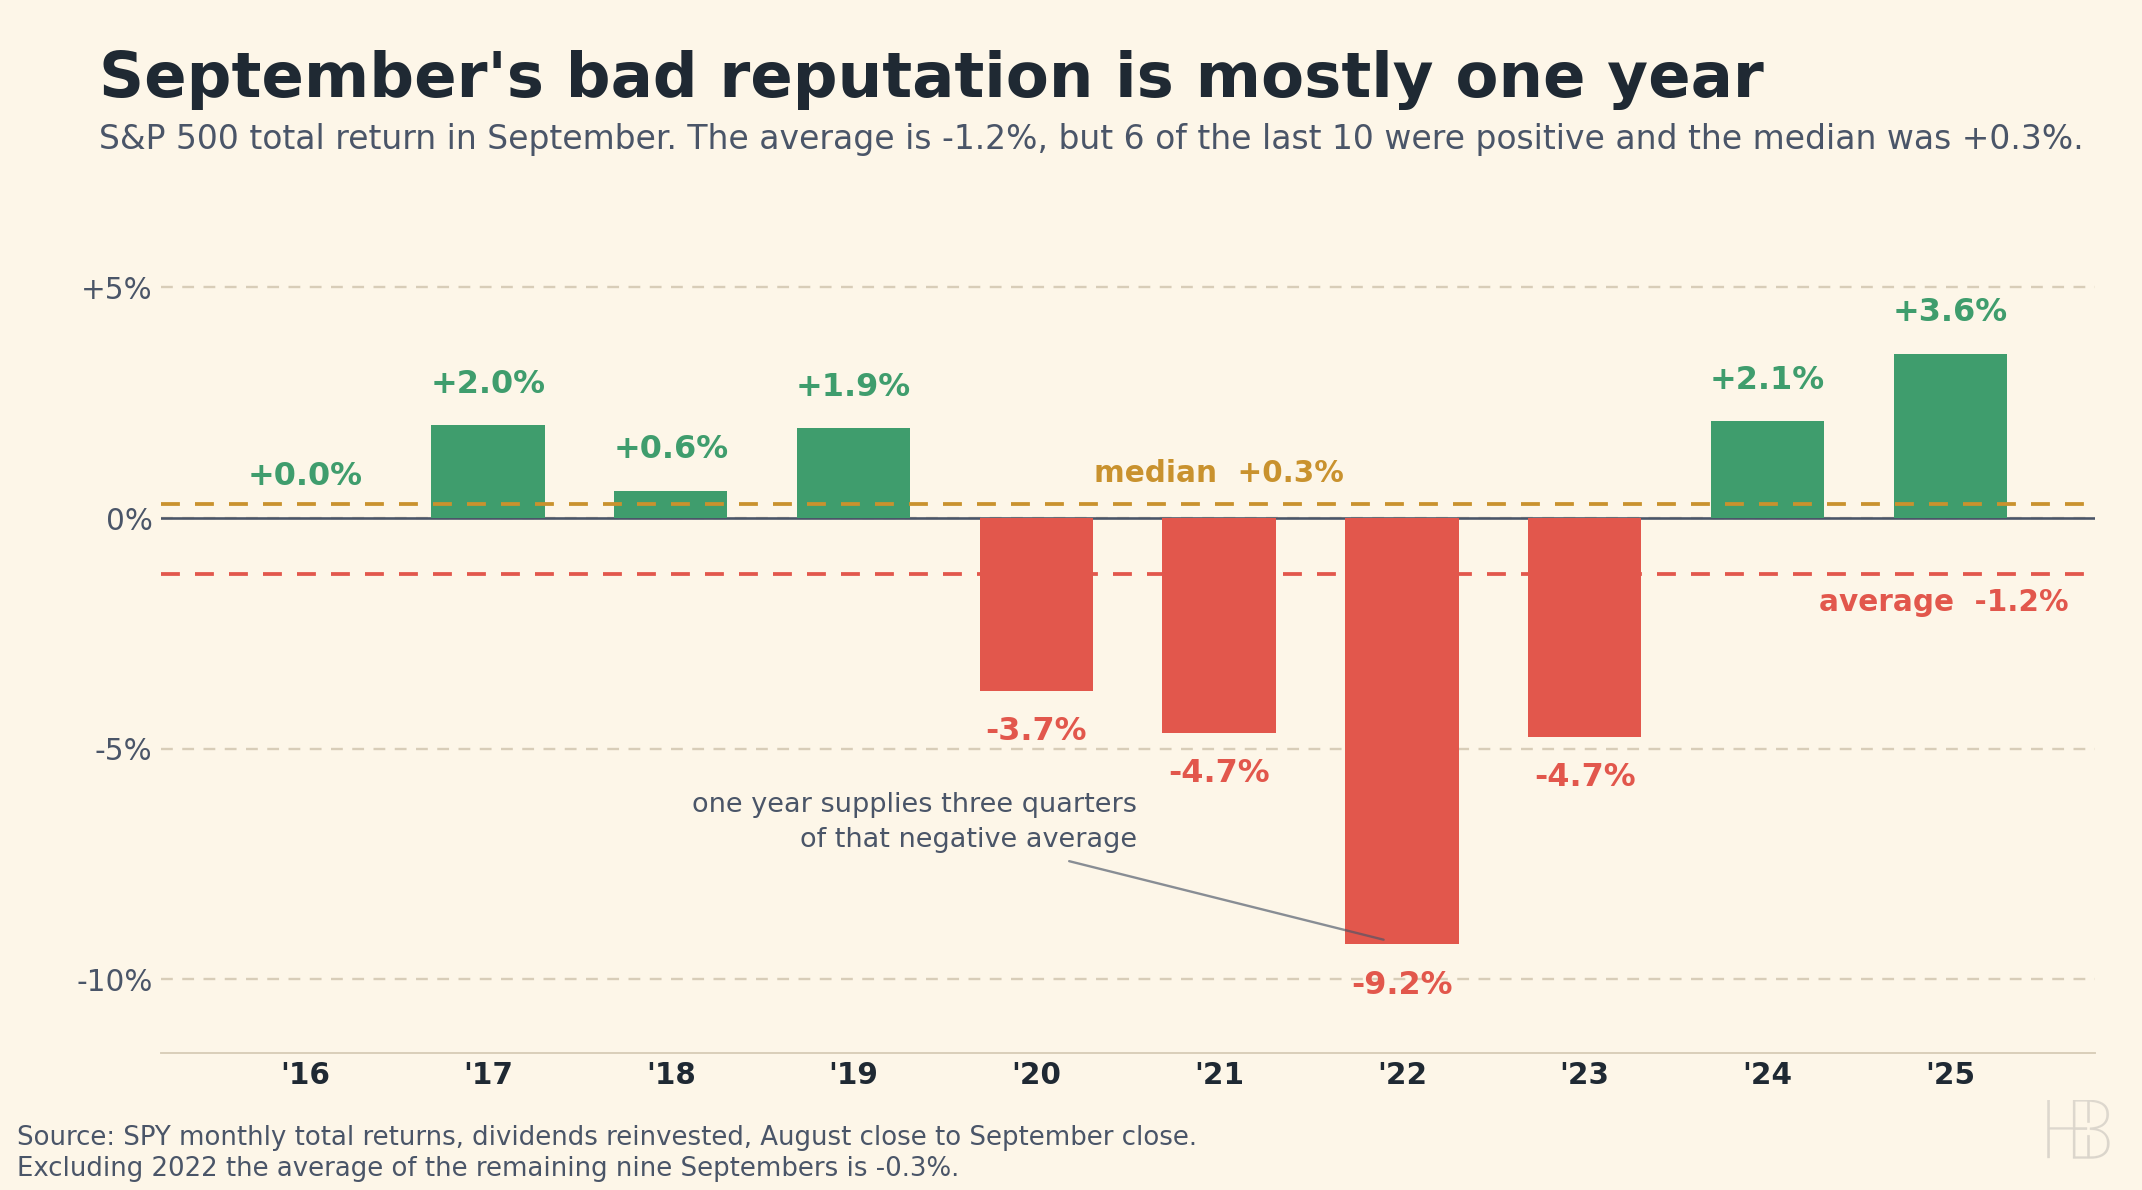
You will hear all week that September is the worst month for stocks and that the S&P averages a 1.2% loss. Every number in that claim is correct. We checked all ten years against SPY monthly total returns and they match to a hundredth of a point.
The distribution says something the average does not. Six of those ten Septembers were positive and only four were negative. The median September gained 0.3%. And 2022 alone, at negative 9.2%, supplies about three quarters of the negative mean: drop that single year and the other nine average negative 0.3%. The two most recent Septembers, 2024 and 2025, were the two best in the window. A mean of ten observations dragged by one outlier is a fact about 2022, not a rule about Septembers.
Elsewhere, Nvidia put $3.5 billion into MediaTek through convertible bonds, and Shein's Hong Kong listing raised about $1.6 billion at a $26 billion valuation, down from roughly $98 billion in 2022.
BTC: $77,805 ▼ 0.66% | ETH: $2,438 ▼ 1.07% | XRP: $1.37 ▲ 0.10%
Quiet and slightly lower. Bitcoin is holding just under $78,000 and XRP is the only one of the three in the green, barely.
Yesterday's point was that the Bitcoin treasury story is really one company. That company moved. Strategy bought $369.7 million of Bitcoin in the week ended August 30, its first purchase after a ten week pause, and the stock rose 4.4% on the news. It still holds the largest corporate Bitcoin position in the world, around $65 billion, and it is still down roughly 60% over the past year. Buying the dip with shares that have fallen 68% since July of last year is the same machine that got it here, running again.
Sources
- Mortgage News Daily (mortgage rates)
- Market Briefs (market data)
- U.S. Treasury (daily par yield curve)
- FRED (30-year Treasury constant maturity history)
- Yahoo Finance (SPY monthly total returns)
- Yahoo Finance (Brent front-month futures)
- Fortune (gold spot)
- Fortune (silver spot)
- CoinGecko (crypto quotes)
- Live Inventory (5-city MLS board)
Disclaimer: The market data, rates, and information provided are for informational purposes only and should not be considered financial advice. Always verify rates and data with your lender or financial advisor before making any decisions.