



"At a Glance" Local Housing STATS and News 08/31/26
August 31, 2026 · Alameda County Market Dashboard
TODAY'S LIVE INVENTORY
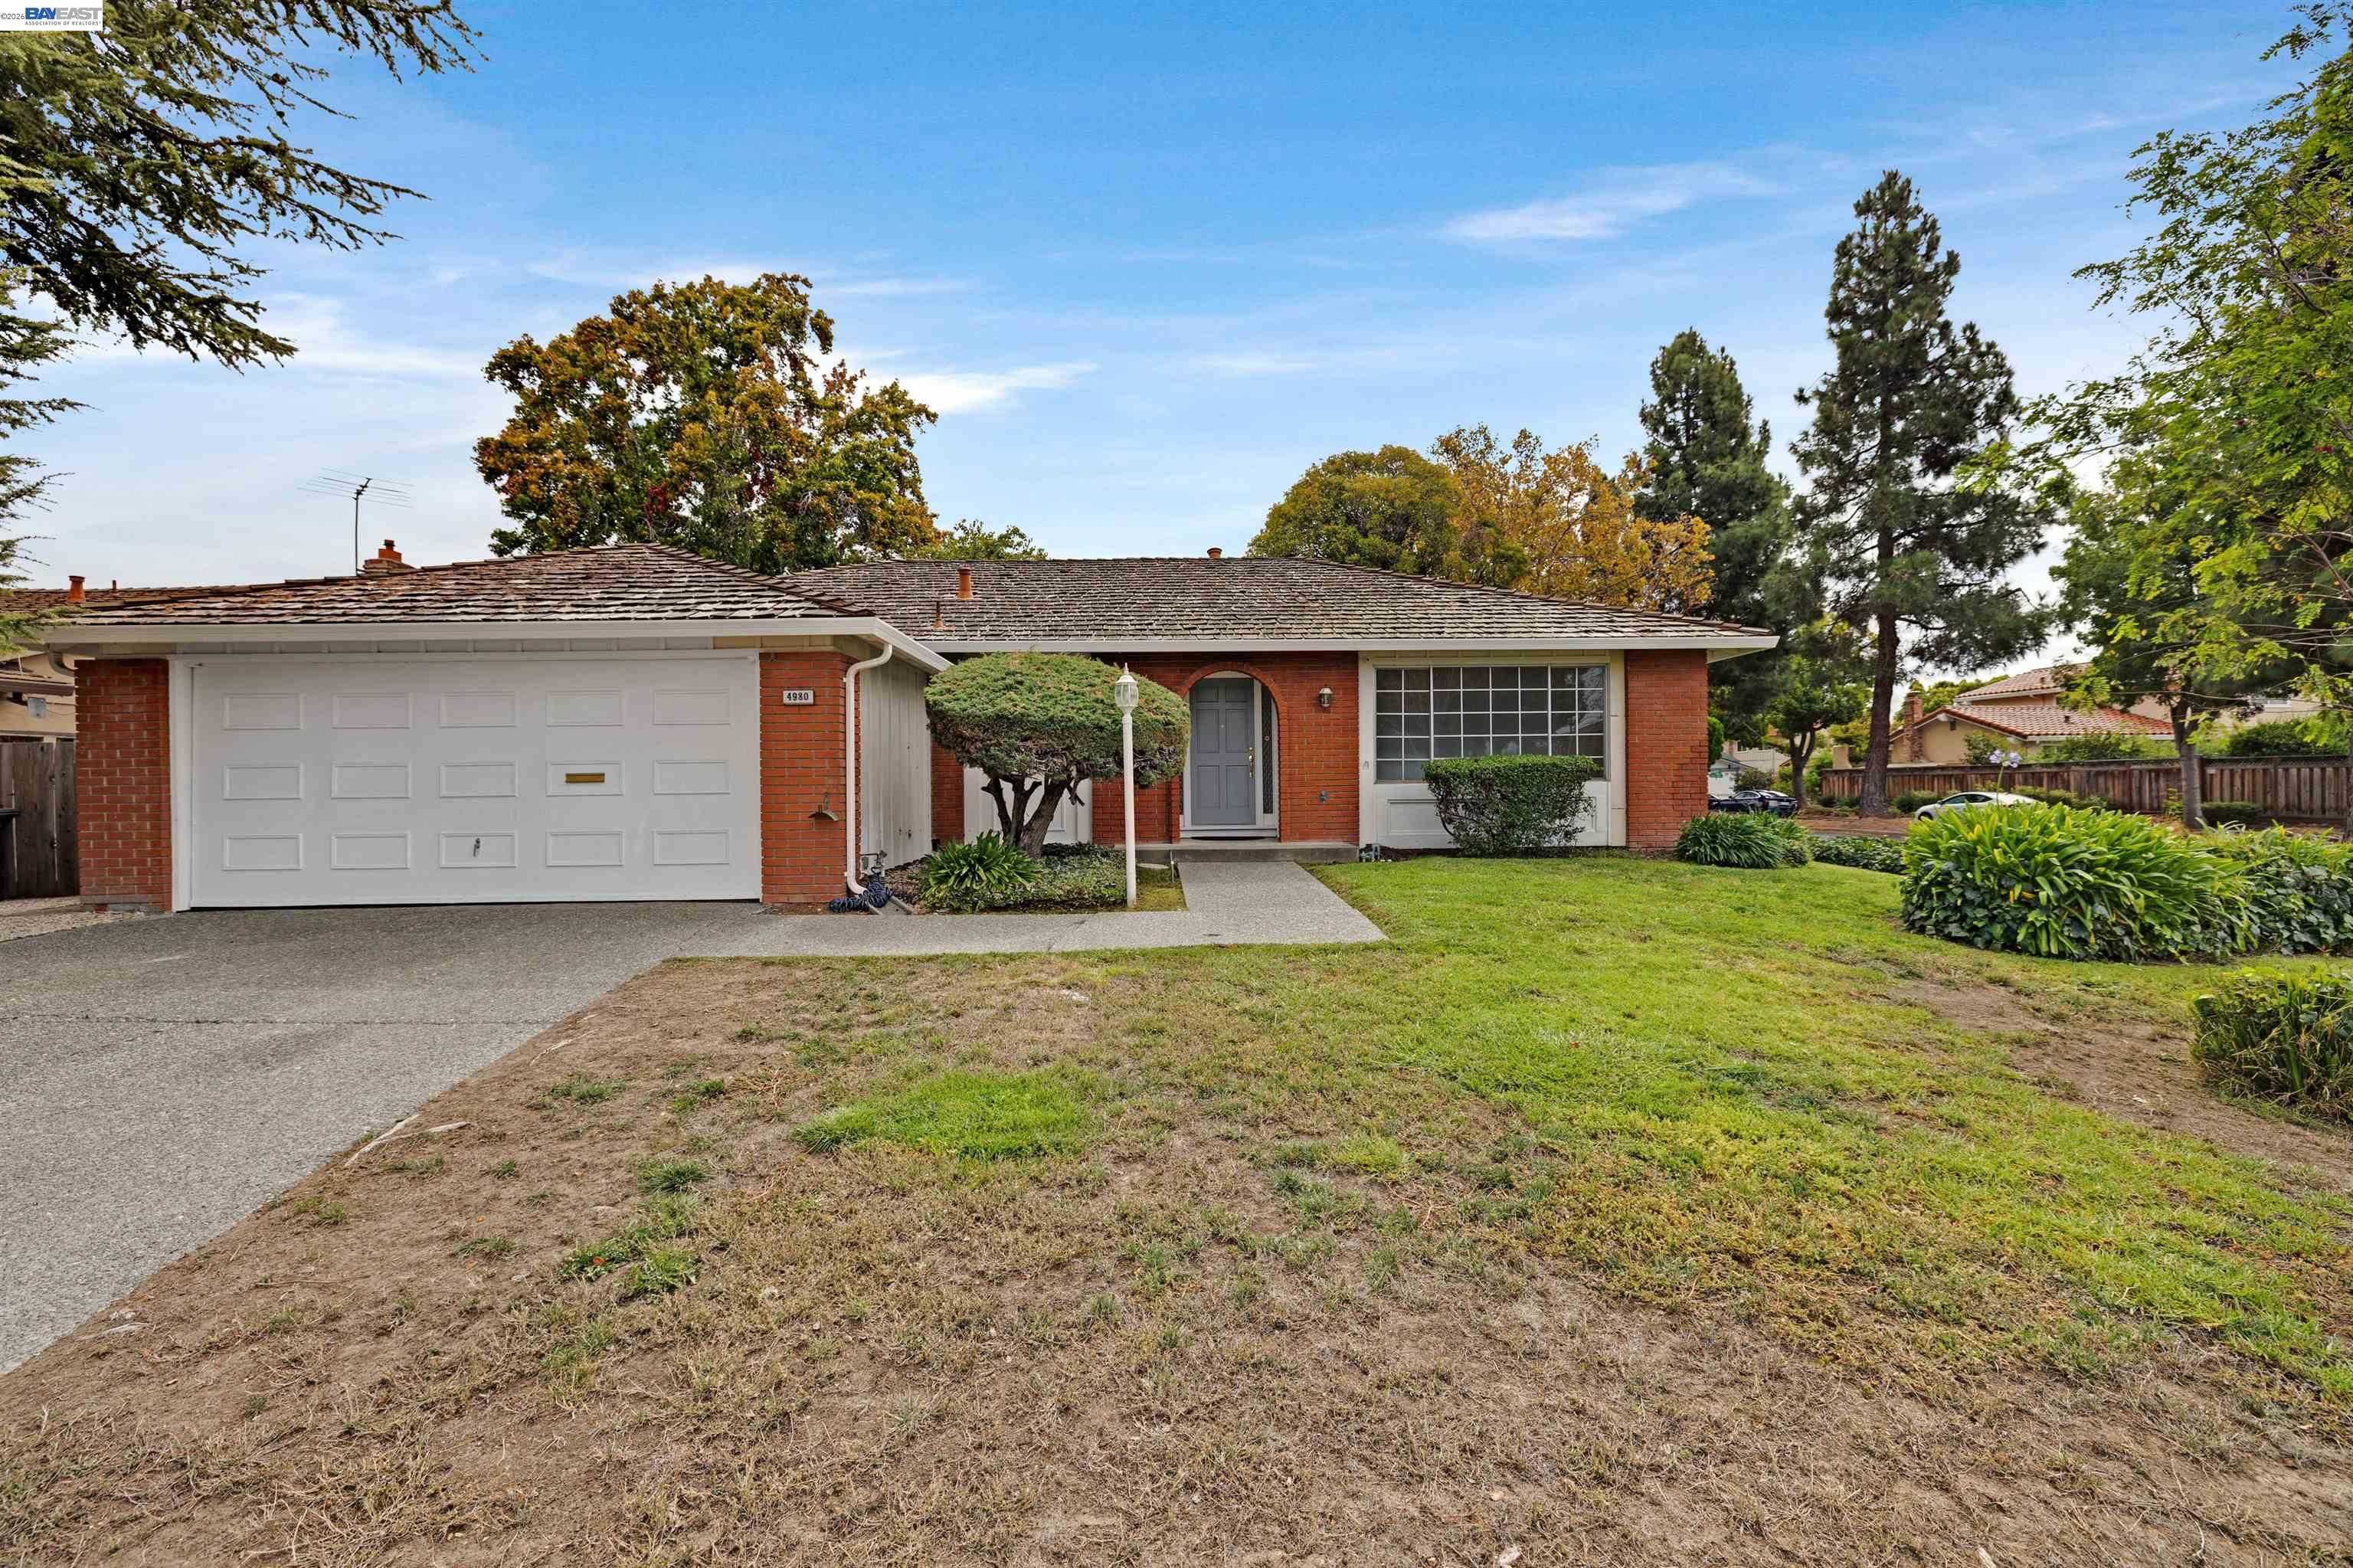
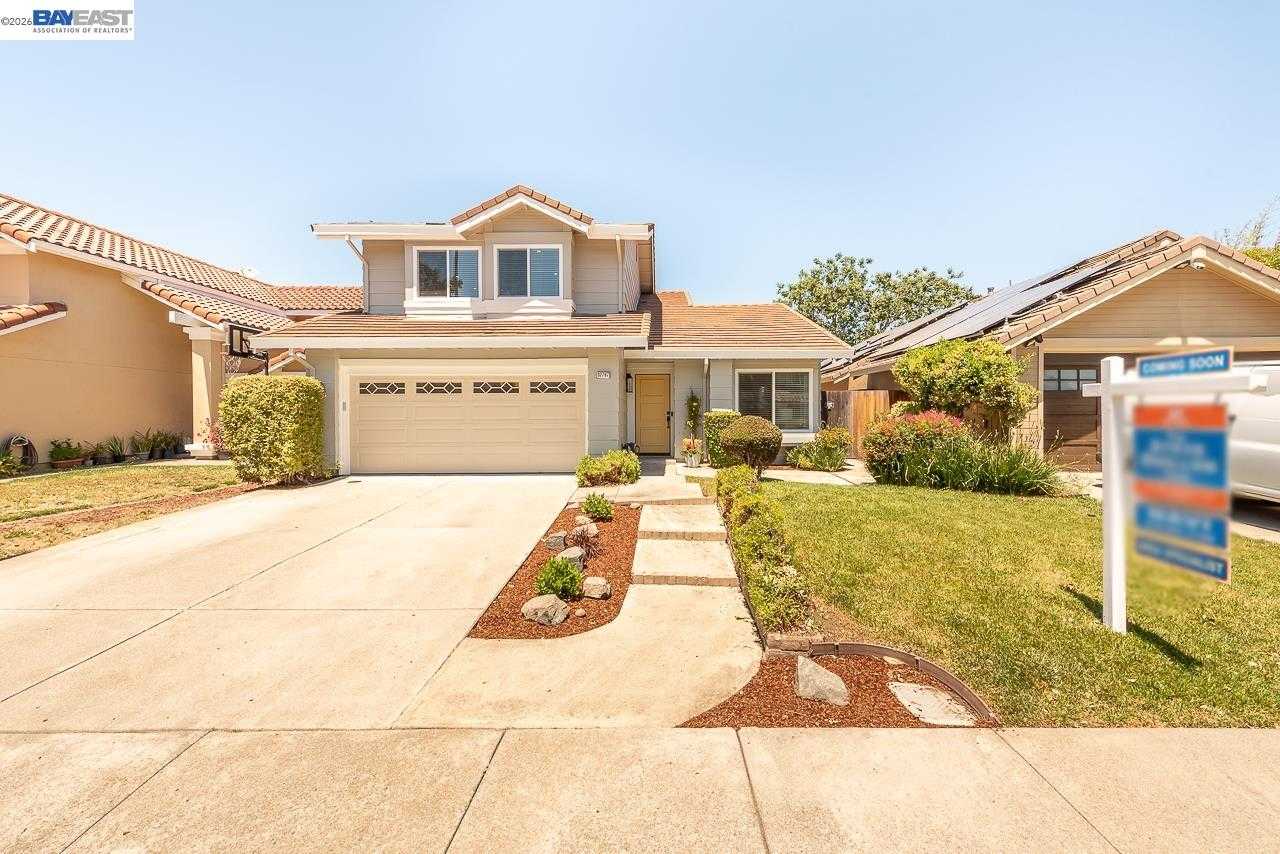
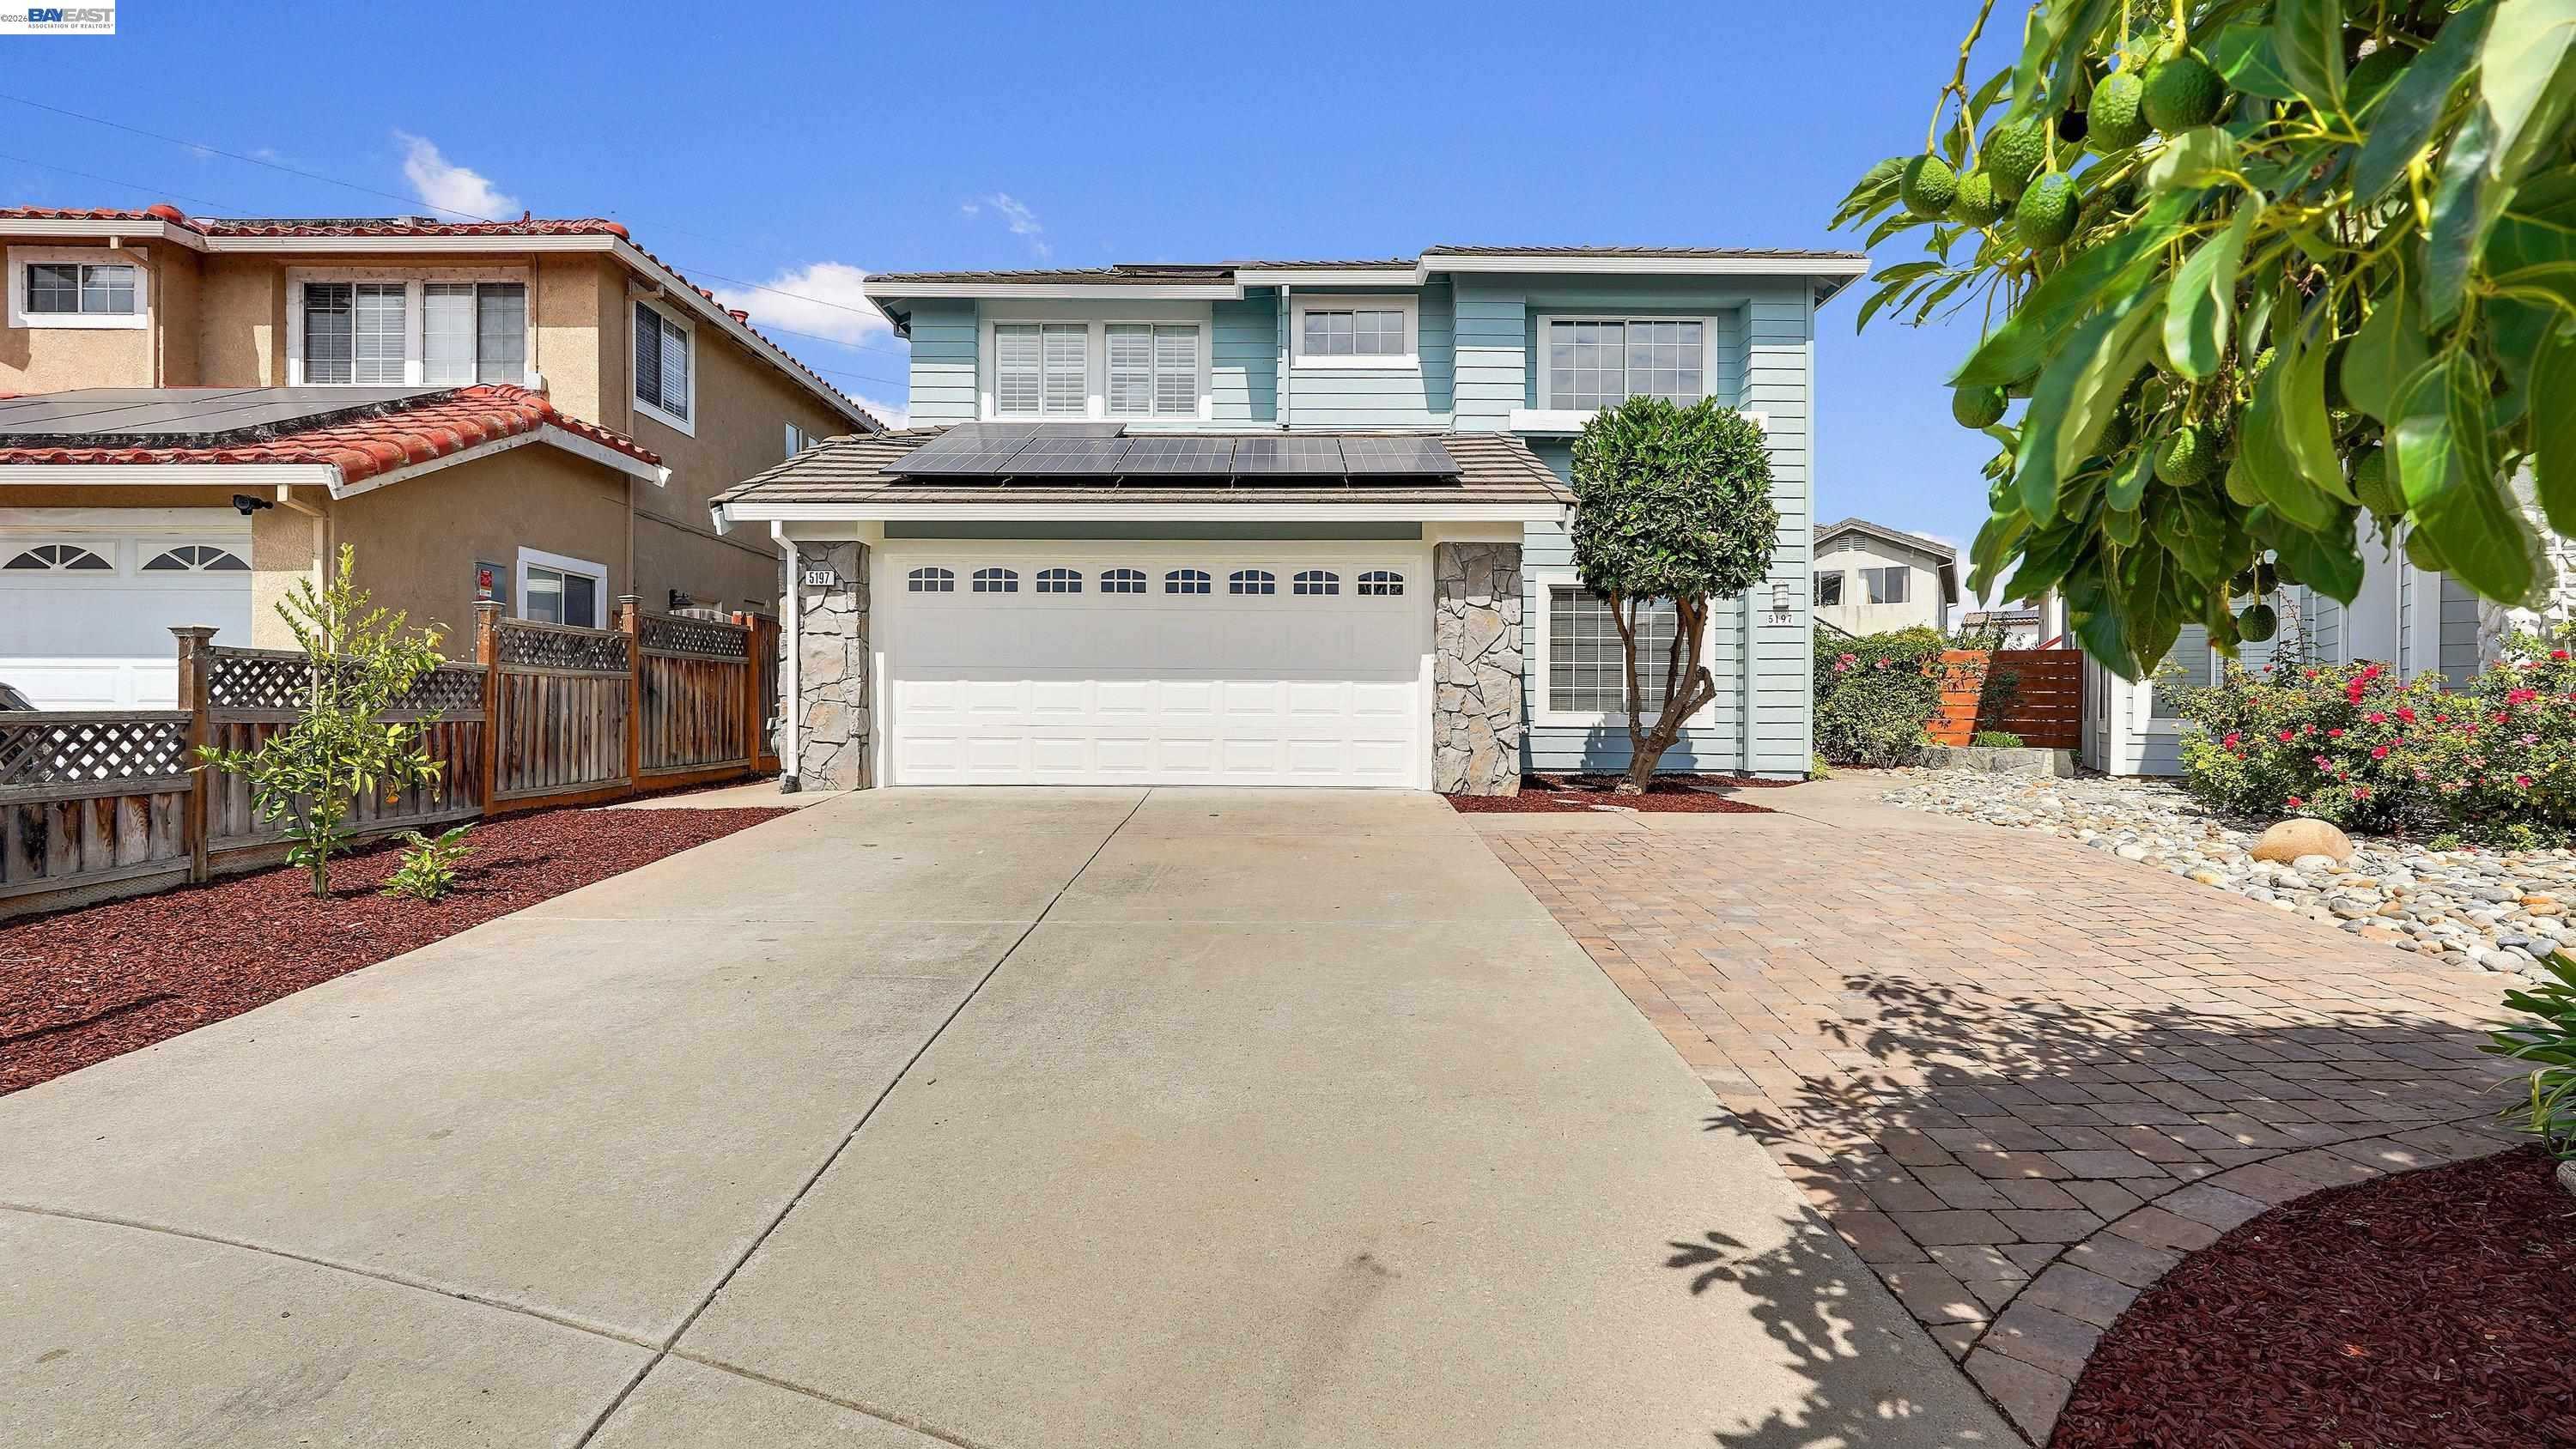
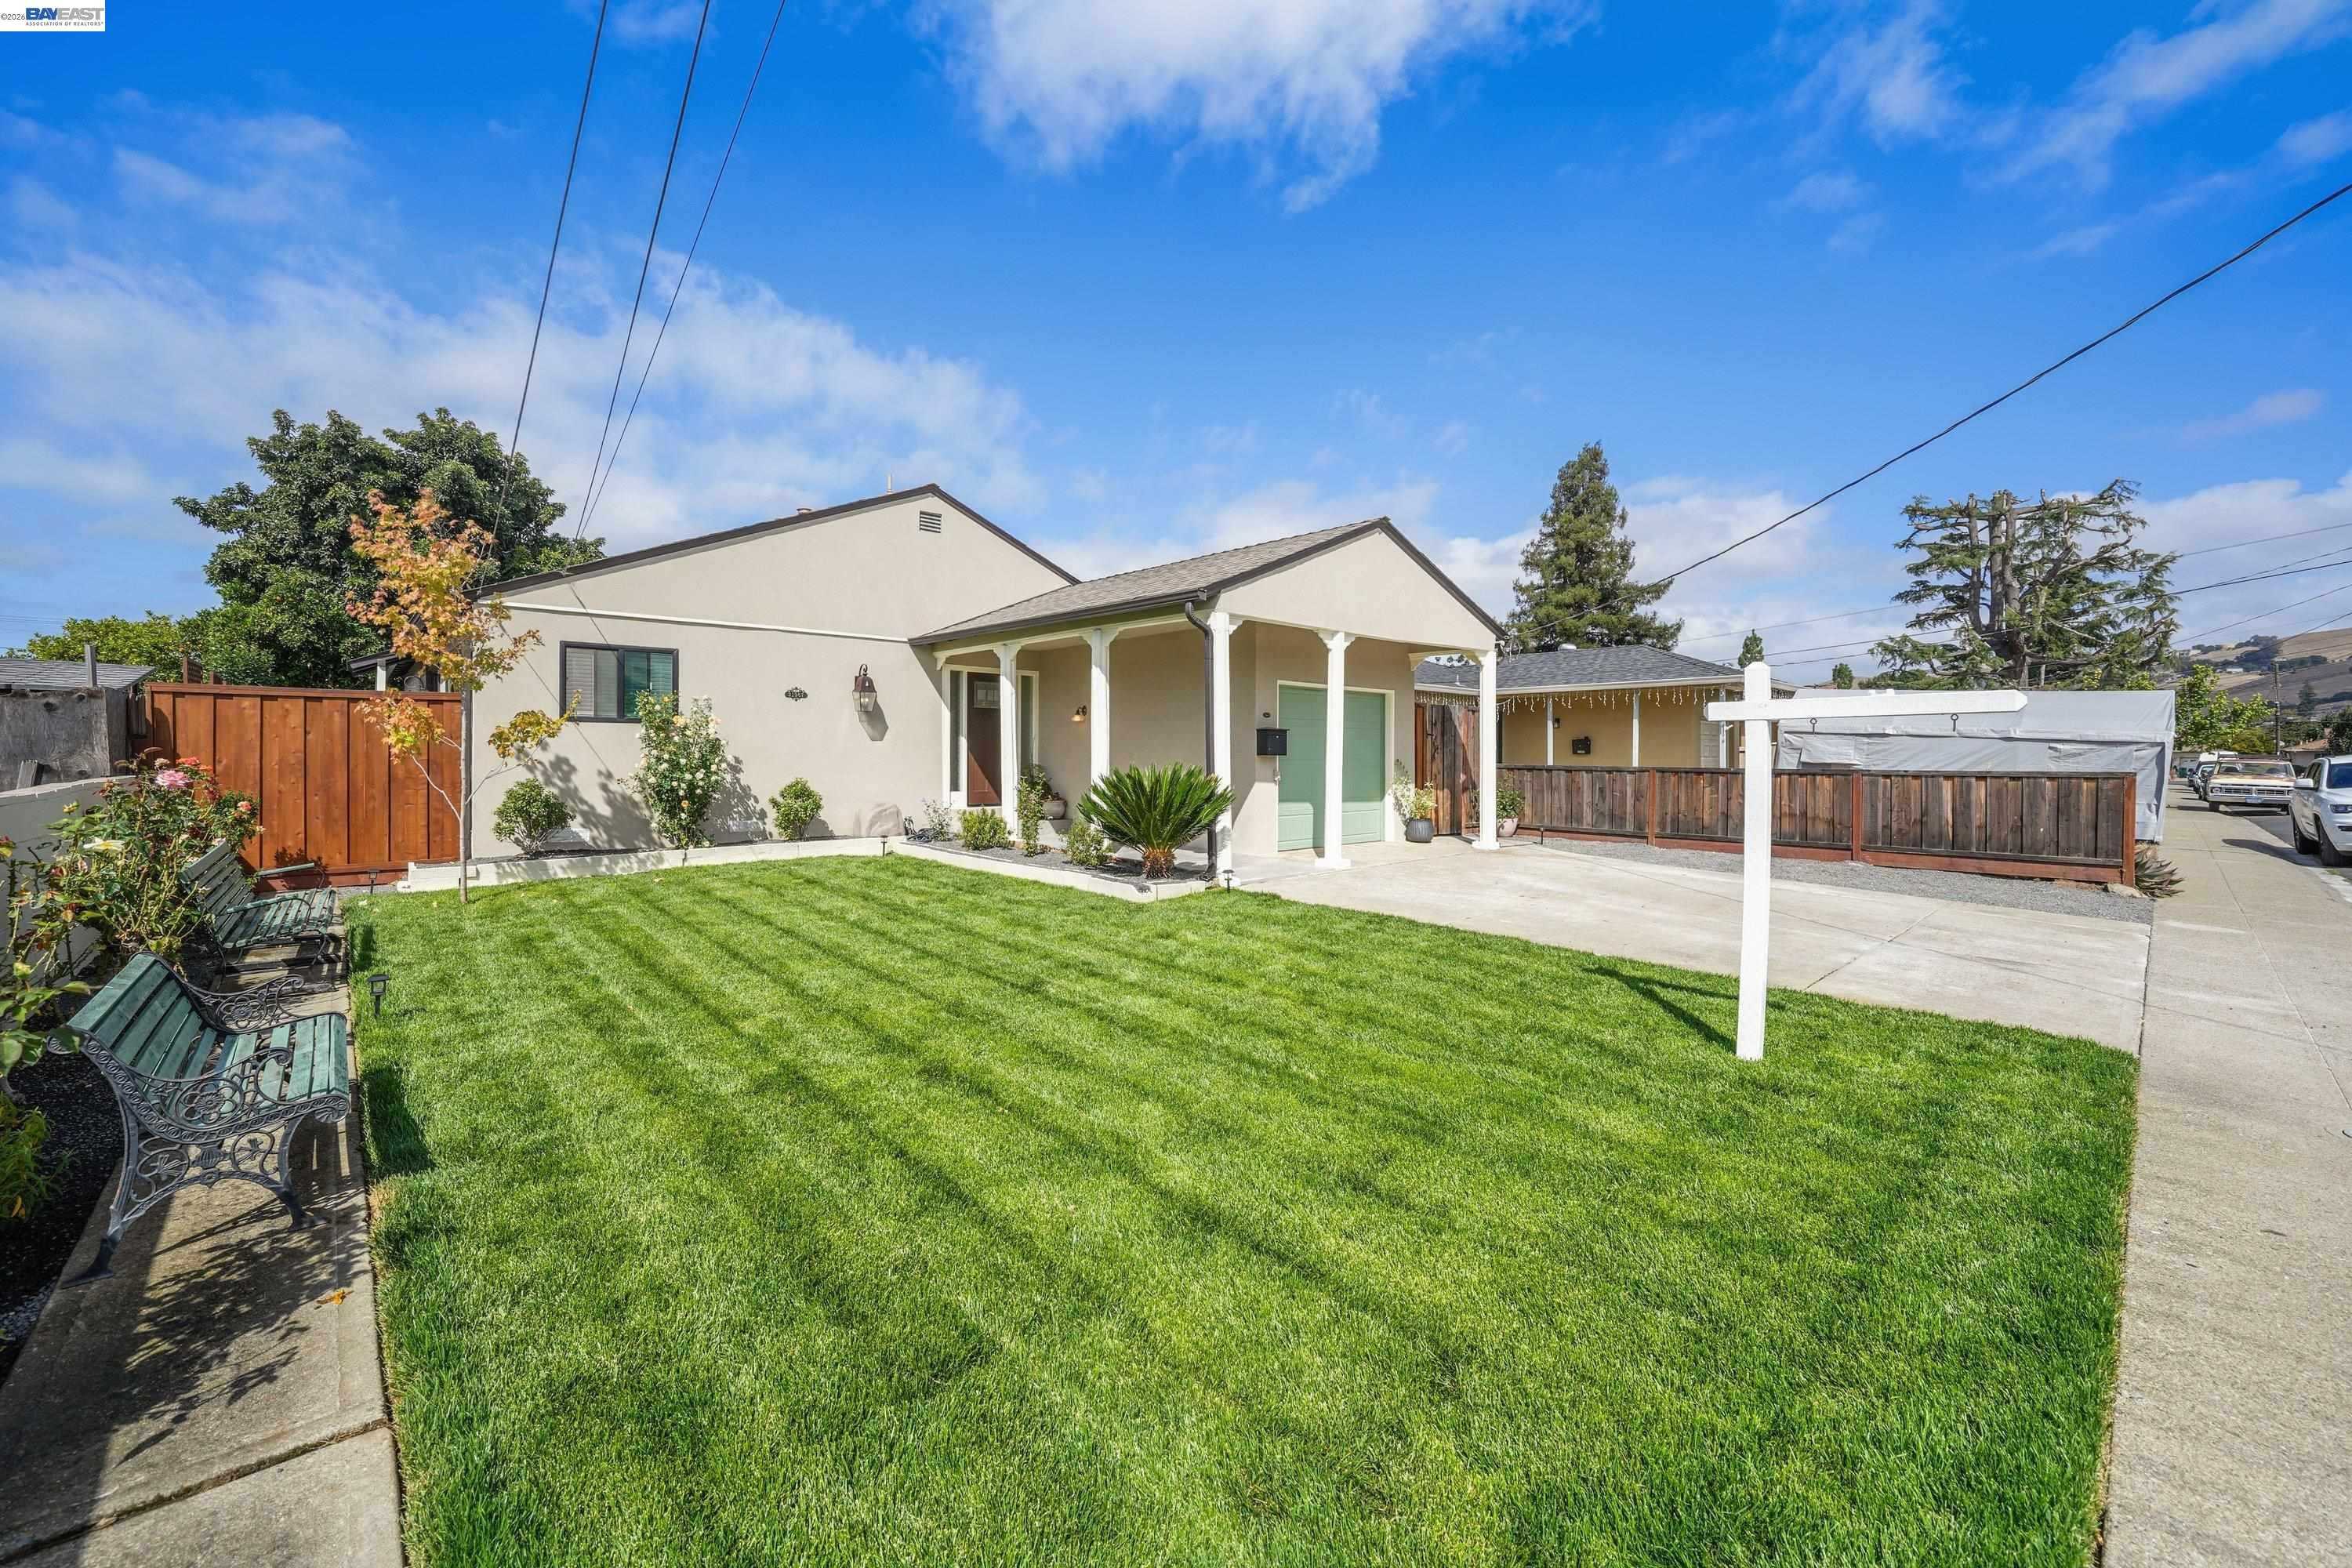
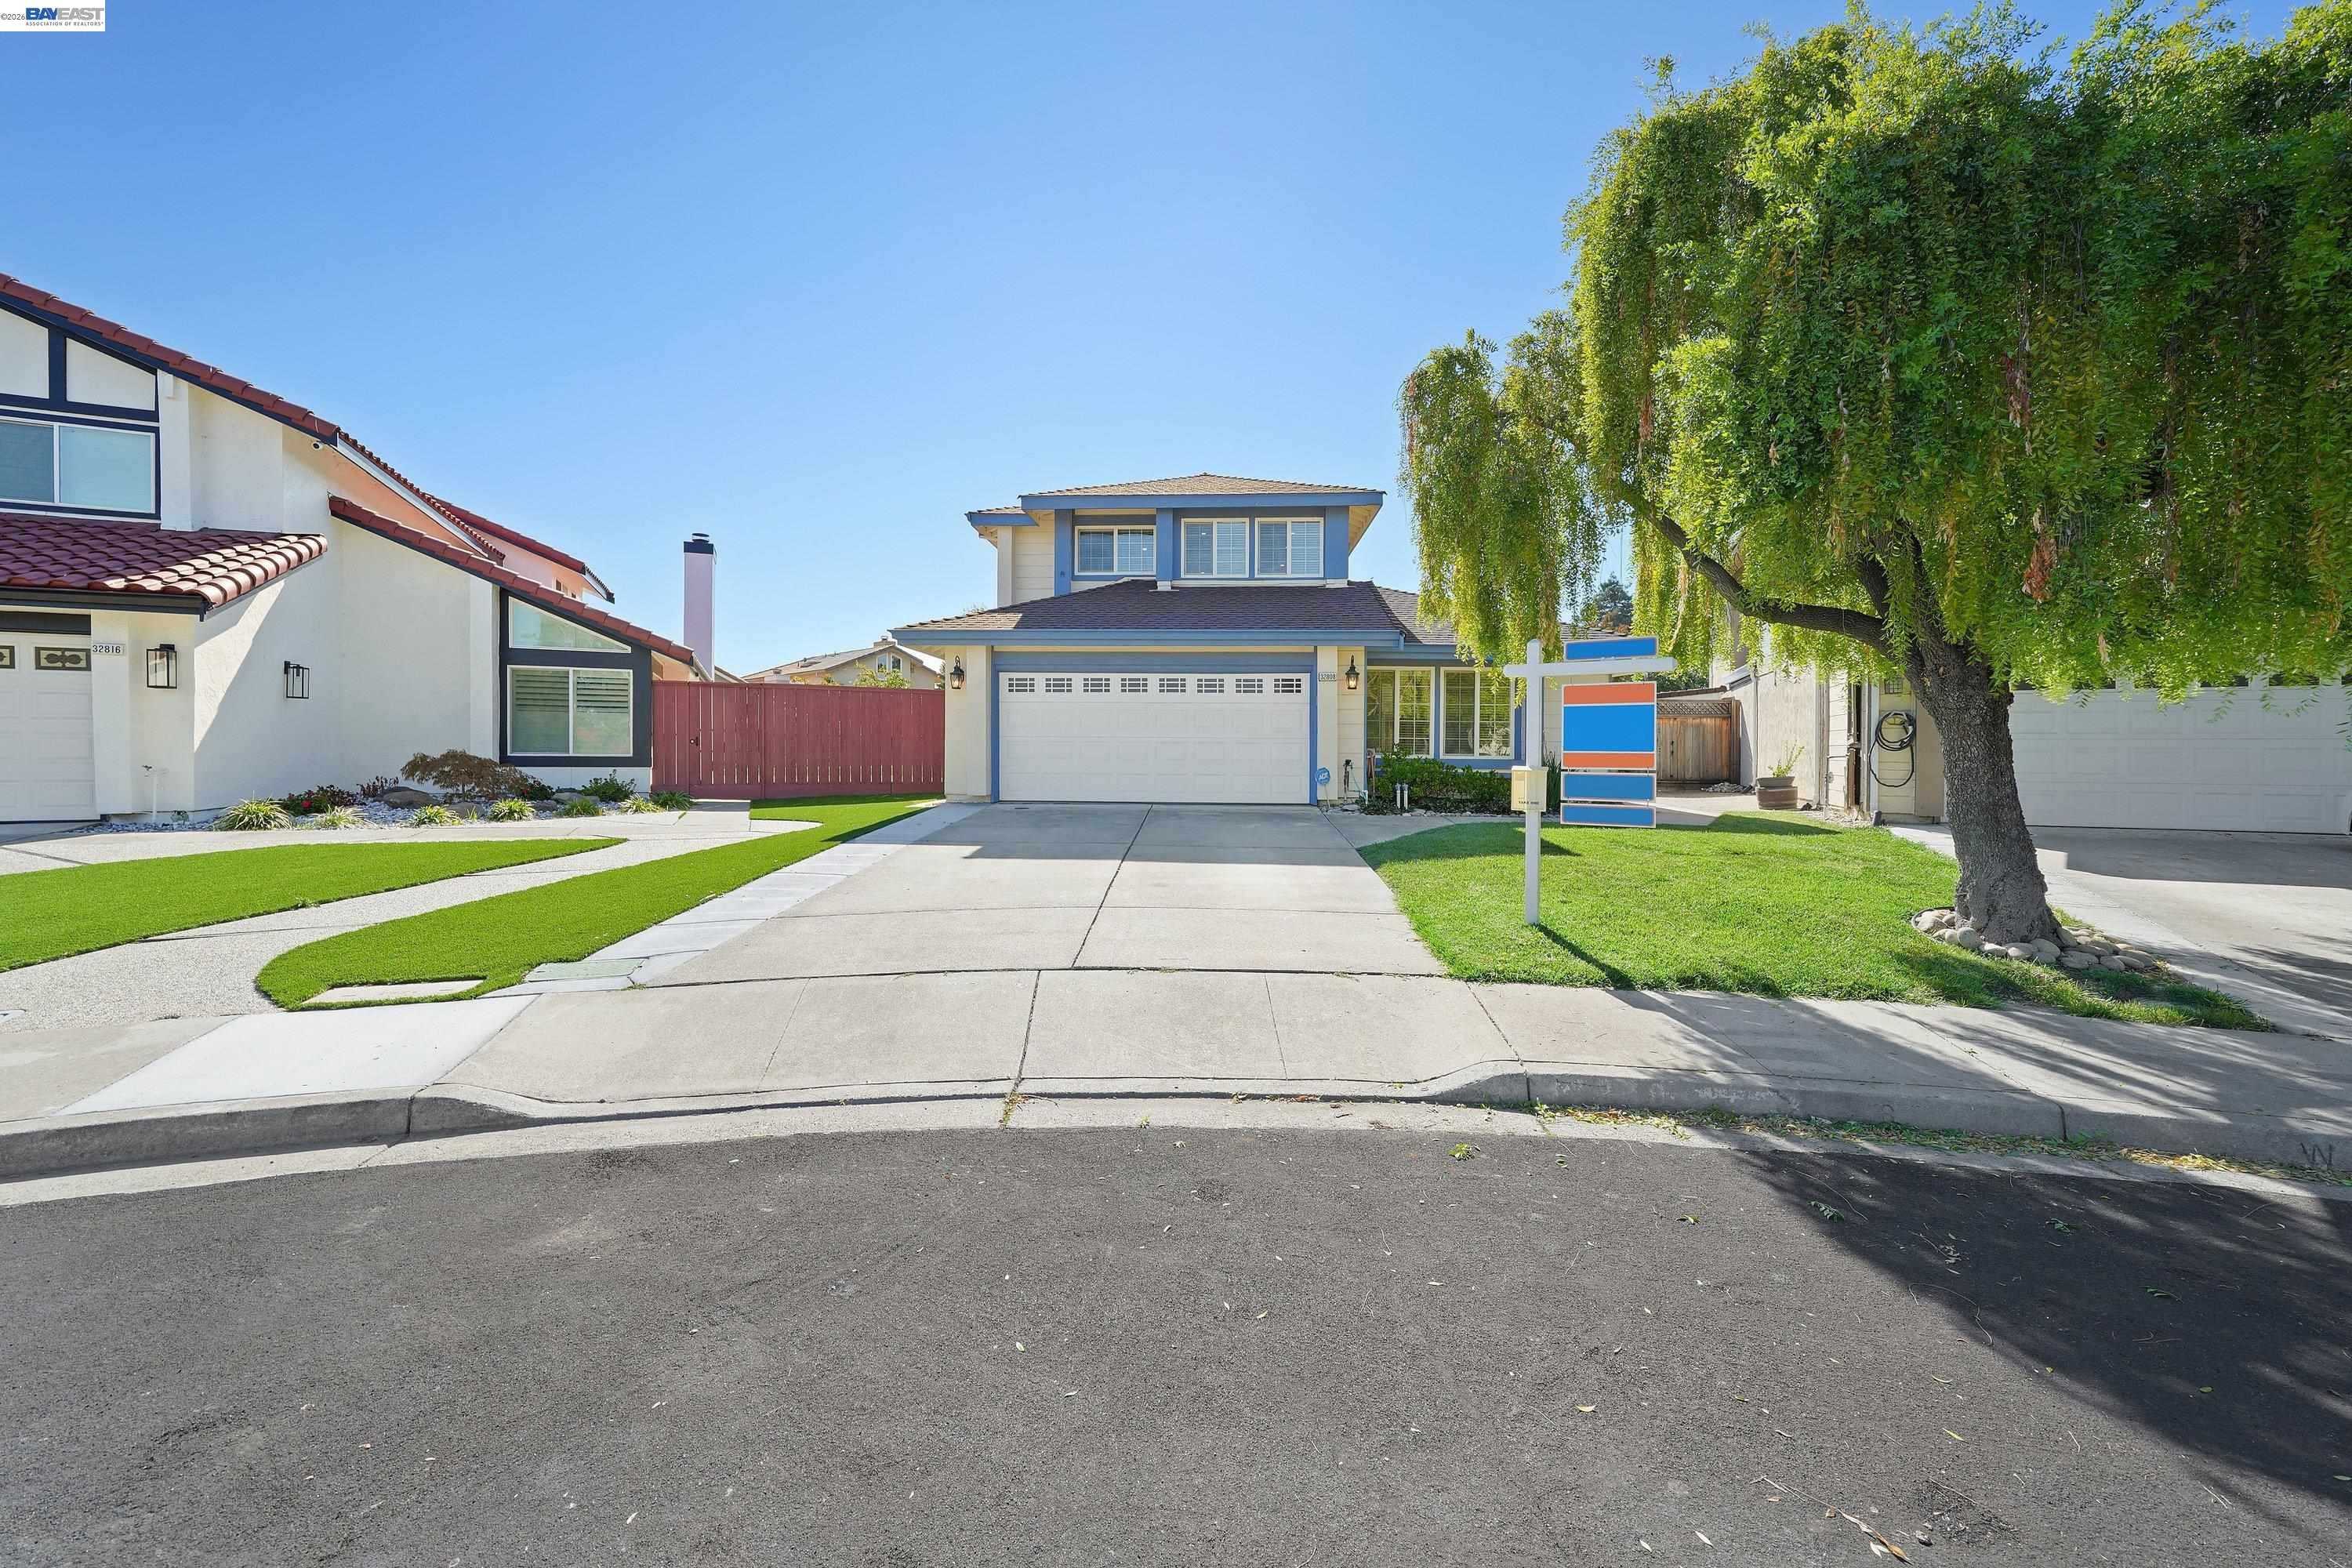
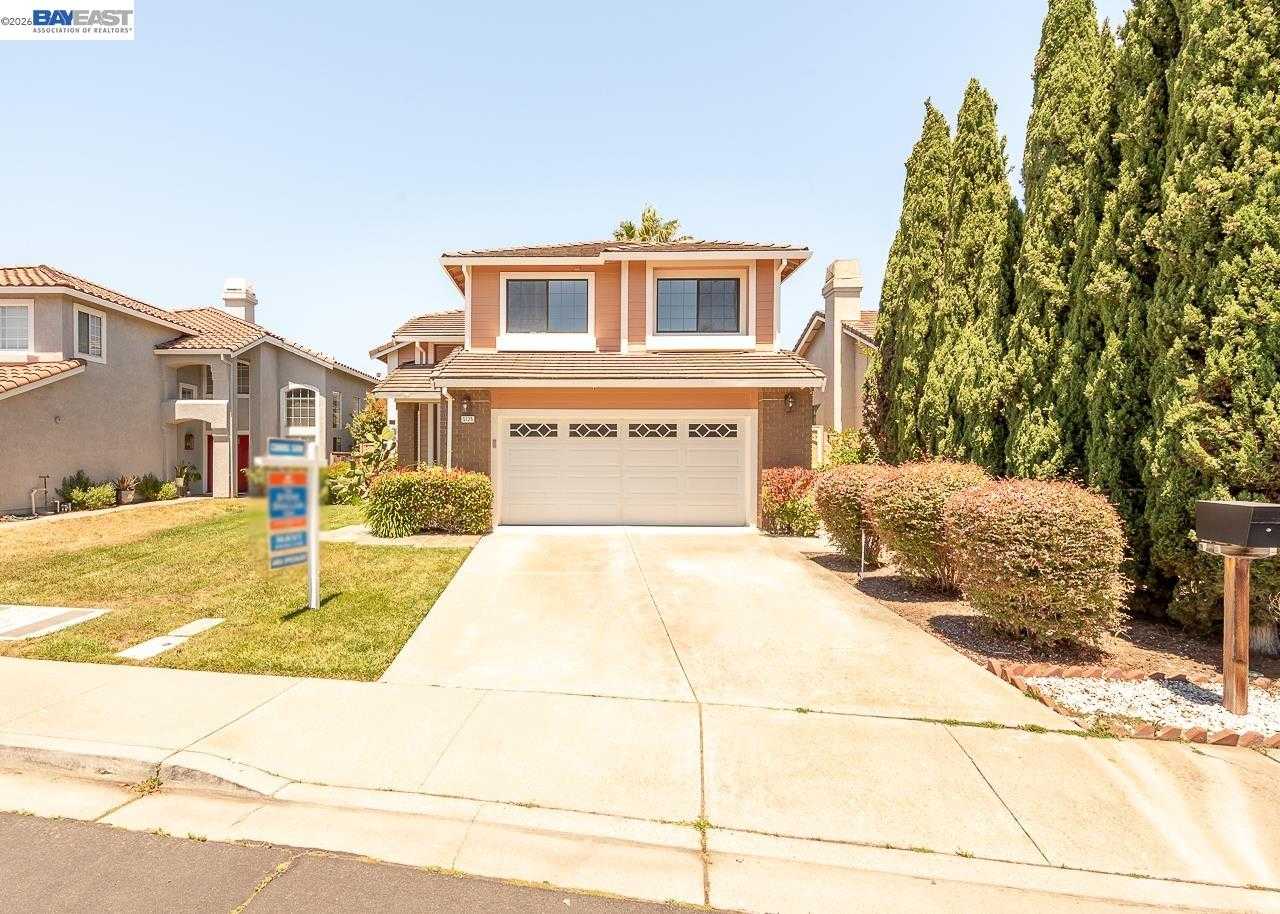
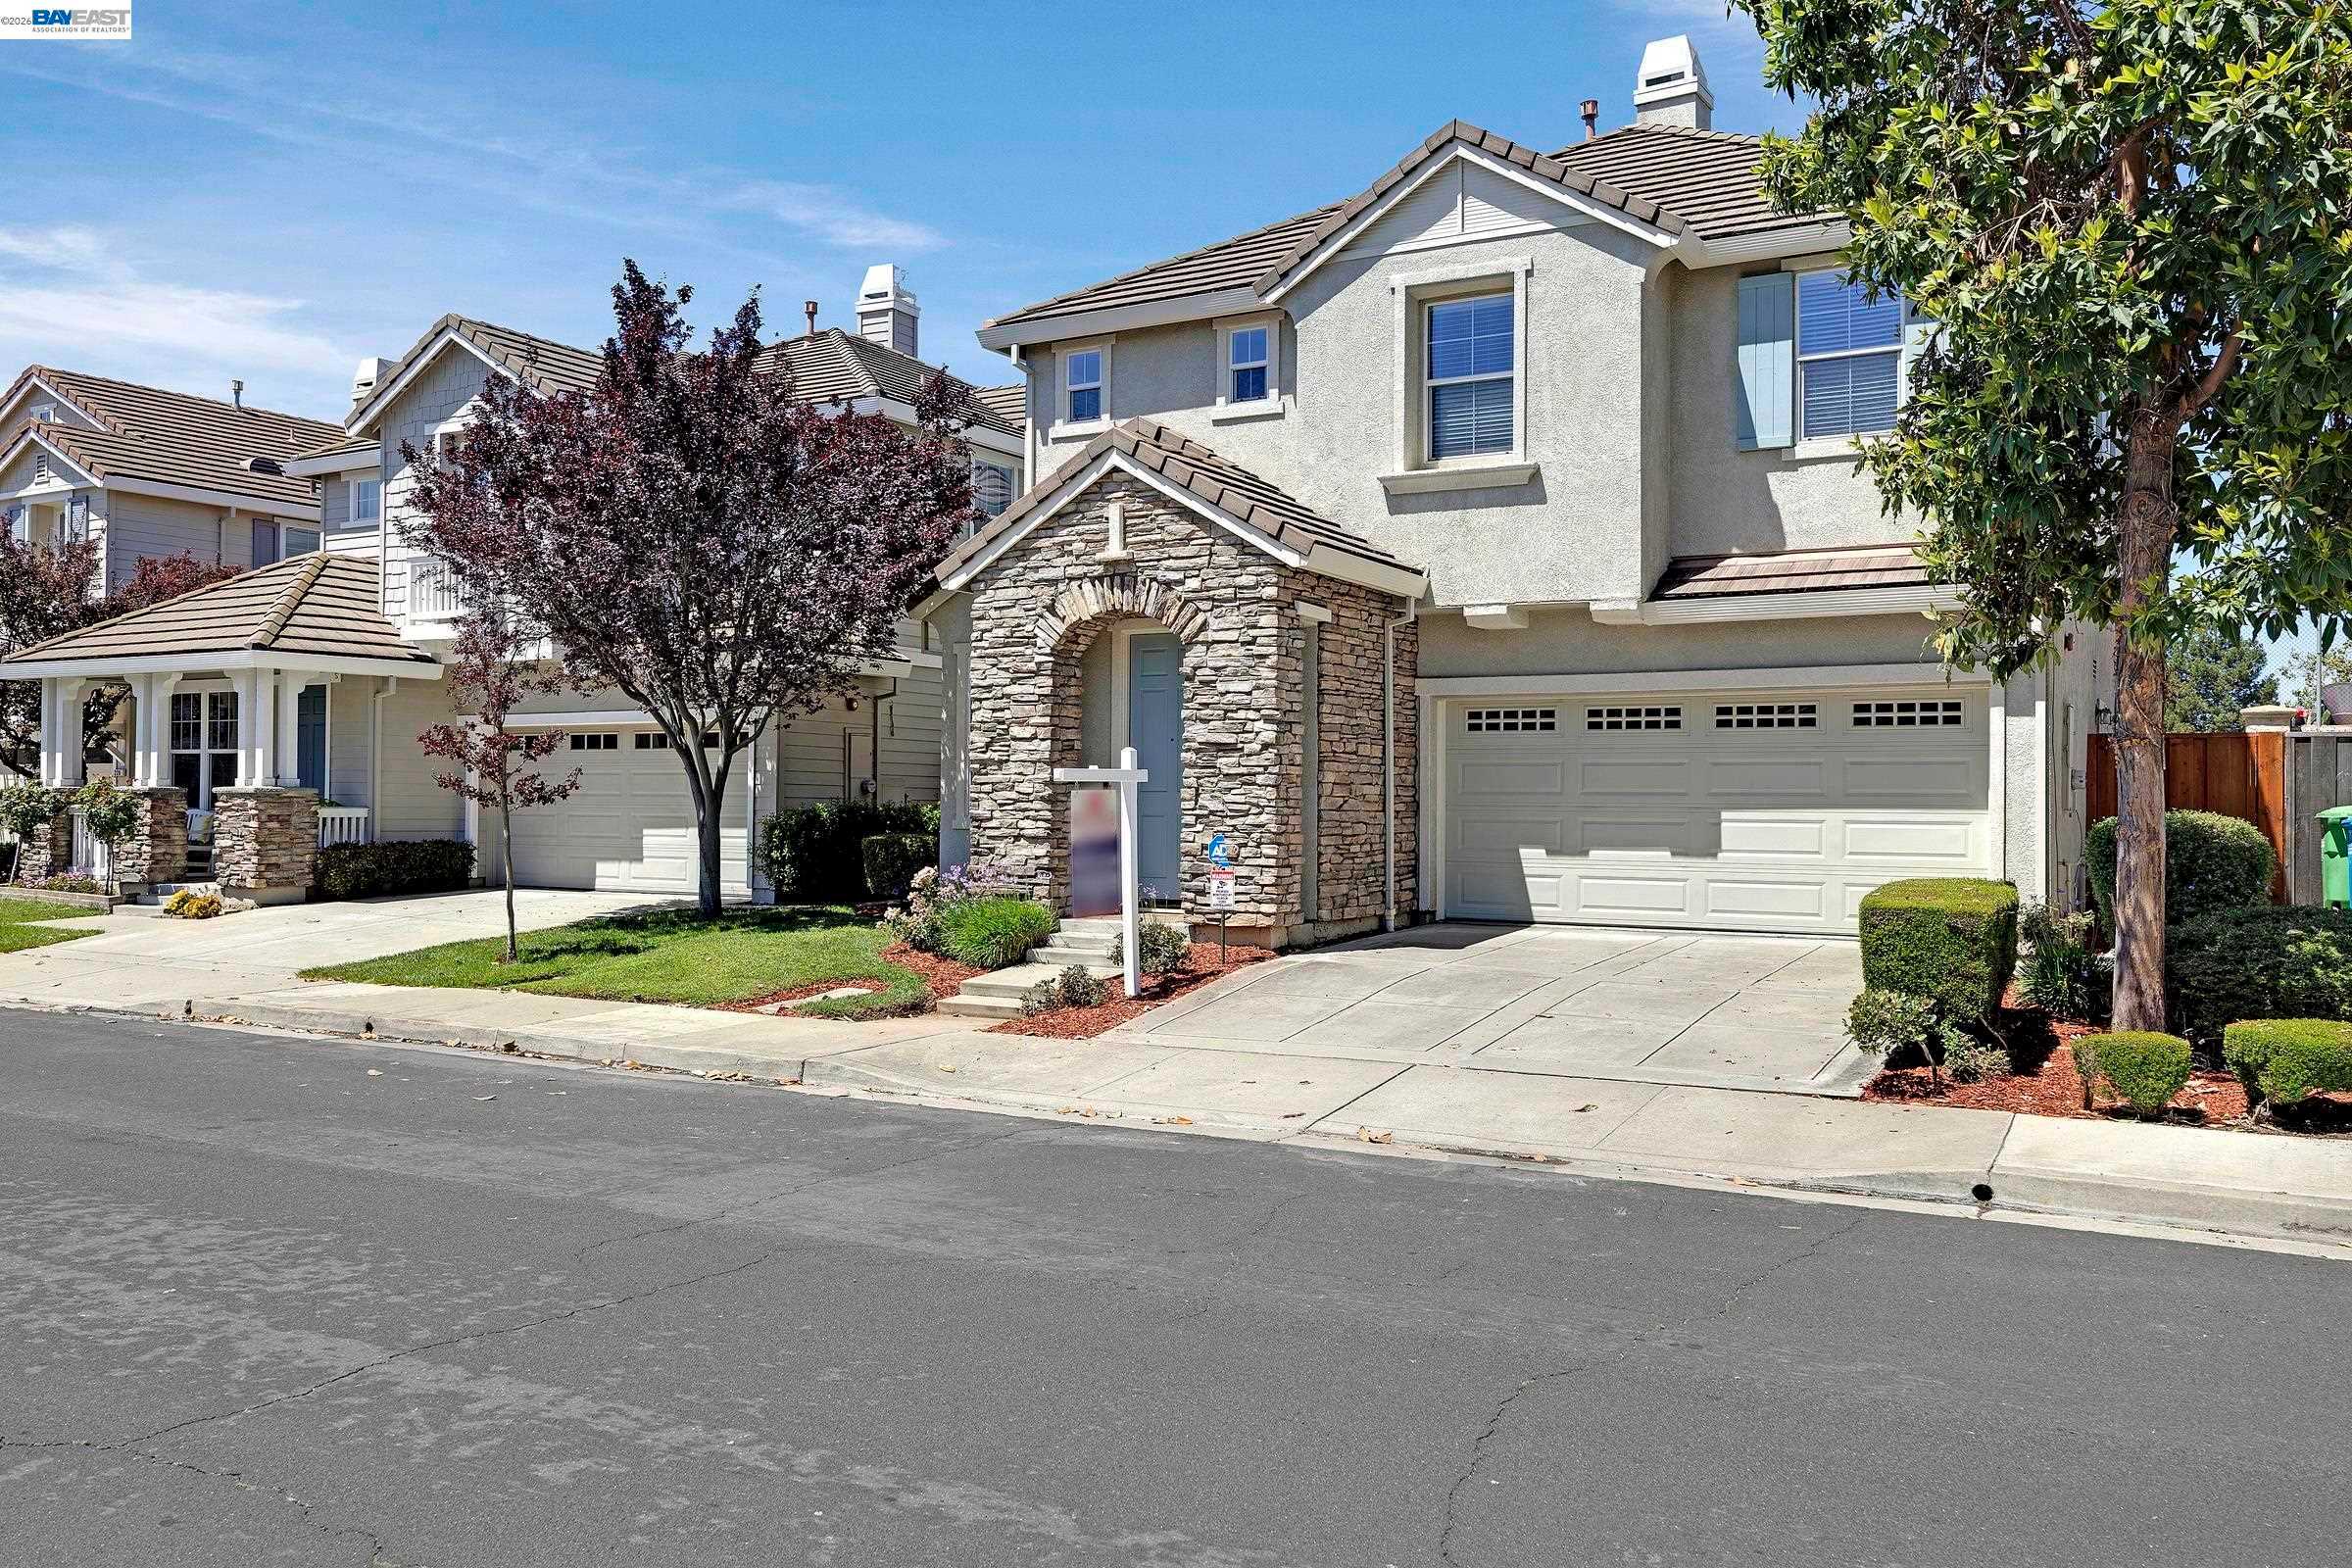
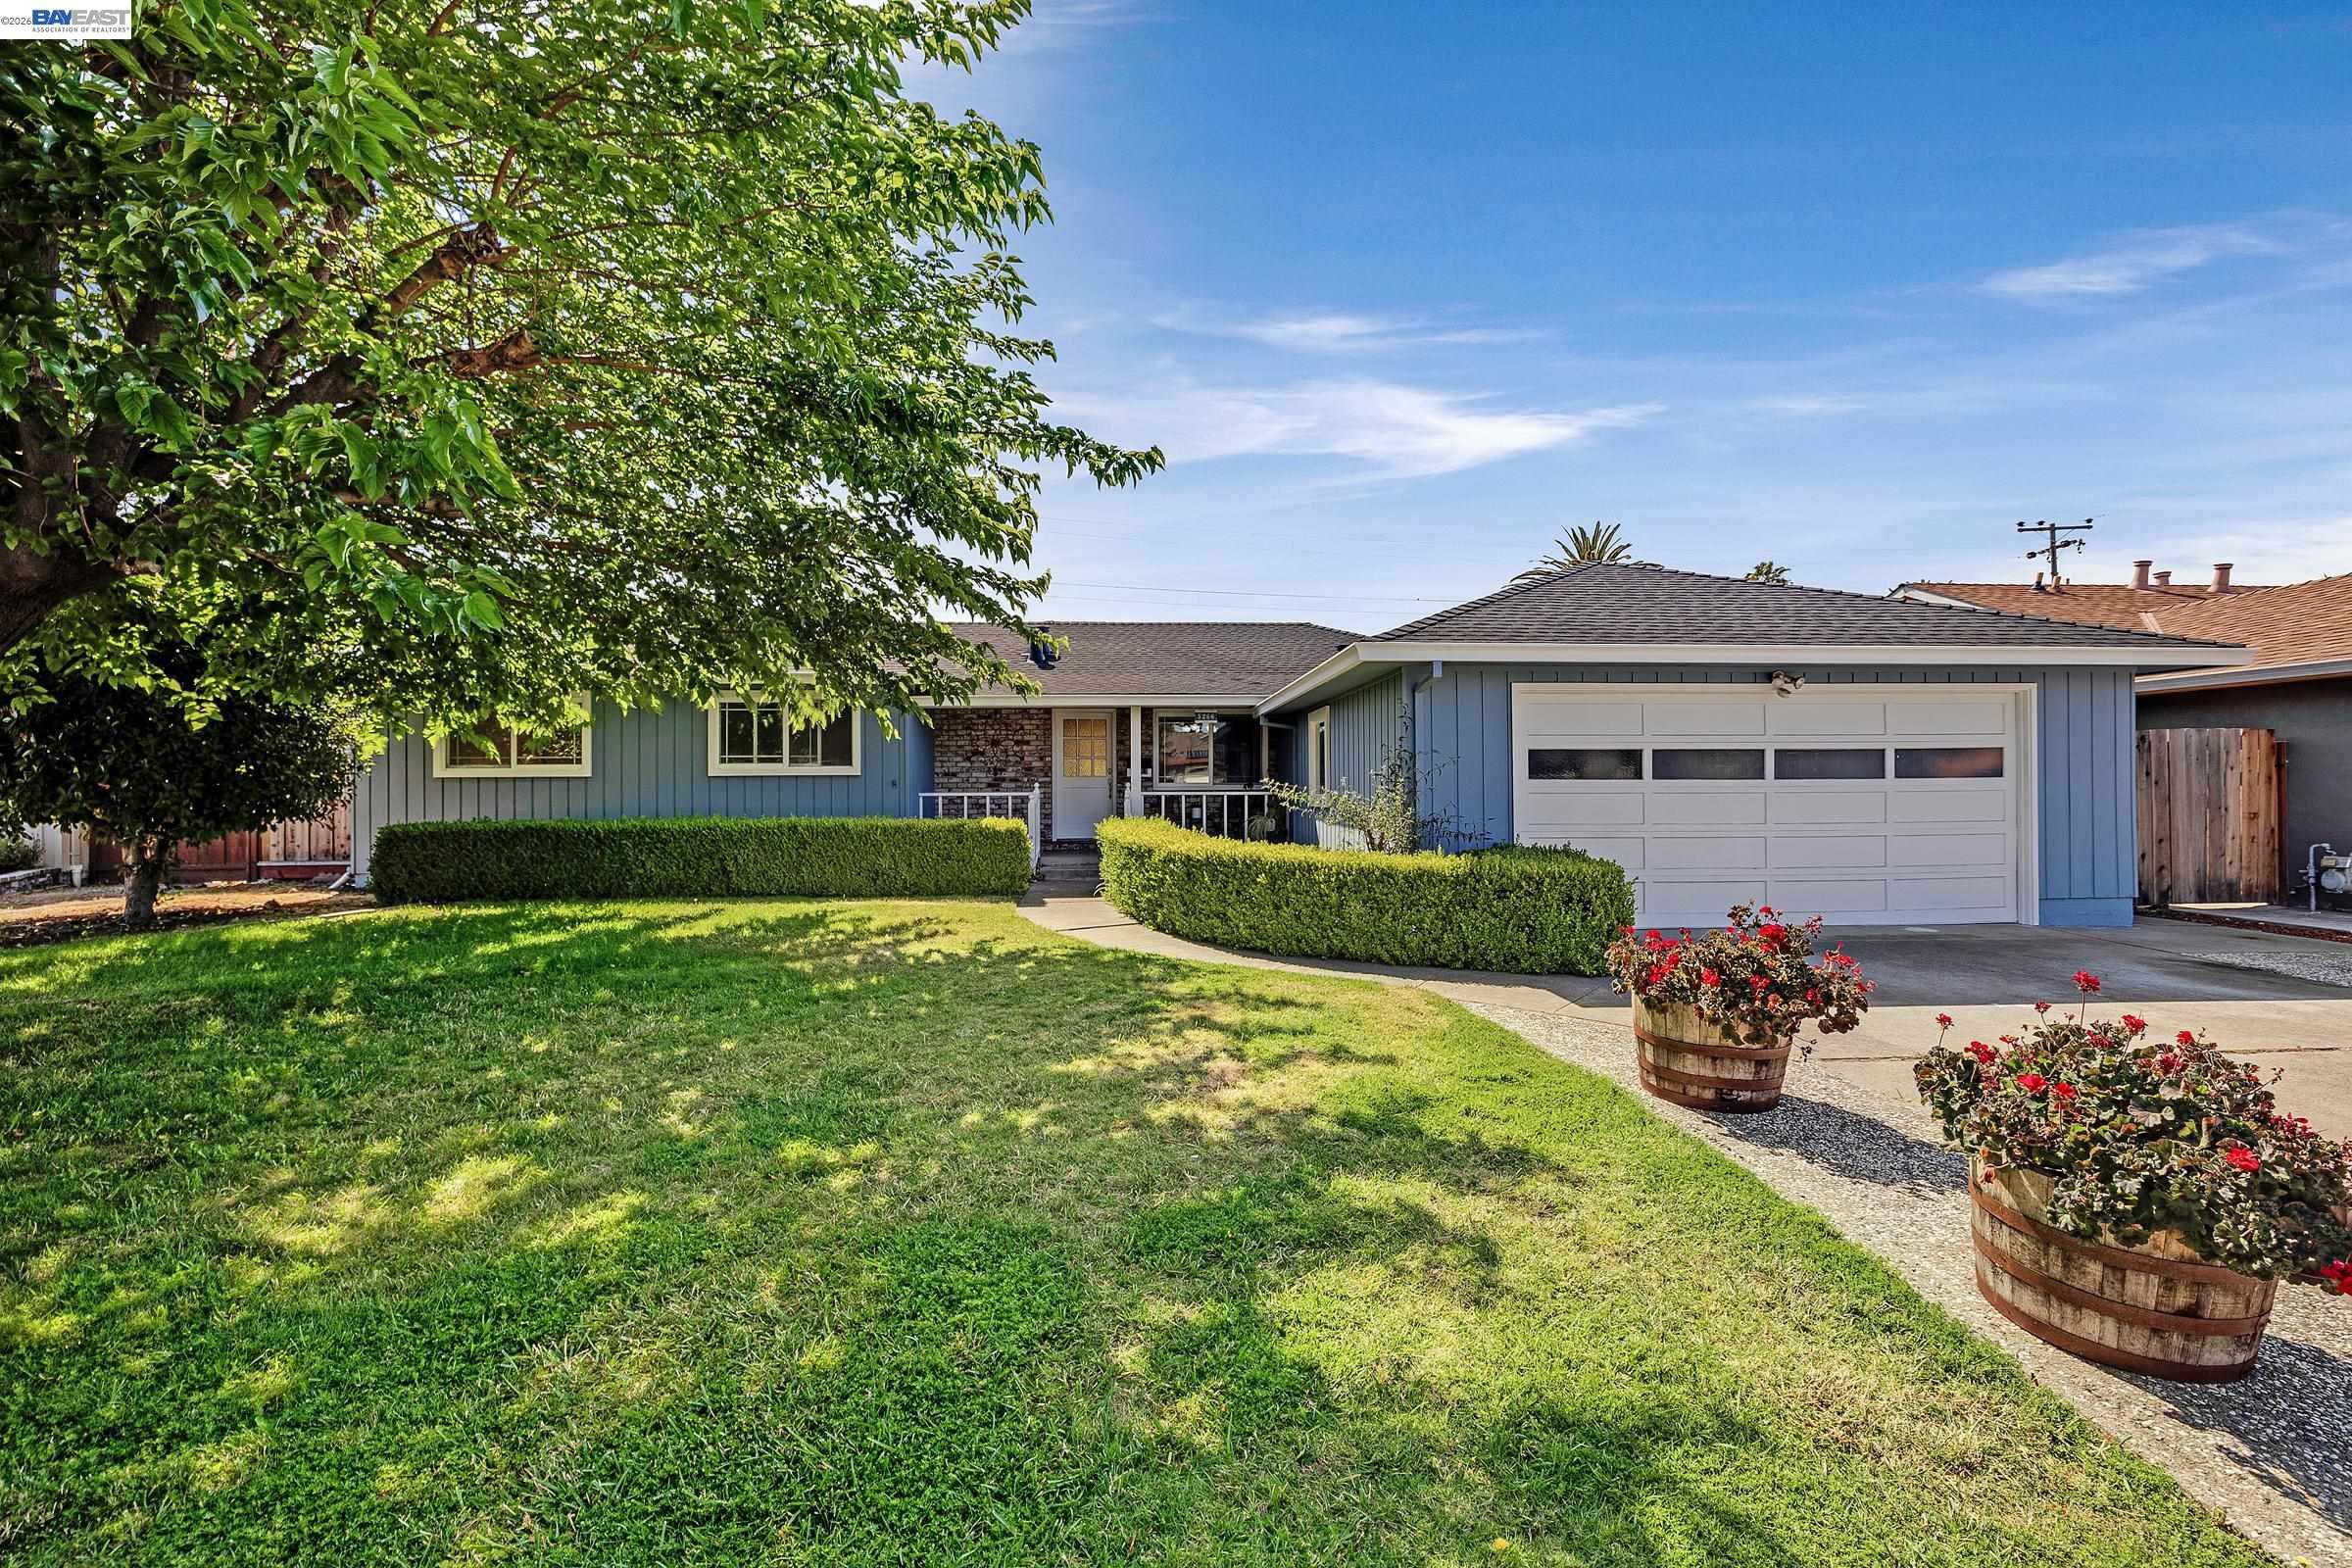
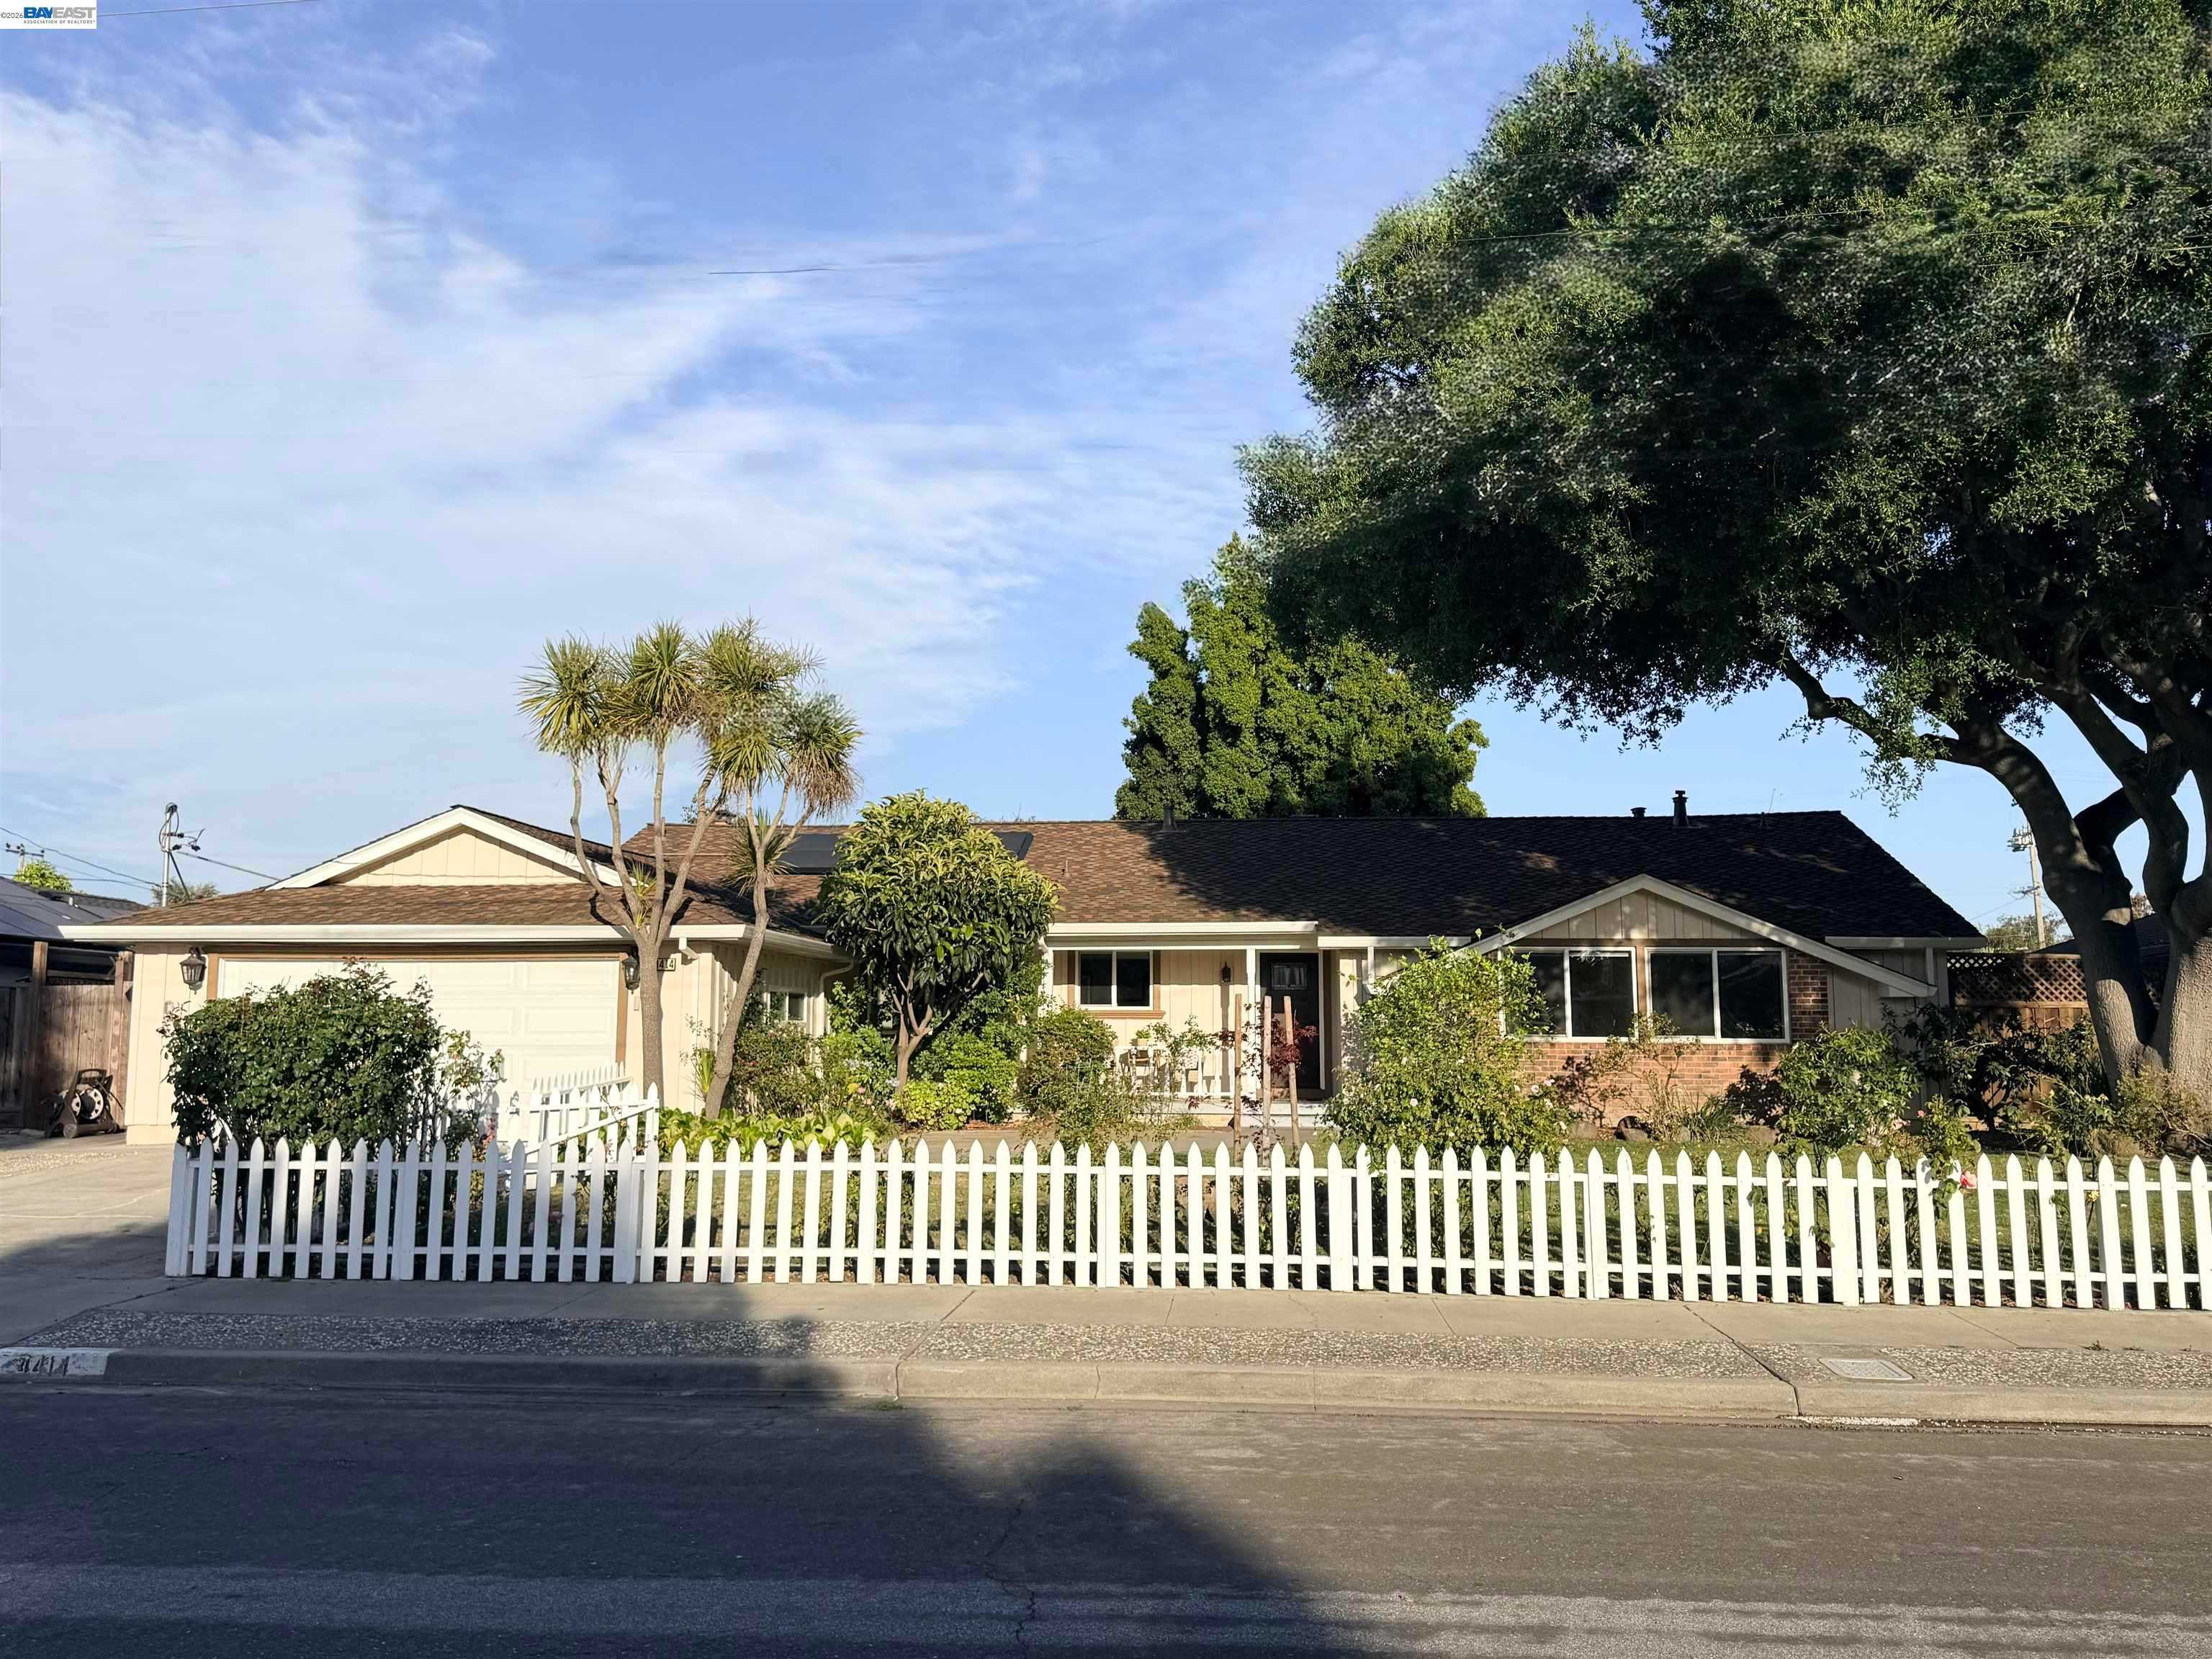
Behind these county totals: hundreds of homes still for sale in Fremont, Hayward, Union City, Newark and Milpitas, one live ledger with prices, sizes and a market read, refreshed each morning from the same MLS export.
30-Year Fixed: 6.81% ▬ unchanged | 15-Year Fixed: 6.35% ▬ unchanged
Both rates held, per Mortgage News Daily, whose board posts its Monday reading late this afternoon. Worth noting where they sit: the 15-year is exactly at the top of its 52 week range, and the 30-year is four basis points off the top of its own.
The shift this morning is in what the Fed is expected to do next. Coming out of Jackson Hole, markets are now pricing roughly a 50% chance of a rate hike in September, up from about 35% a week ago, with Chair Warsh saying inflation is not falling fast enough toward the 2% target. Treasury's ten year agrees: it jumped six basis points on Friday to 4.73%.
Read that plainly, because it changes the advice. For most of this year the client question was how long to wait for a cut. The question now is whether the next move is up. Anyone sitting on the fence for a better rate should know the market has stopped assuming the fence gets more comfortable.
One migration claim worth correcting
A figure circulating this morning says outbound home shopping "exceeded 60% nationally" in the second quarter, and that nearly all prospective Silicon Valley buyers are looking elsewhere. Those numbers do not match what Redfin publishes. Its migration series has 19.1% of house hunters looking to move to a different metro, and its most recent published quarter is the first quarter of 2026, not the second.
There is a real story underneath, just a smaller one. San Jose did post the fourth largest net outflow of prospective buyers in the country, behind New York, Seattle and Los Angeles, with Sacramento the most common destination. Redfin also notes Bay Area outbound migration has slowed considerably from its 2021 and 2022 peak, as return to office and the artificial intelligence hiring wave pulled people back. That is close to the opposite of "nearly all buyers are leaving."
Locally the board is carrying 2,744 listings across the 15 city board, counting everything active alongside everything in contract, with 192 coming soon and 226 brand new today, the heaviest single day count we have printed. Our own 5 city ledger shows 711 homes a buyer can pursue right now, including 66 brand new listings and 93 more coming soon. The full, always-updating ledger lives at harvrealtor.net/live-inventory.
Today’s Live Inventory (buyable now)
- Fremont: 277 available (212 active, 27 new, 38 coming soon)
- Hayward: 192 available (154 active, 22 new, 14 coming soon)
- Milpitas: 112 available (81 active, 3 new, 28 coming soon)
- Newark: 75 available (57 active, 10 new, 8 coming soon)
- Union City: 55 available (46 active, 4 new, 5 coming soon)
The pending count went back over 100. Fremont ran 102, 102, 102, 101, then 99 on Friday, and it is 101 this morning while active supply eased from 250 to 247. Friday's reading was that absorption had slowed. The weekend argued the other way, and buyers did work.
Median asking in Fremont is $1,249,800, down almost $40,000 from Friday's $1,289,500. Do not read that as prices falling. With 27 new listings arriving at once the mix moved, and the median follows whatever showed up this morning. Median days on market is 31, and Newark is the quickest of our five at 25 days.
For a seller listing this week, 226 new listings hit the board today and your buyer has to sort through all of them. The ones that get seen are priced to appear in the right search bracket, not priced on hope and revised in two weeks.
US 10-Year: 4.73% ▲ 0.06% | Gold: $4,438 ▼ 3.69% | Silver: $67.35 ▼ 4.63% | Brent: $89.31 ▼ 0.43%
Friday's warning came true, so be precise about what those metals figures mean. On Friday we published gold at $4,608 and silver at $70.62 from the 6:30 AM print, and flagged that both had reversed hard once the US session opened. They had. Gold now prints $4,438 and silver $67.35. Almost all of that decline happened Friday afternoon, not today: as this is written gold futures sit at $4,482 against Friday's $4,478 settlement and silver at $67.09 against $67.00, so both metals are flat this morning.
The ten year is the number that actually moved, up six basis points on Friday to 4.73% on Treasury's own daily curve. A six basis point jump is not a rounding matter, and it is what pulled mortgage rates to the top of their range.
Brent settled at $89.31, down 0.43%.
The grain numbers going around are wrong in an instructive way
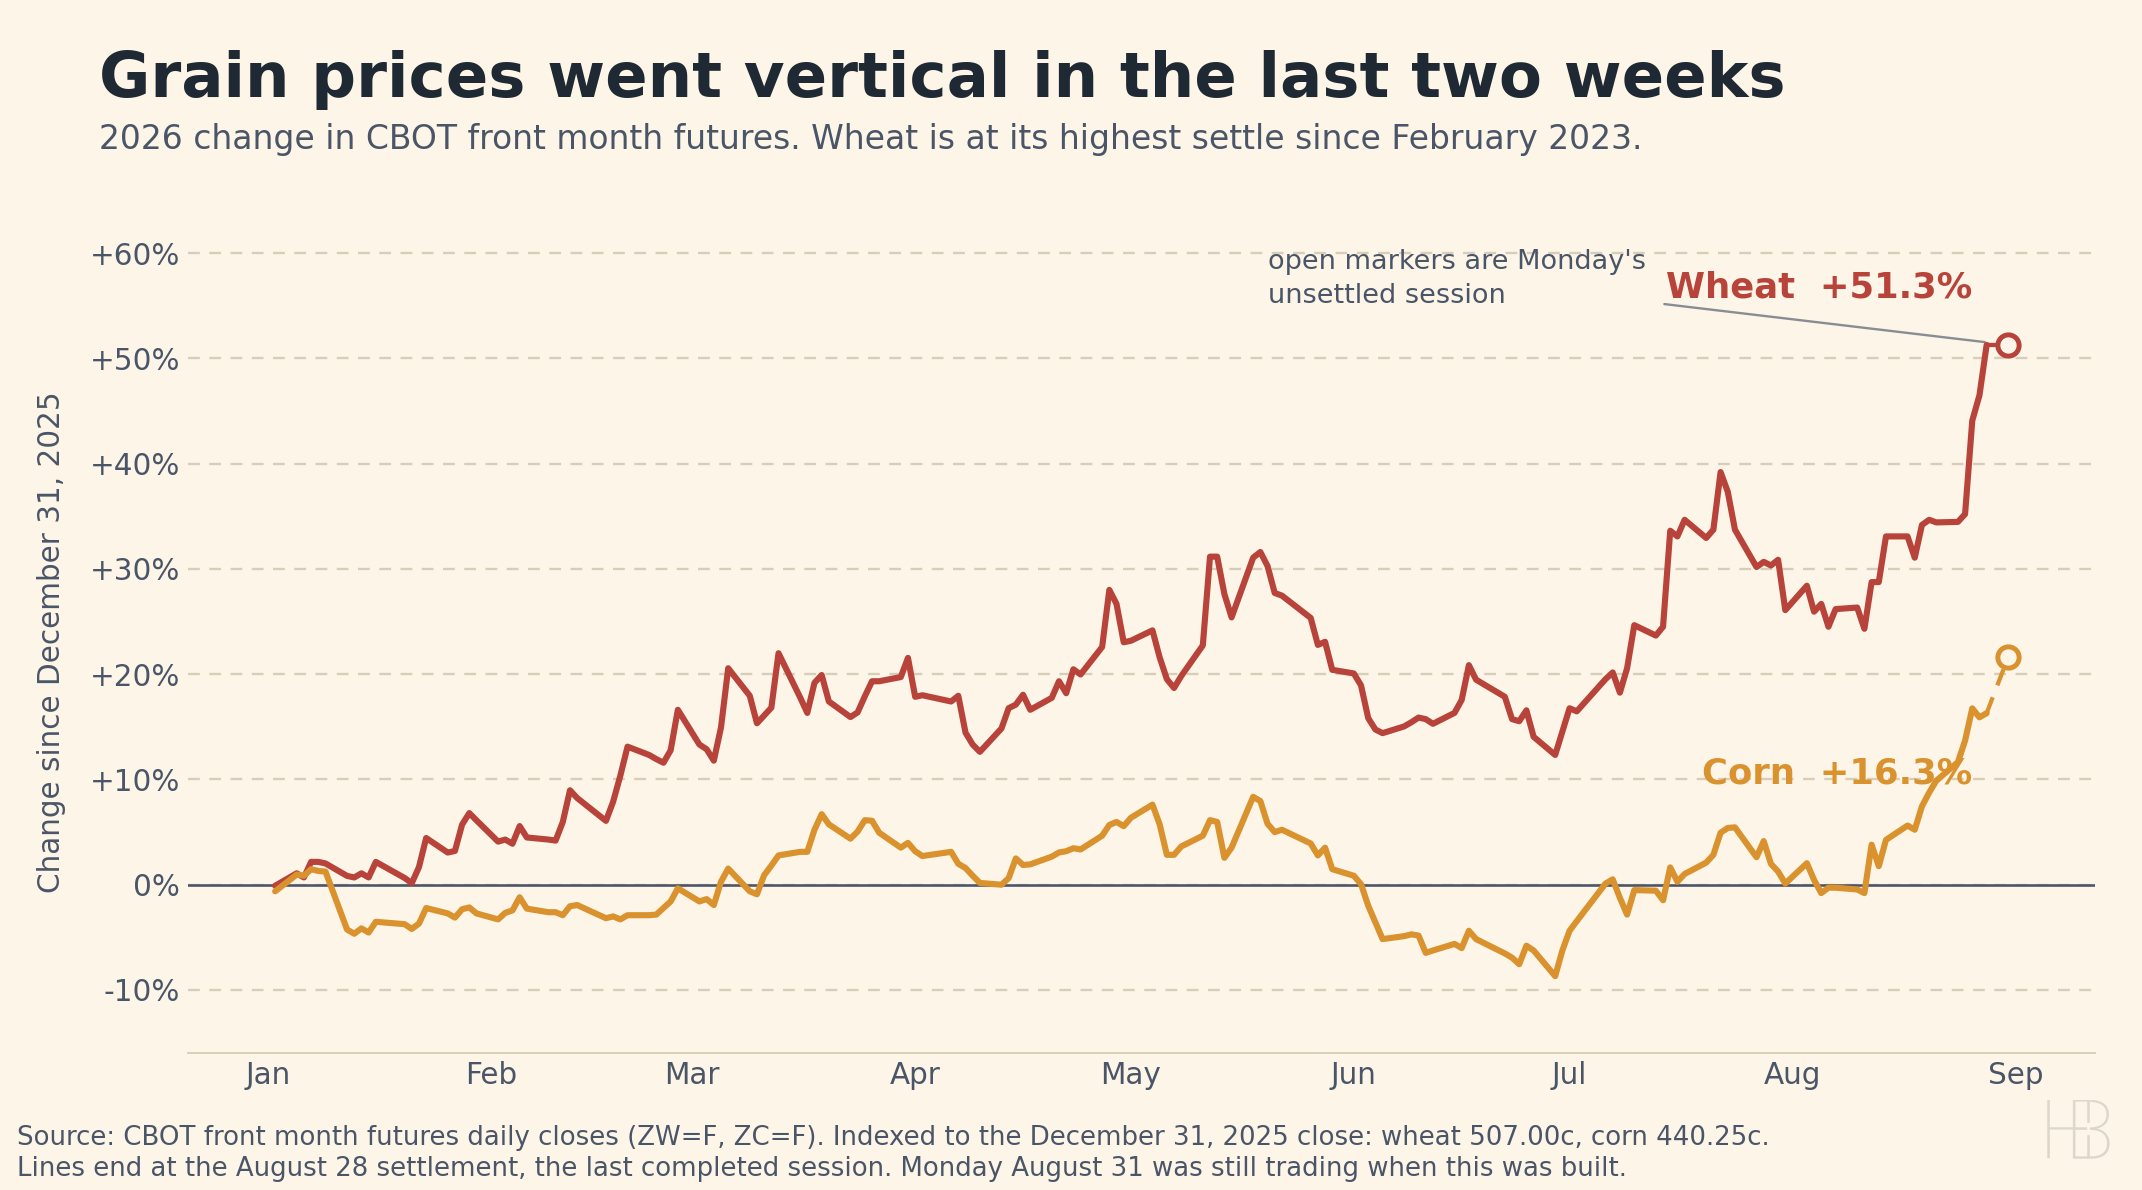
Wheat did not settle at $7.84 a bushel on Friday. It settled at $7.67, up 51.3% on the year. The $7.84 figure being quoted is this morning's intraday high, printed while the pit was still open and then labeled as a Friday settlement. Corn is the bigger stretch: it settled Friday at $5.12, up 16.3%, and it was not at a multi year high at all, having closed higher two sessions earlier. Corn only clears its July 2023 mark on this morning's live tick, which has not settled and may not hold.
What is true is quite enough. Wheat is at its highest settlement since February 2023, and essentially the entire move is a fortnight old. Bread and cereal prices follow with a lag, and that is the sort of thing that keeps a core inflation reading sticky just as the Fed has started talking about hikes rather than cuts.
S&P 500: 7,711 ▼ 0.25% | DOW: 53,559 ▼ 0.02% | NASDAQ: 26,402 ▼ 0.52%
A soft finish to the week. The NASDAQ gave back half a percent and the DOW was essentially flat, taking some shine off Thursday's software rally.
The detail worth carrying into the week is a consumer one. Affirm reported $1.17 billion in quarterly revenue, ahead of estimates, and its chief executive credited households stretching purchases into installments as gas sits near $4.09 a gallon. Buy now pay later growing because people are budgeting tighter is not a healthy signal about the consumer, whatever it does for the stock.
BTC: $78,600 ▼ 0.21% | ETH: $2,469 ▼ 0.25% | XRP: $1.38 ▼ 1.70%
A quiet morning. Bitcoin has clawed back above $78,000 after Friday's selling and the majors are within a quarter of a percent of flat.
The story is the companies that hold Bitcoin rather than the coin. A headline going around says Bitcoin treasury stocks lost $83 billion over the past year, illustrated by the 50 largest listed holders falling from $150 billion to $67 billion. The part usually left out: Strategy alone accounts for $79 billion of that $83 billion. This is not fifty companies sagging together. It is one company losing almost all of it while the other forty nine lose about $4 billion between them.
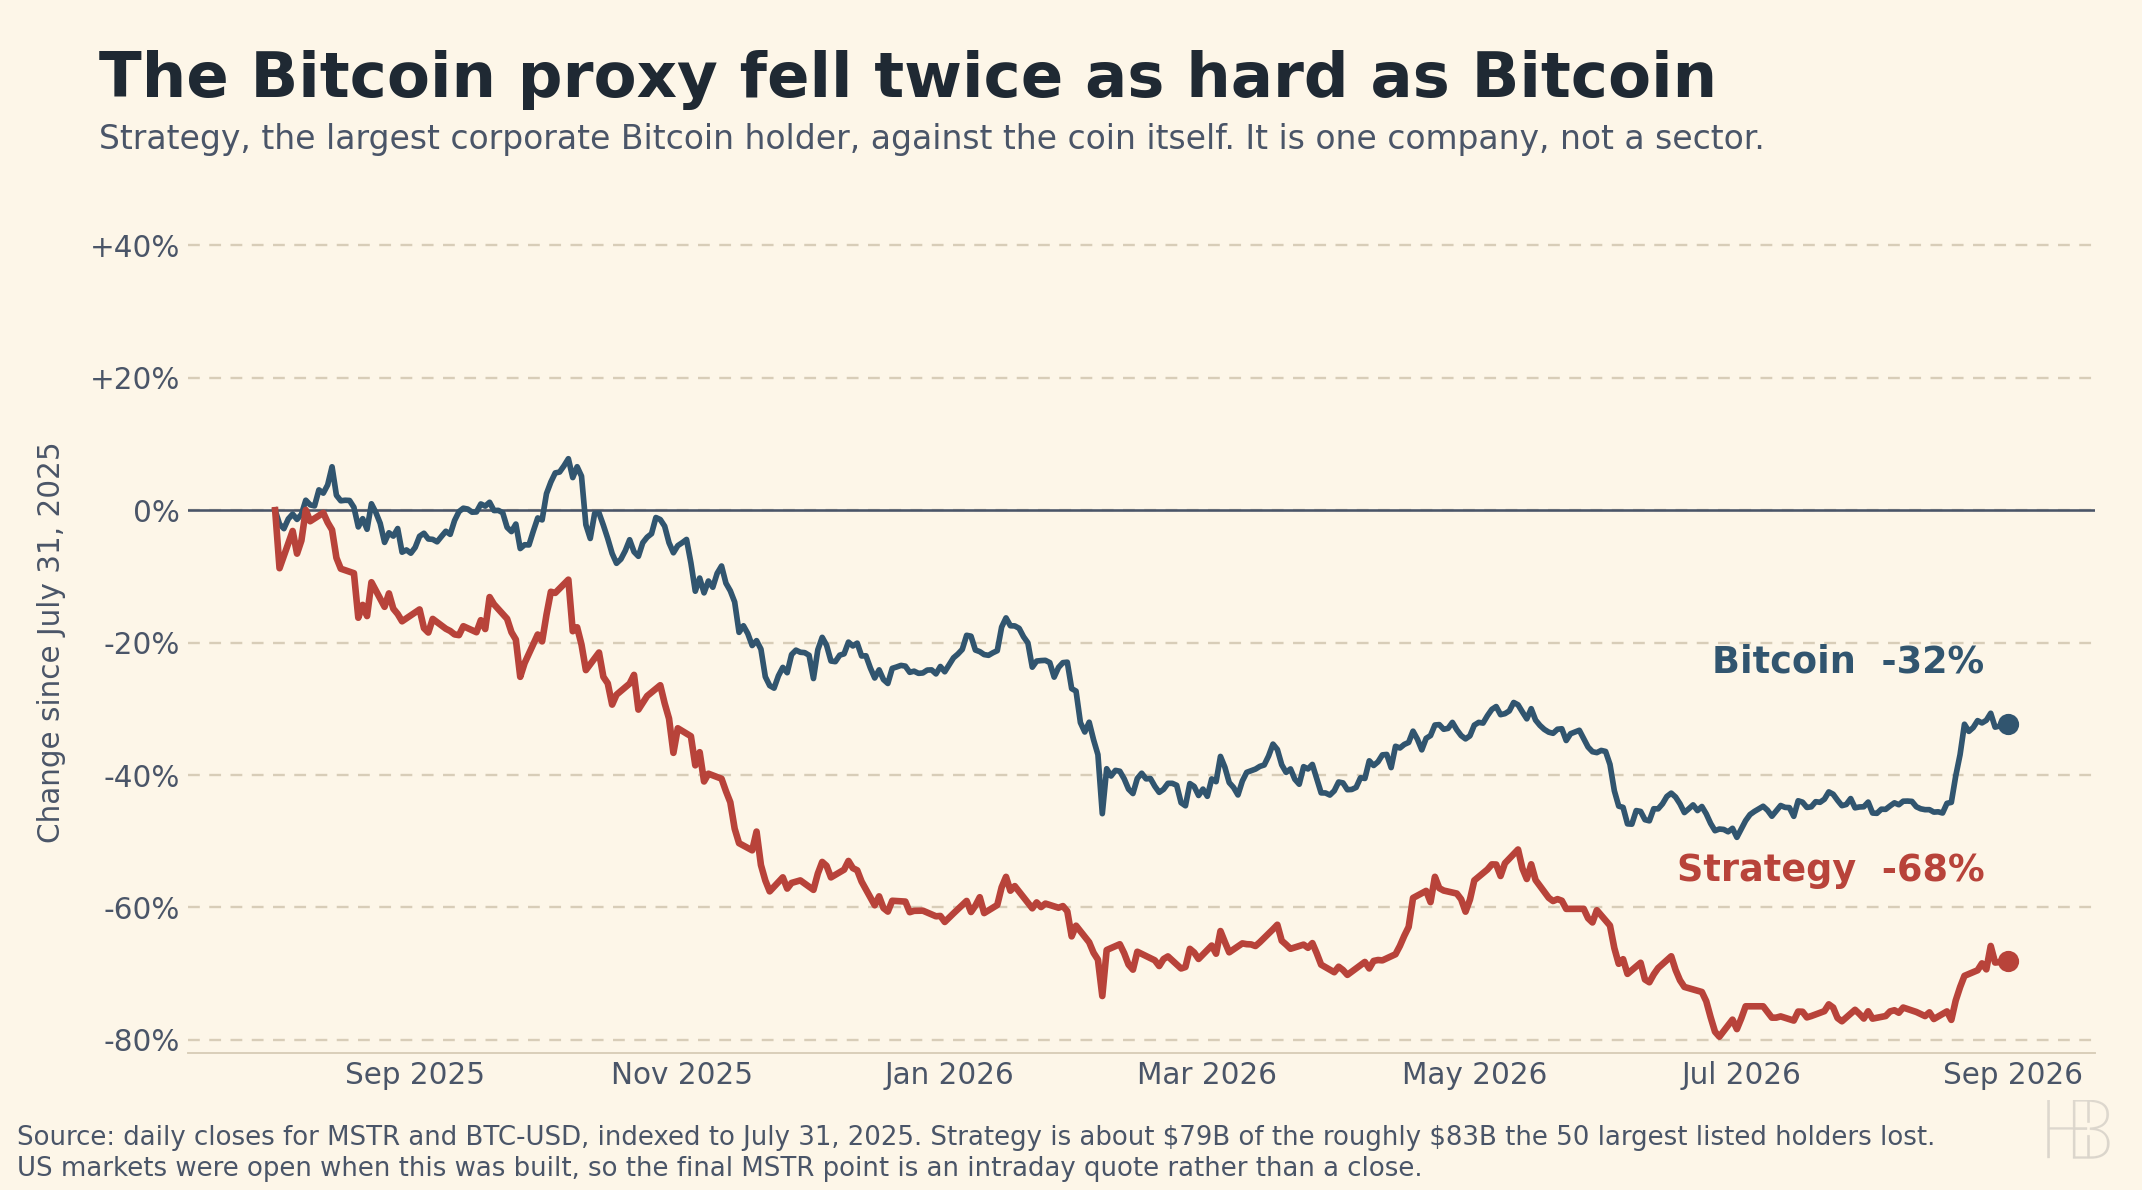
The chart shows the mechanism, and every line in it can be checked. The stock fell roughly twice as far as the asset it exists to hold. That gap is the thesis breaking: the shares used to trade at a premium to the coins on the balance sheet, and the premium is what went away. One further correction to a figure doing the rounds, that Bitcoin is "still down 28% year to date." It closed 2025 at $87,509 and sits near $78,400, which is down about 10% on the year.
Sources
- Mortgage News Daily (mortgage rates)
- Market Briefs (market data)
- Redfin (housing migration report, Q1 2026)
- U.S. Treasury (daily yield curve)
- Yahoo Finance (CBOT wheat futures)
- Yahoo Finance (CBOT corn futures)
- Yahoo Finance (Brent front-month futures)
- Yahoo Finance (Strategy and Bitcoin closes)
- Fortune (gold spot)
- Fortune (silver spot)
- CoinGecko (crypto quotes)
- Live Inventory (5-city MLS board)
Disclaimer: The market data, rates, and information provided are for informational purposes only and should not be considered financial advice. Always verify rates and data with your lender or financial advisor before making any decisions.