


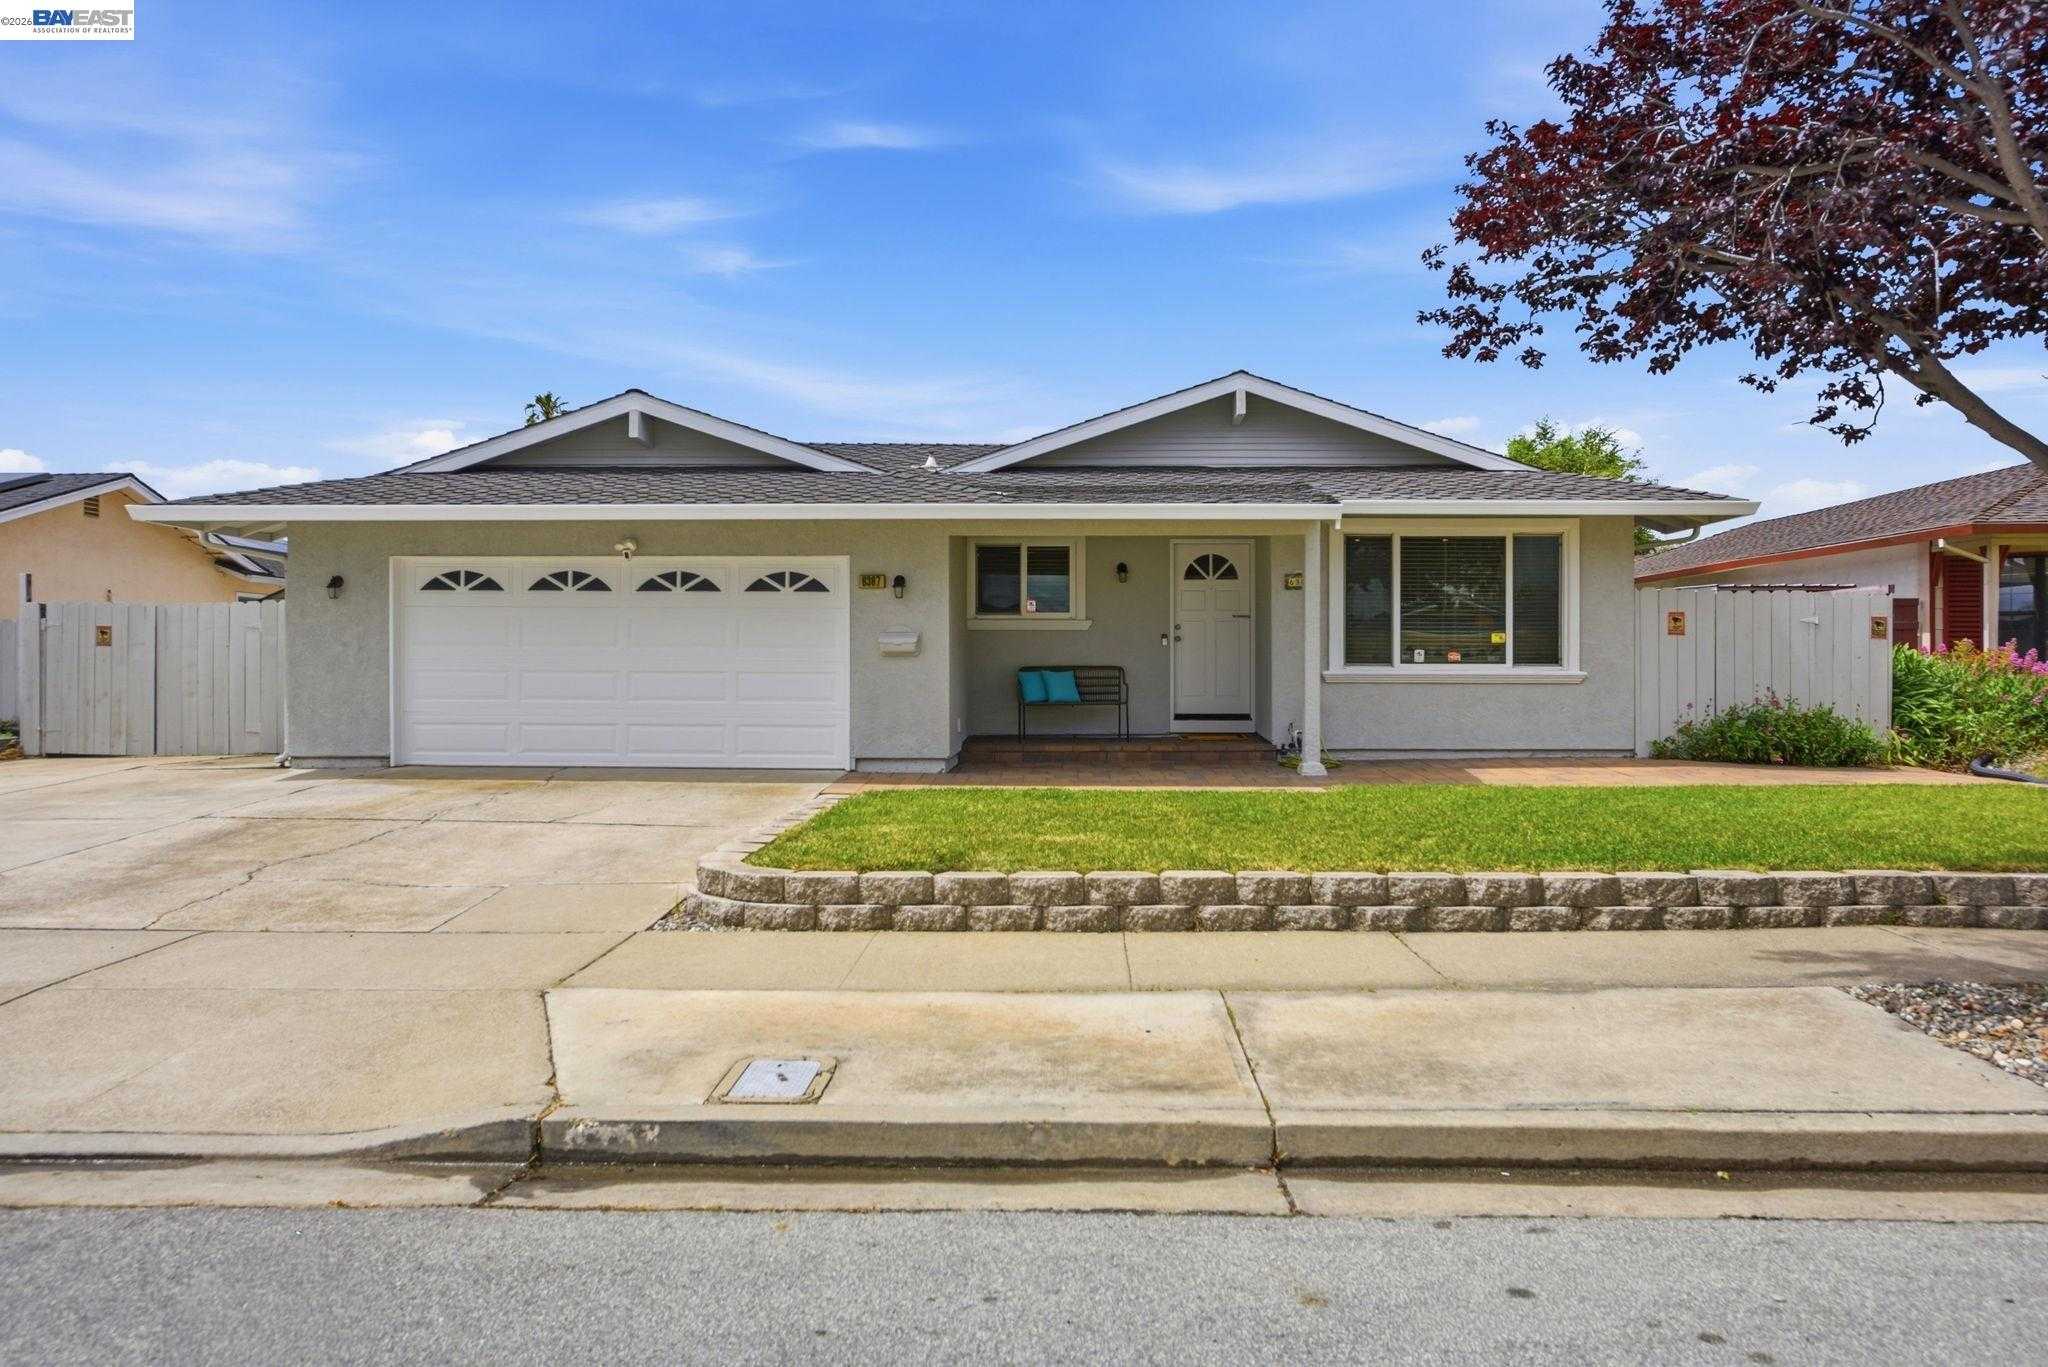

"At a Glance" Local Housing STATS and News 08/28/26
August 28, 2026 · Alameda County Market Dashboard
TODAY'S LIVE INVENTORY
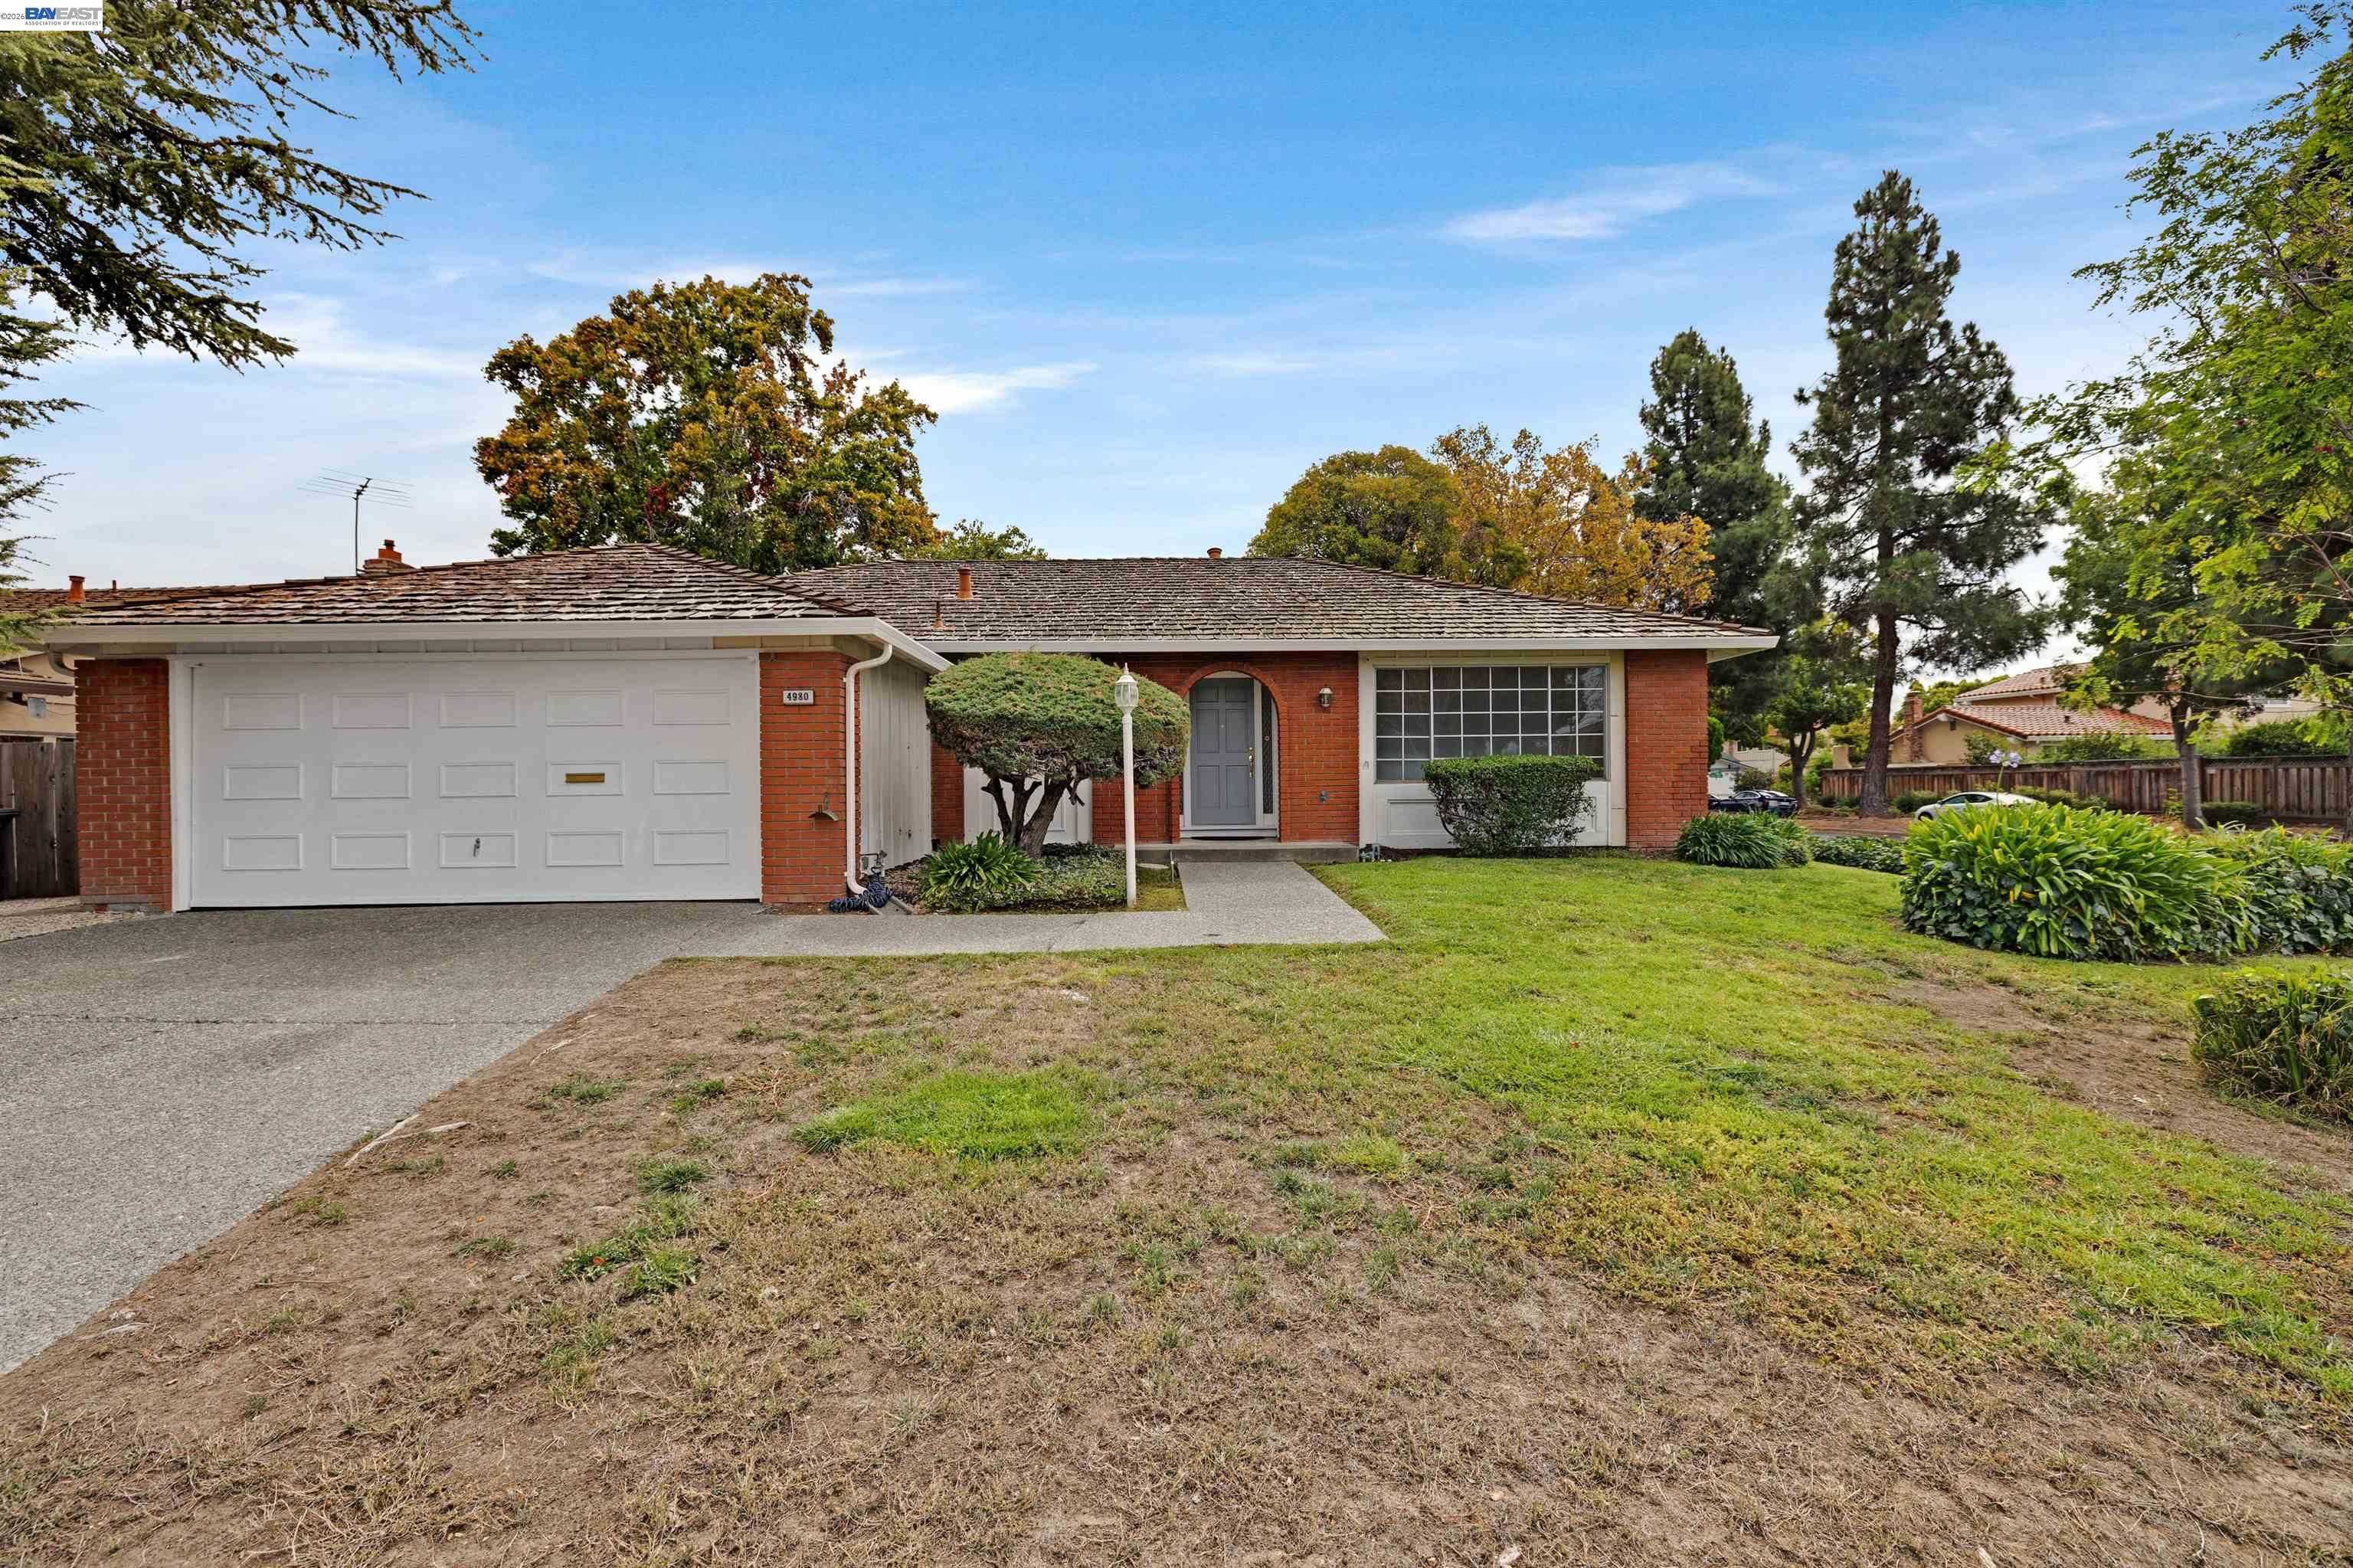
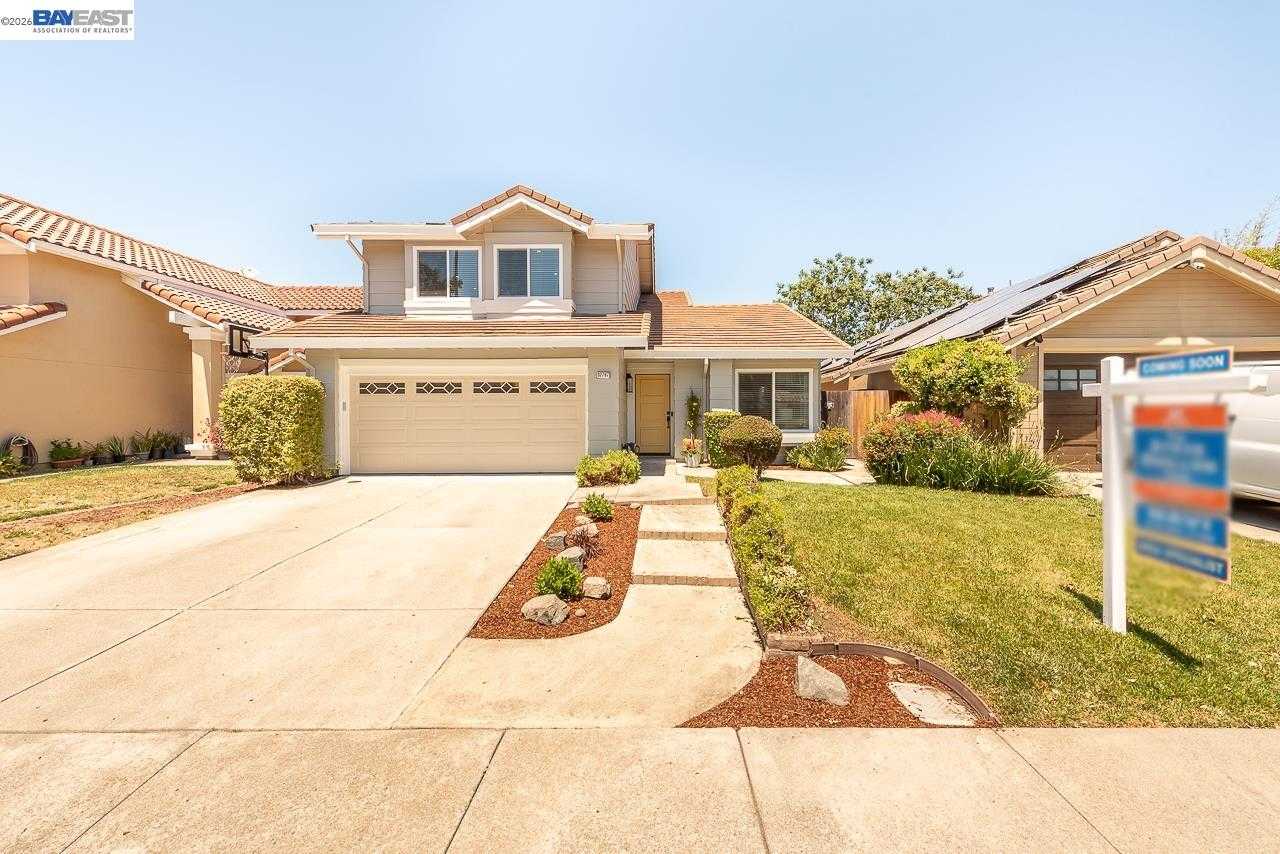
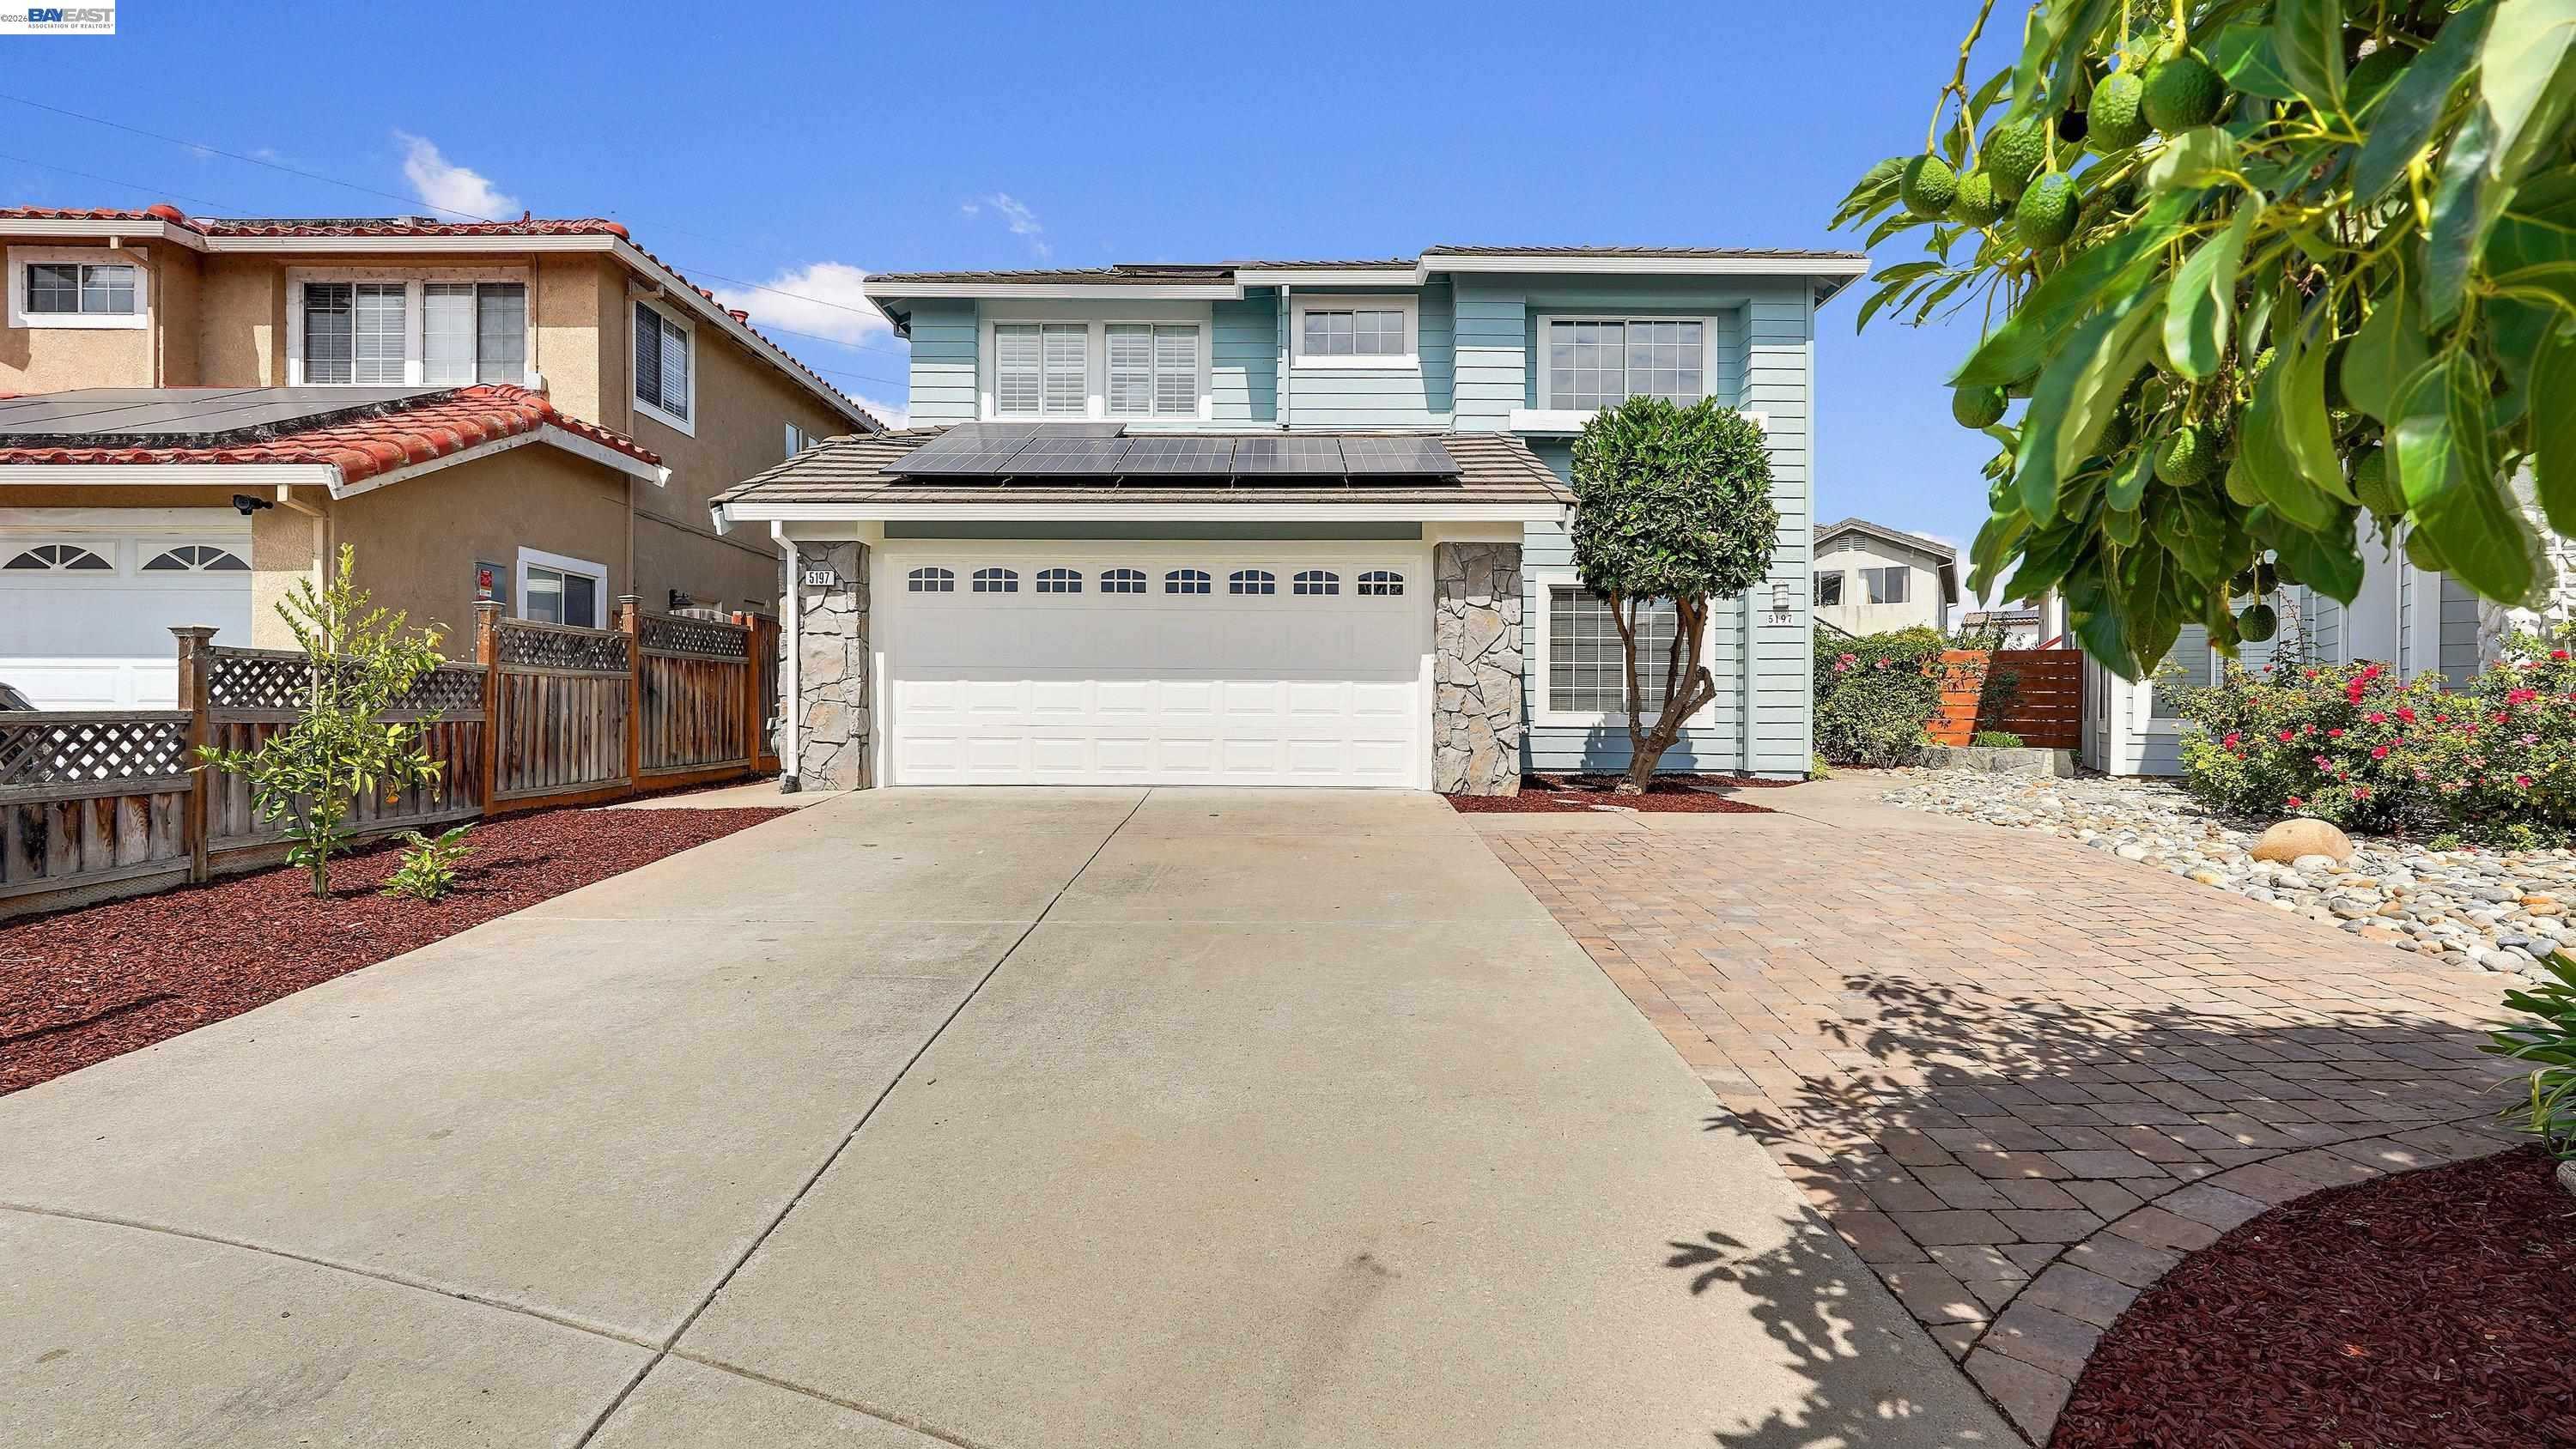
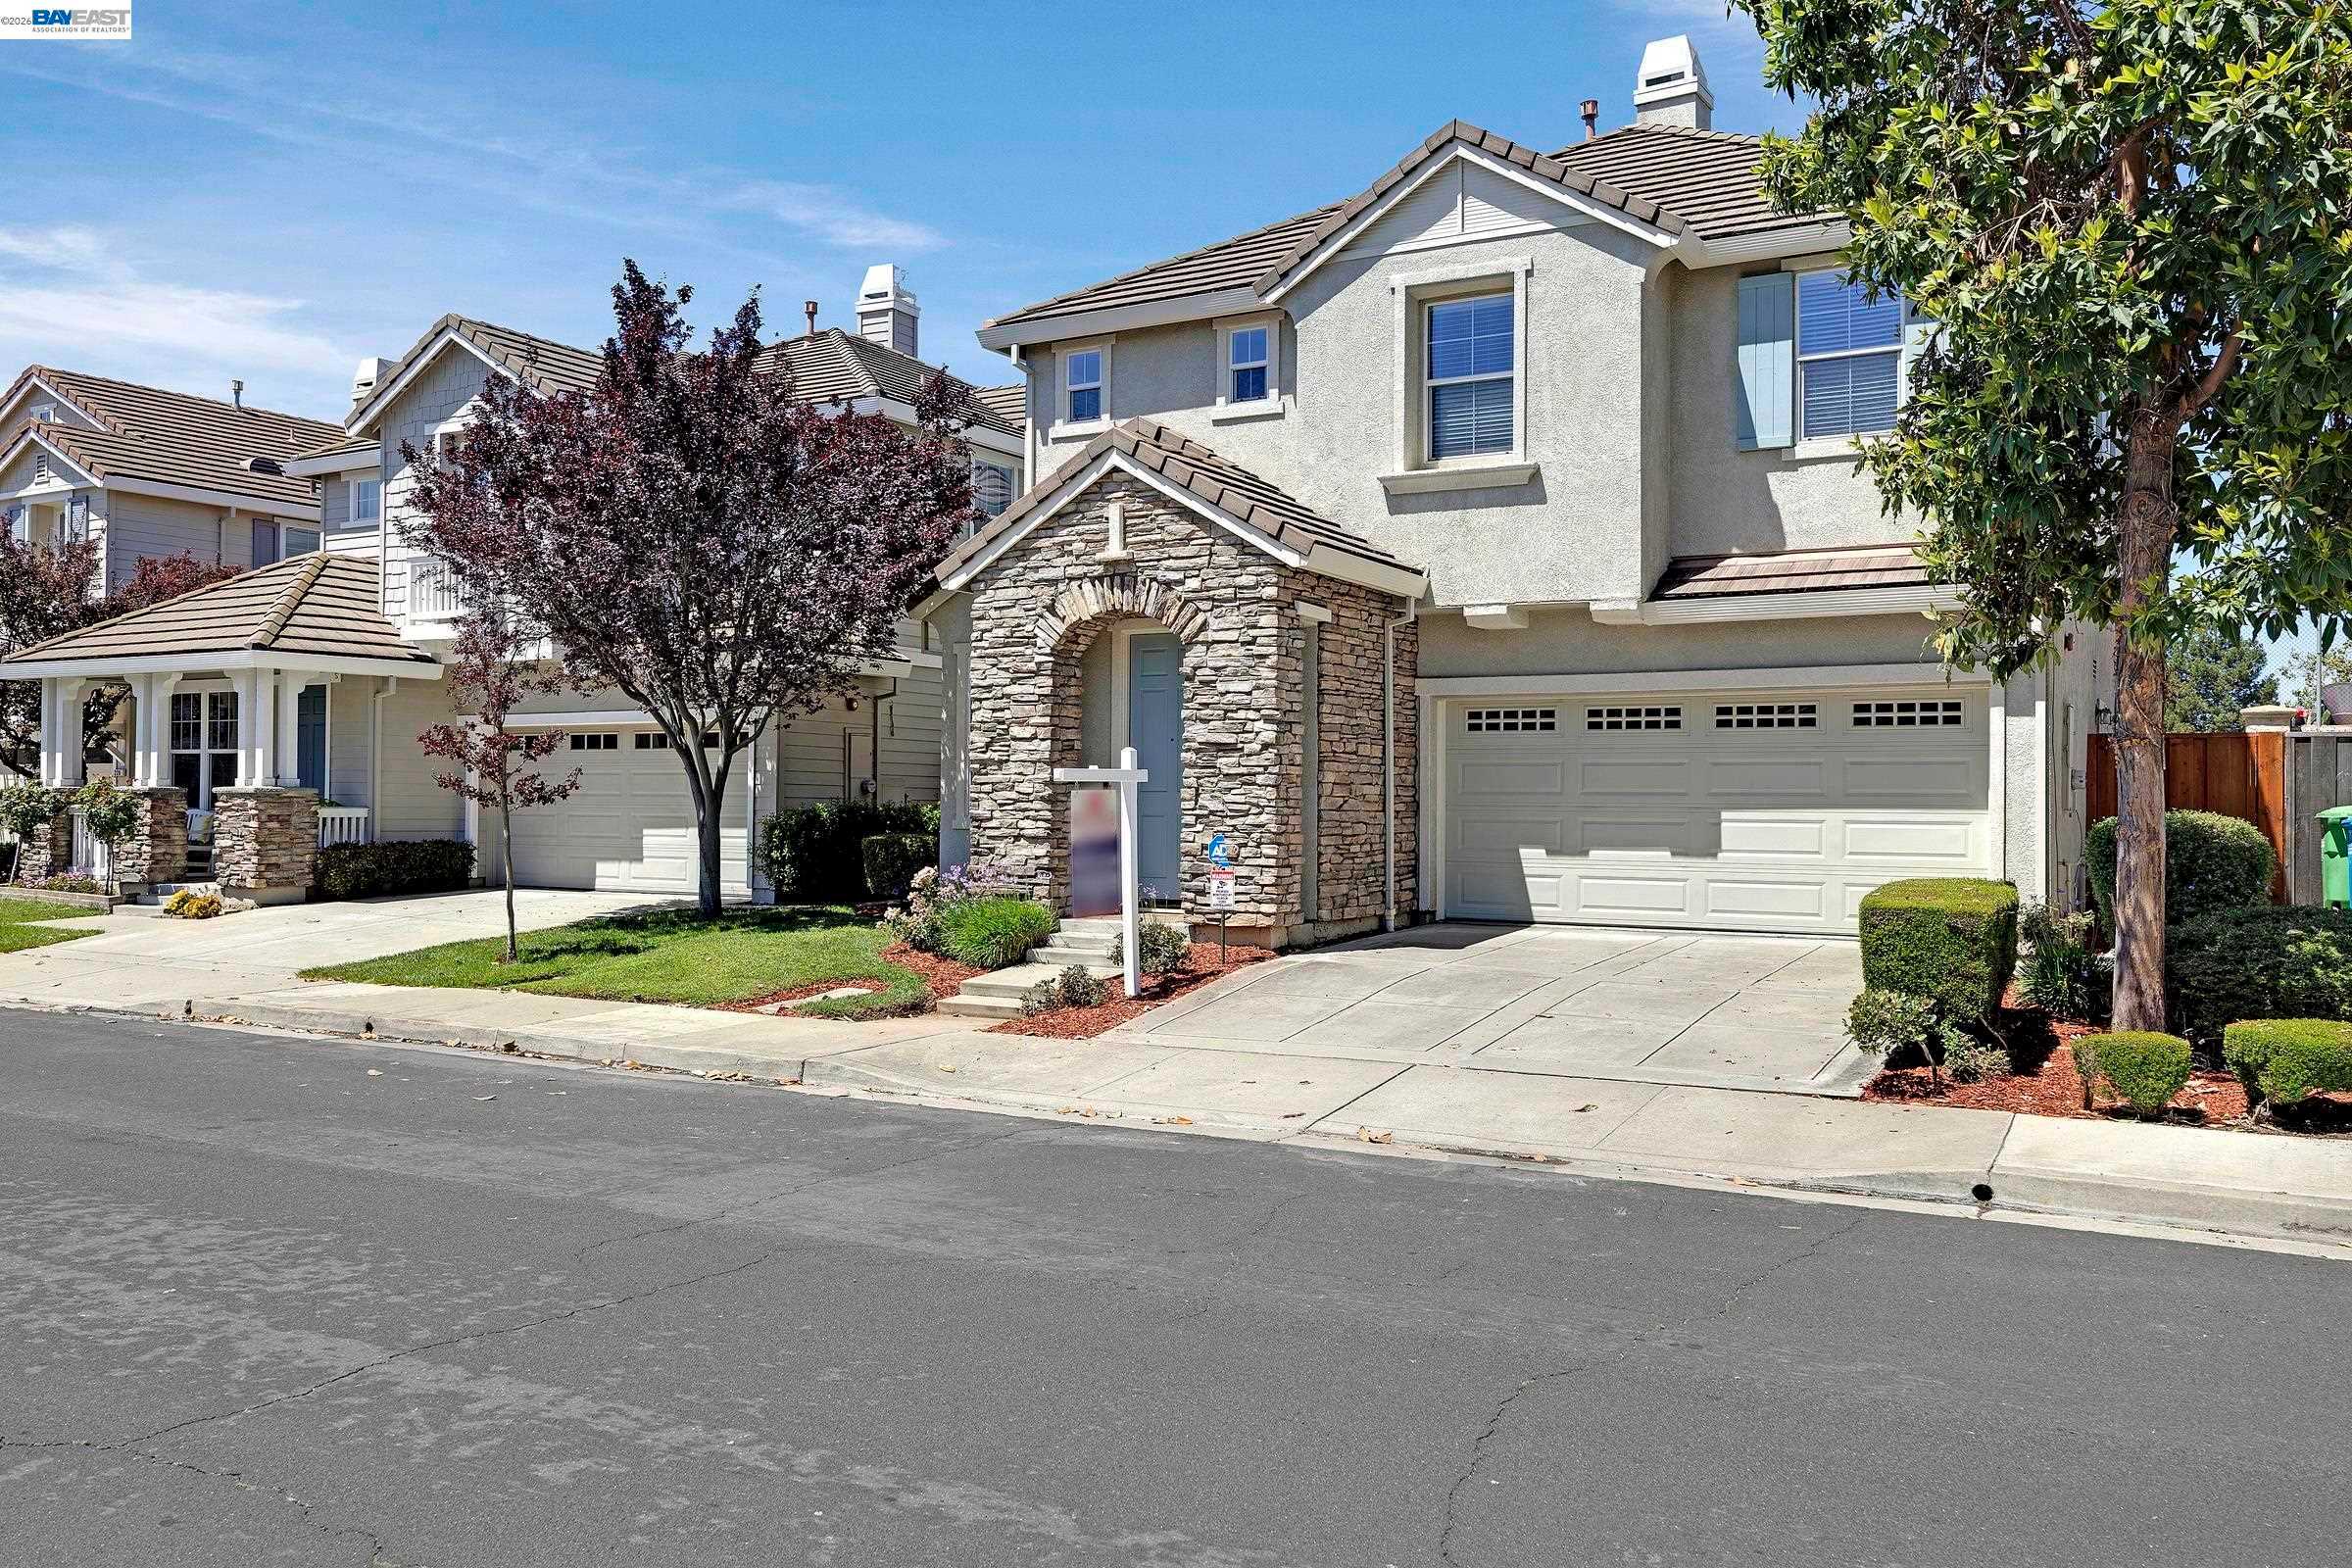
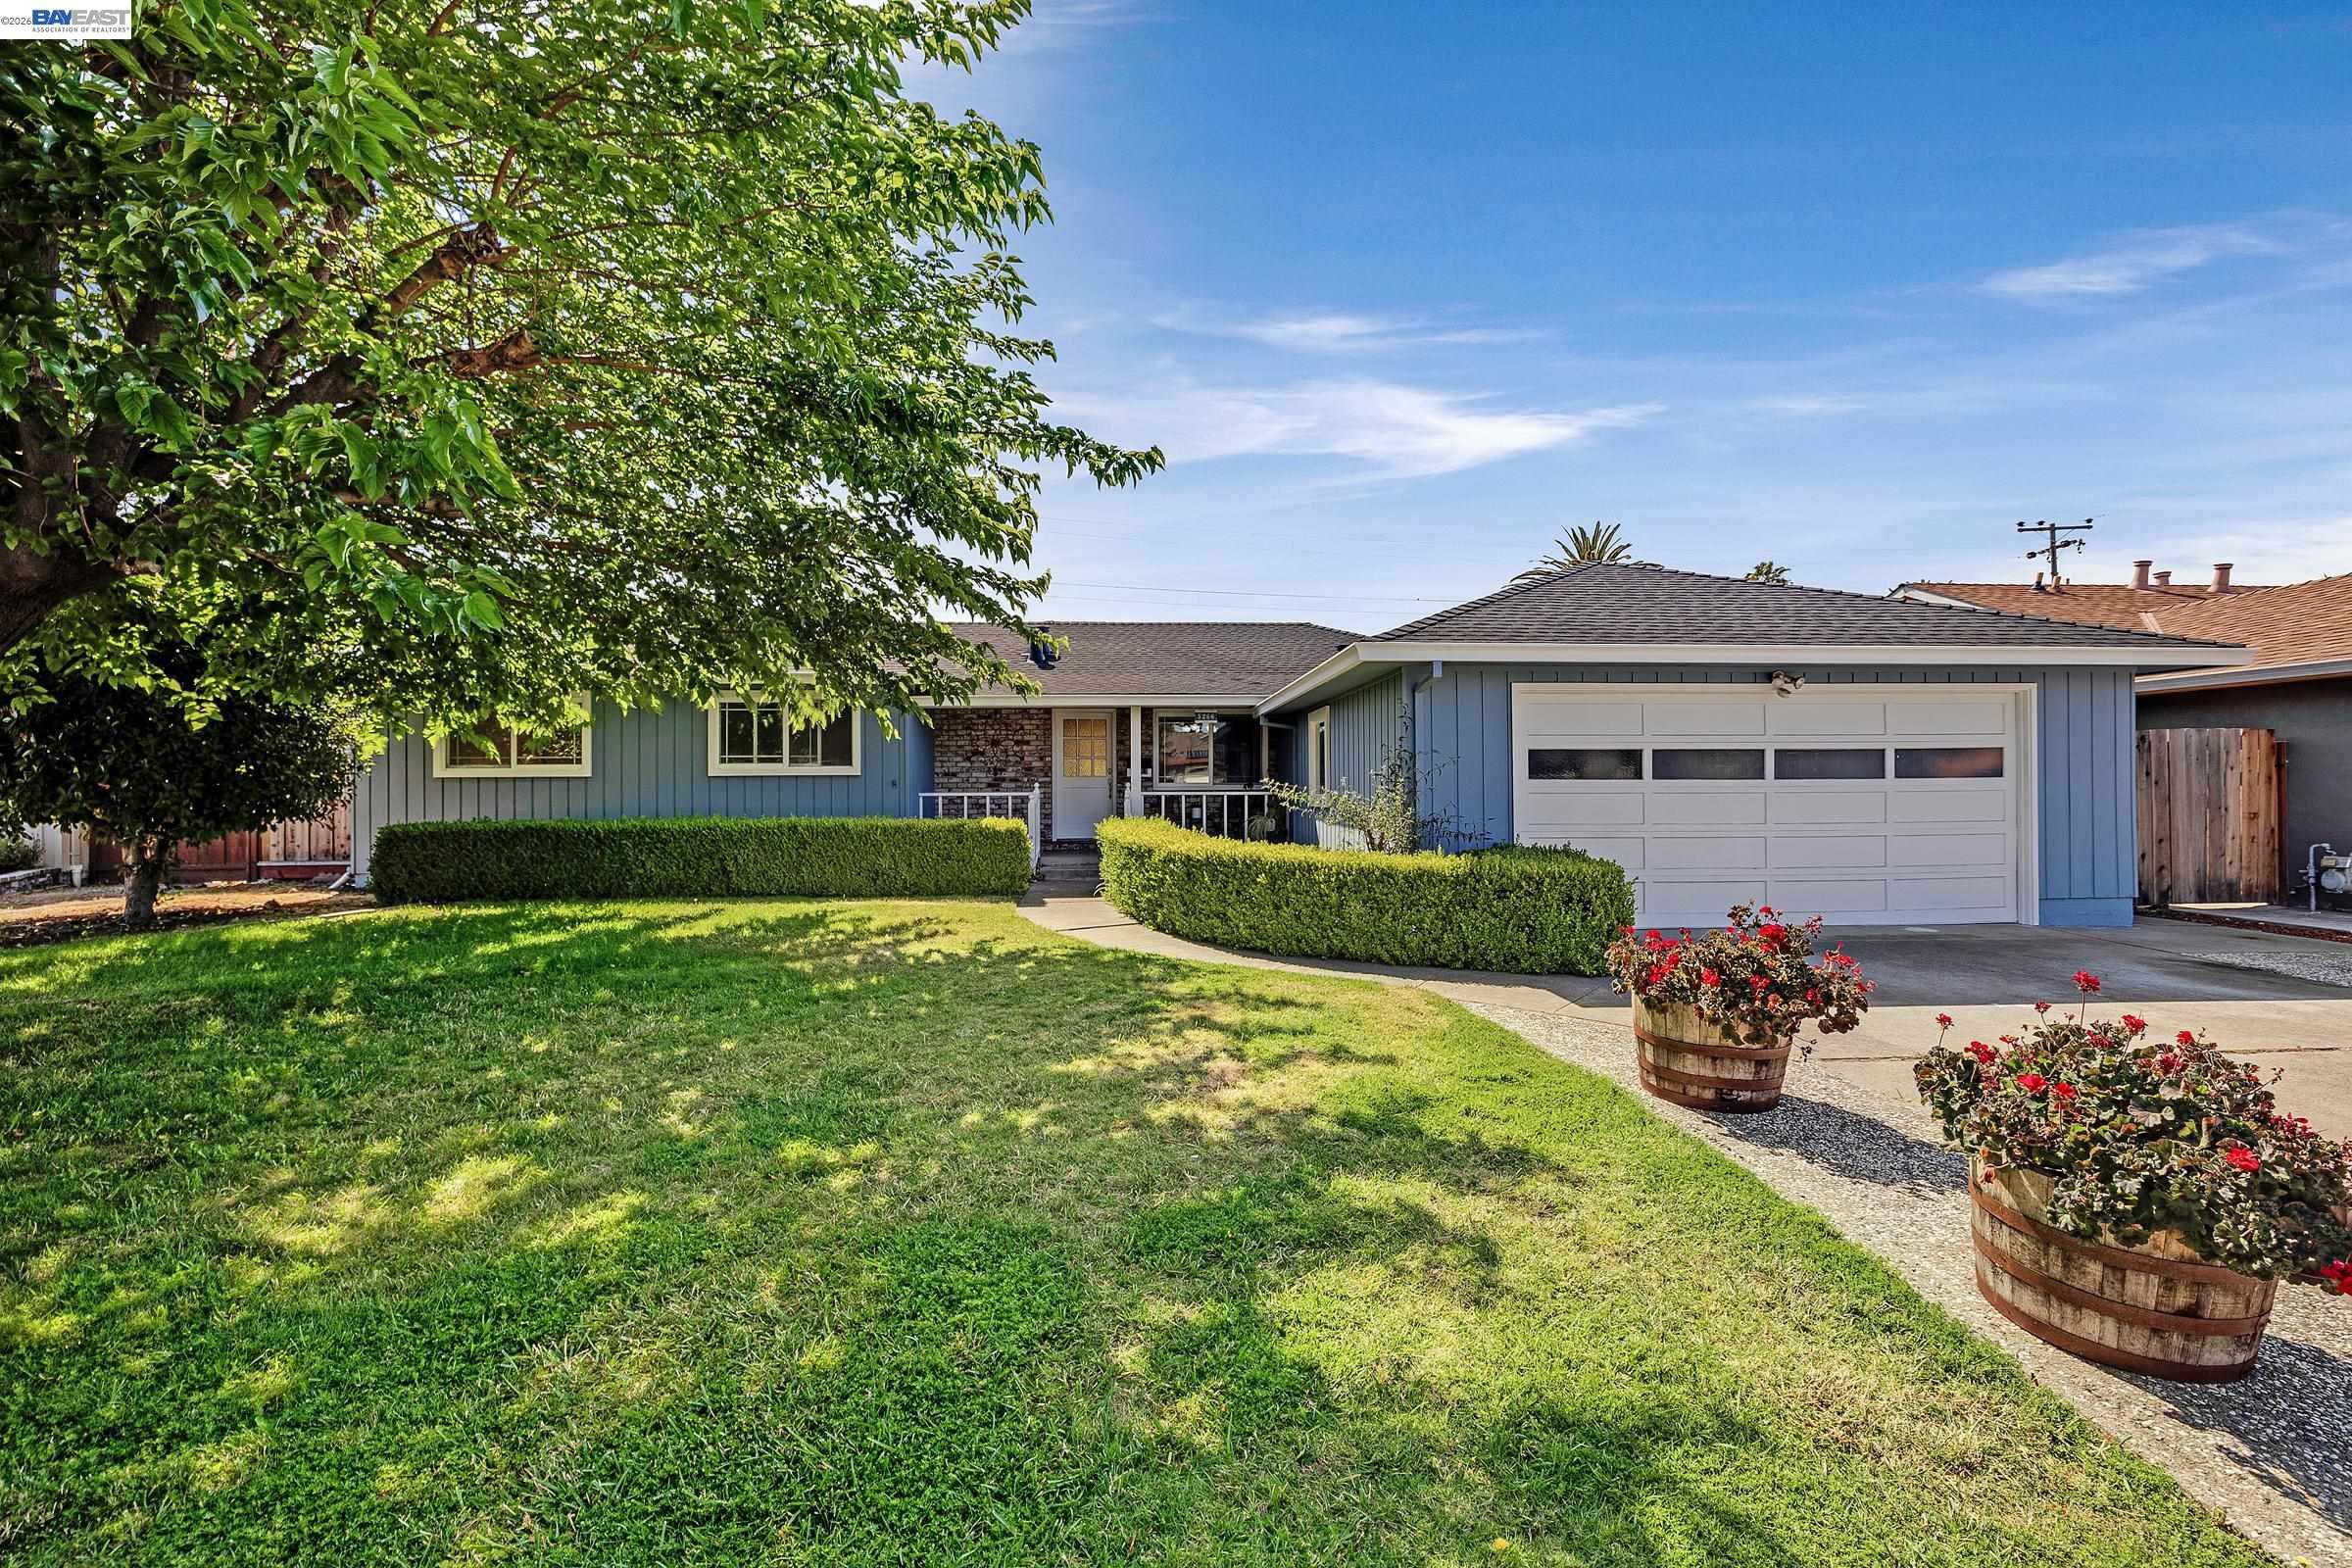
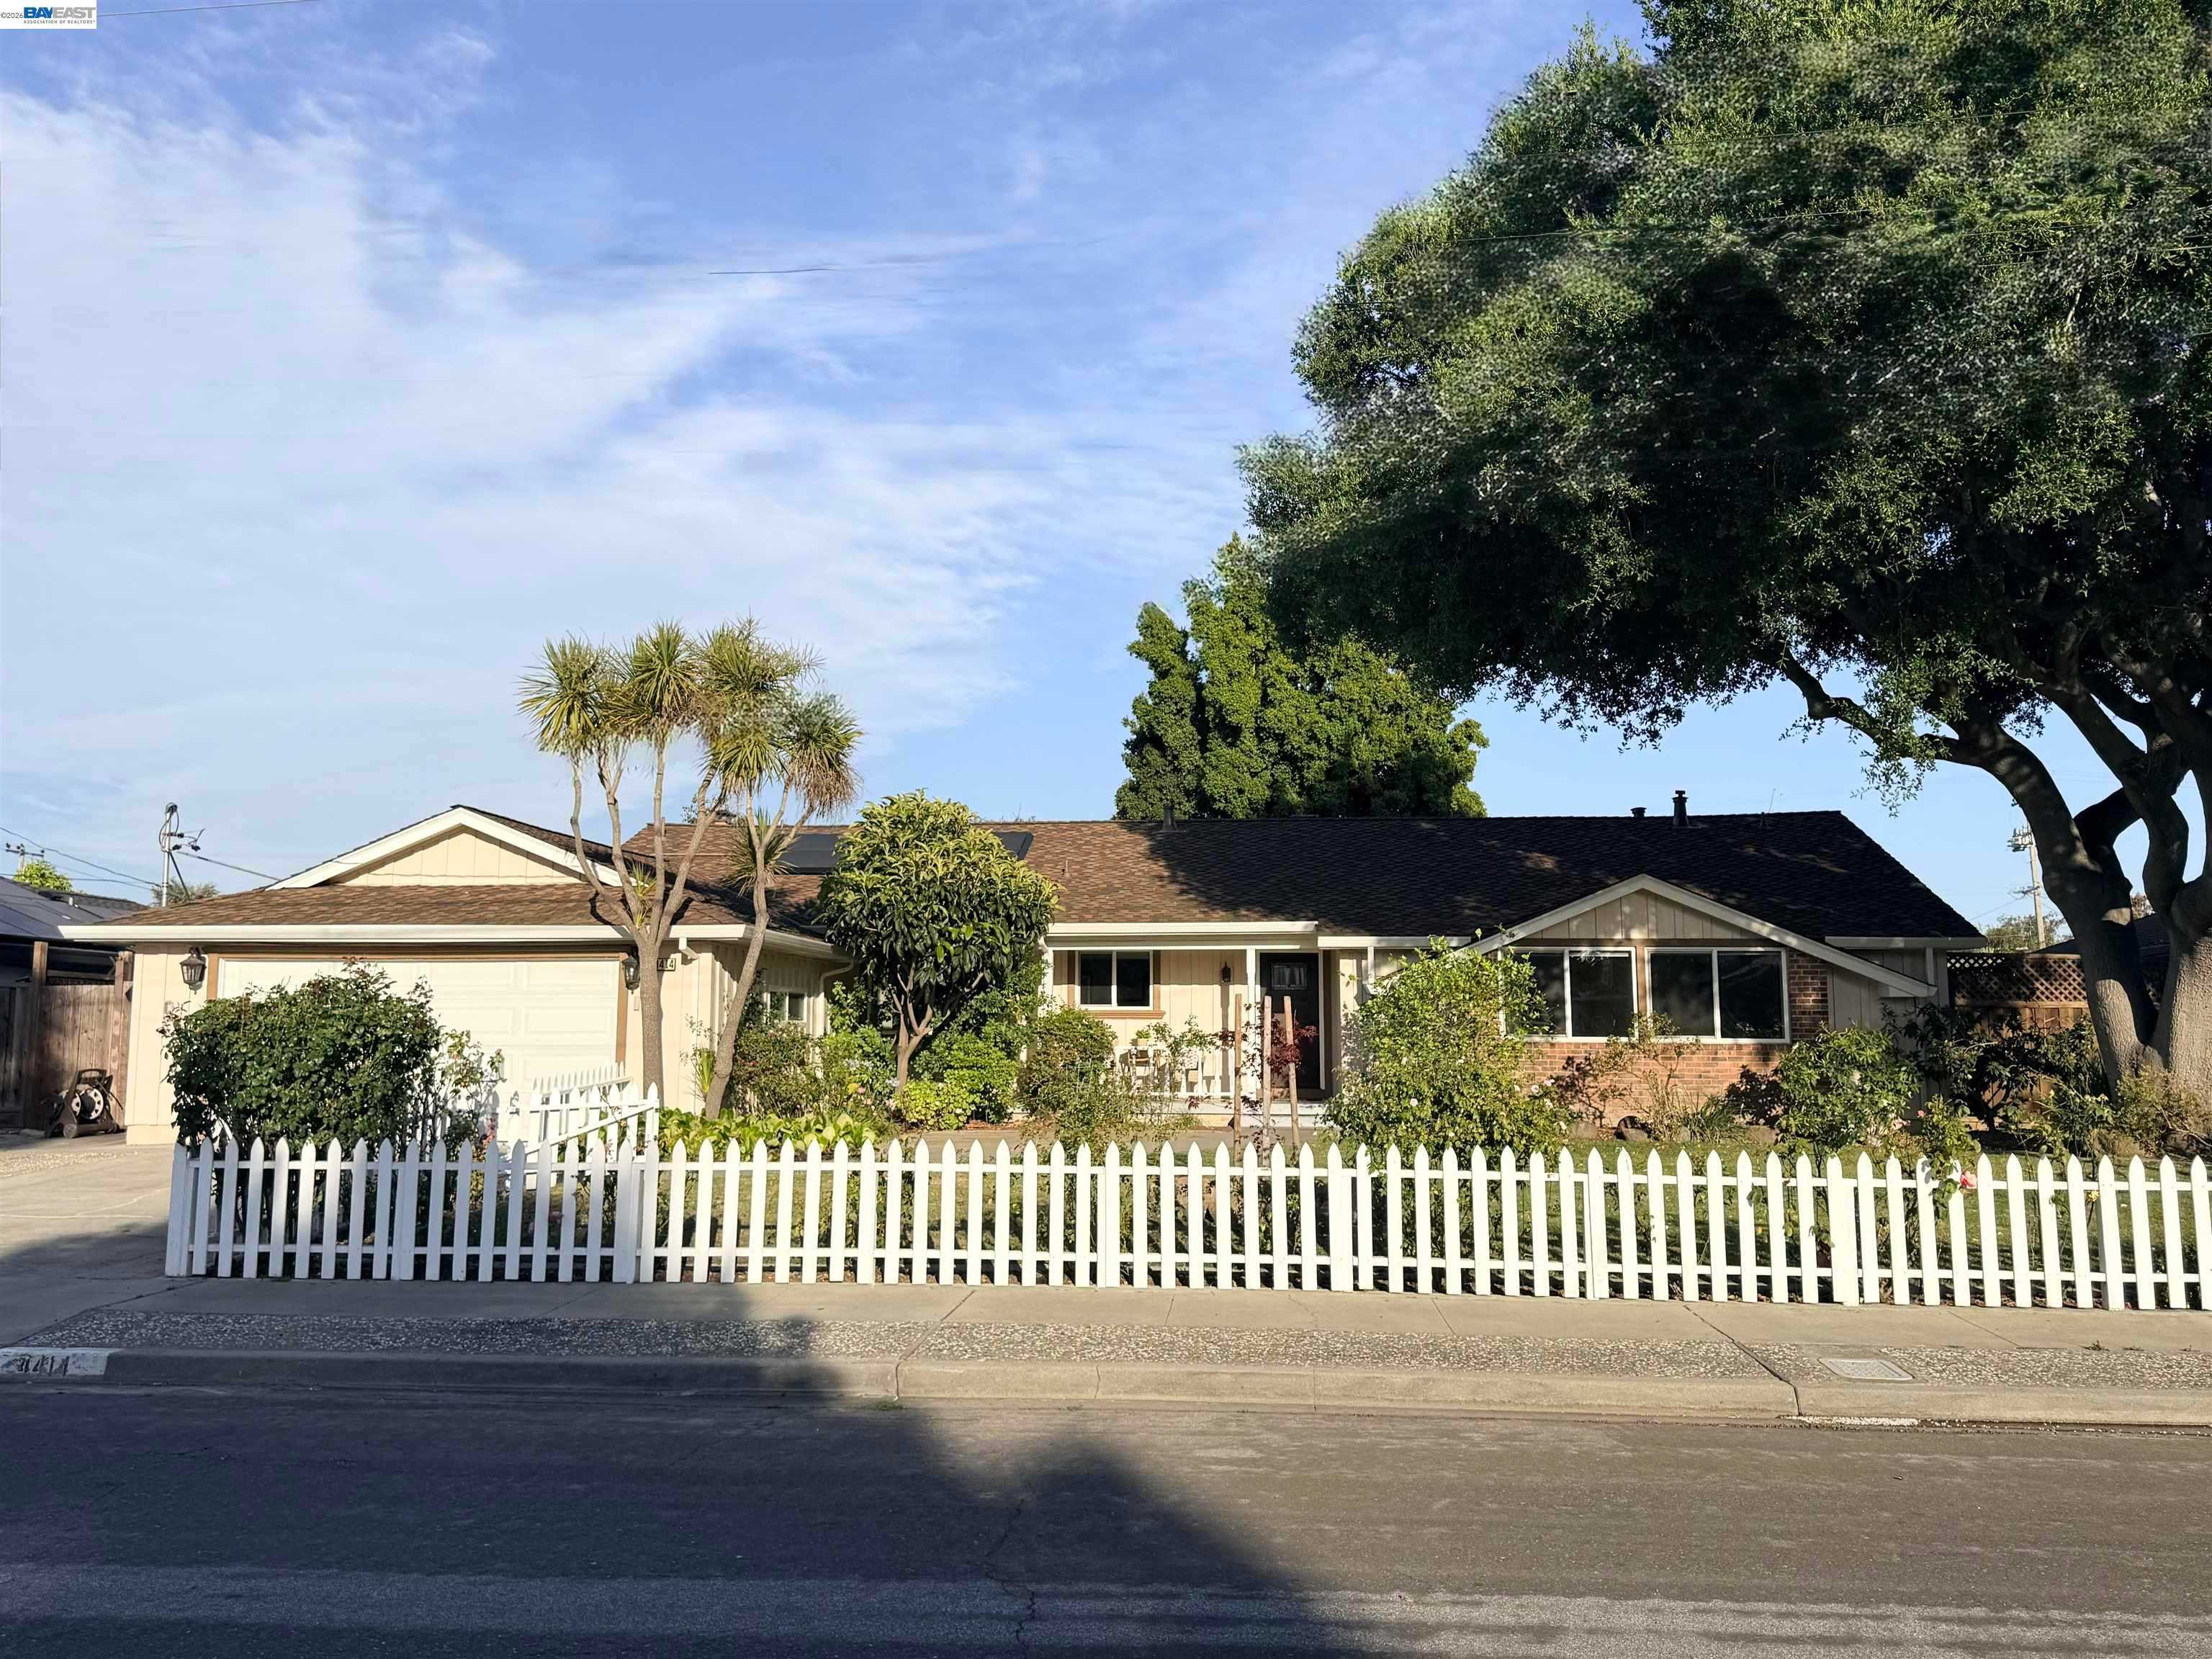
Behind these county totals: hundreds of homes still for sale in Fremont, Hayward, Union City, Newark and Milpitas, one live ledger with prices, sizes and a market read, refreshed each morning from the same MLS export.
30-Year Fixed: 6.81% ▲ 0.06% | 15-Year Fixed: 6.35% ▲ 0.03%
Rates moved up for the first time this week. Mortgage News Daily has the 30-year at 6.81% and the 15-year at 6.35%, six and three basis points higher after four sessions of sitting still. This morning's newsletter still printed 6.75% and 6.32%, which were yesterday's numbers.
Why they moved. The ten year yield rose, Brent gained 2%, and the Fed spent the day at Jackson Hole calling inflation sticky and stubborn. Mortgage rates track the ten year, and the ten year is not falling.
The national rent headline does not describe our rents
Apartment List reported that the national median rent rose 0.1% in August to $1,390, the first August increase in four years, with its vacancy index down to 7.1% and falling for the first time since 2021. That is a genuine turn in the national rental market and the newsletter reported it accurately.
It also describes nobody here. One caution belongs with the chart below: Apartment List and Zillow measure different things, so that $1,390 and these bars are not the same series and should never be set beside each other. The chart is built entirely from Zillow's index, national line included, so the comparison inside it is consistent.
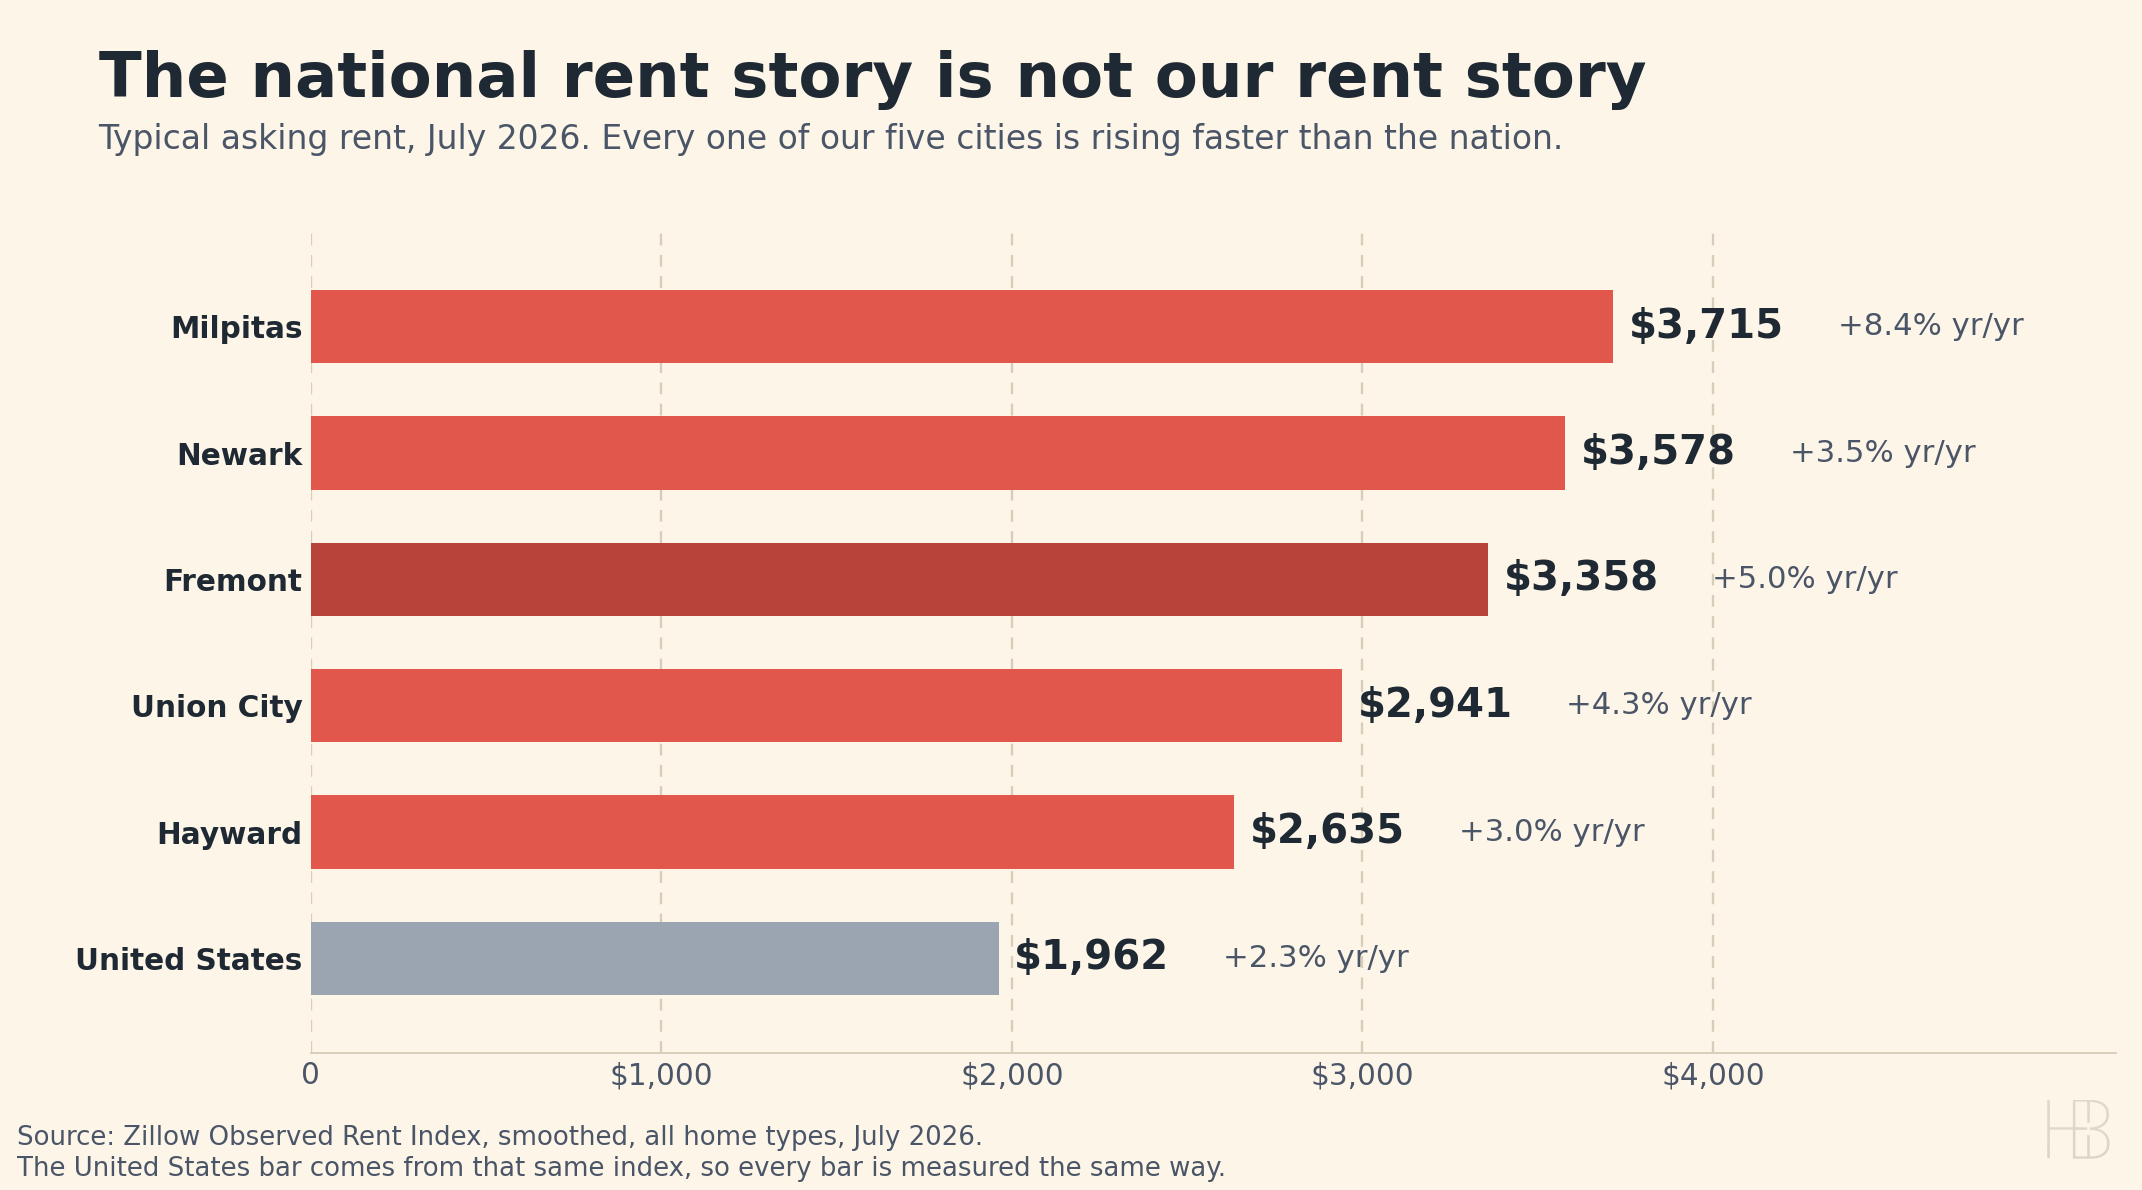
Typical asking rent in Fremont is $3,358, some 71% above the national figure and up 5.0% over the year. Milpitas is both the fastest riser at 8.4% and the priciest at $3,715. Newark is $3,578, Union City $2,941 and Hayward $2,635. The cheapest of the five still costs a third more than the national number.
What to do with it. When a buyer says they will rent one more year and wait for rates, this is the arithmetic they are actually choosing. Waiting here does not cost $1,390 a month. It costs $2,600 to $3,700, rising faster than the country, against a 30-year fixed that just moved six basis points the wrong way.
Locally the board is carrying 2,741 listings across the 15 city board, counting everything active alongside everything in contract, with 192 coming soon and 191 brand new today. That is 32 more than yesterday. Our own 5 city ledger shows 716 homes a buyer can pursue right now, including 54 brand new listings and 96 more coming soon. The full, always-updating ledger lives at harvrealtor.net/live-inventory.
Today’s Live Inventory (buyable now)
- Fremont: 282 available (219 active, 22 new, 41 coming soon)
- Hayward: 189 available (157 active, 17 new, 15 coming soon)
- Milpitas: 112 available (83 active, 2 new, 27 coming soon)
- Newark: 75 available (57 active, 10 new, 8 coming soon)
- Union City: 58 available (50 active, 3 new, 5 coming soon)
Watch the pending count, not the active count. Fremont sat at 102 listings in contract for three straight days, went to 101 yesterday and is 99 today, slipping under 100 for the first time in more than a week. Active supply barely moved, holding at 250 against 251. Supply is not what changed here. Absorption is.
Yesterday eleven staged listings went live at once and the coming soon block fell to 41. Today that block held at 41 while 22 more listings came out new, so the pipeline is refilling about as fast as it empties.
For a seller listing this week, that combination reads as steady competition against a slightly thinner buyer pool. Both point the same direction: price at the front of the market rather than the middle of it. Median asking in Fremont is $1,289,500 at 29 median days on market, and Newark is the quickest of our five at 22 days.
US 10-Year: 4.67% ▲ 0.01% | Gold: $4,608 ▲ 0.41% | Silver: $70.62 ▲ 3.33% | Brent: $89.70 ▲ 2.12%
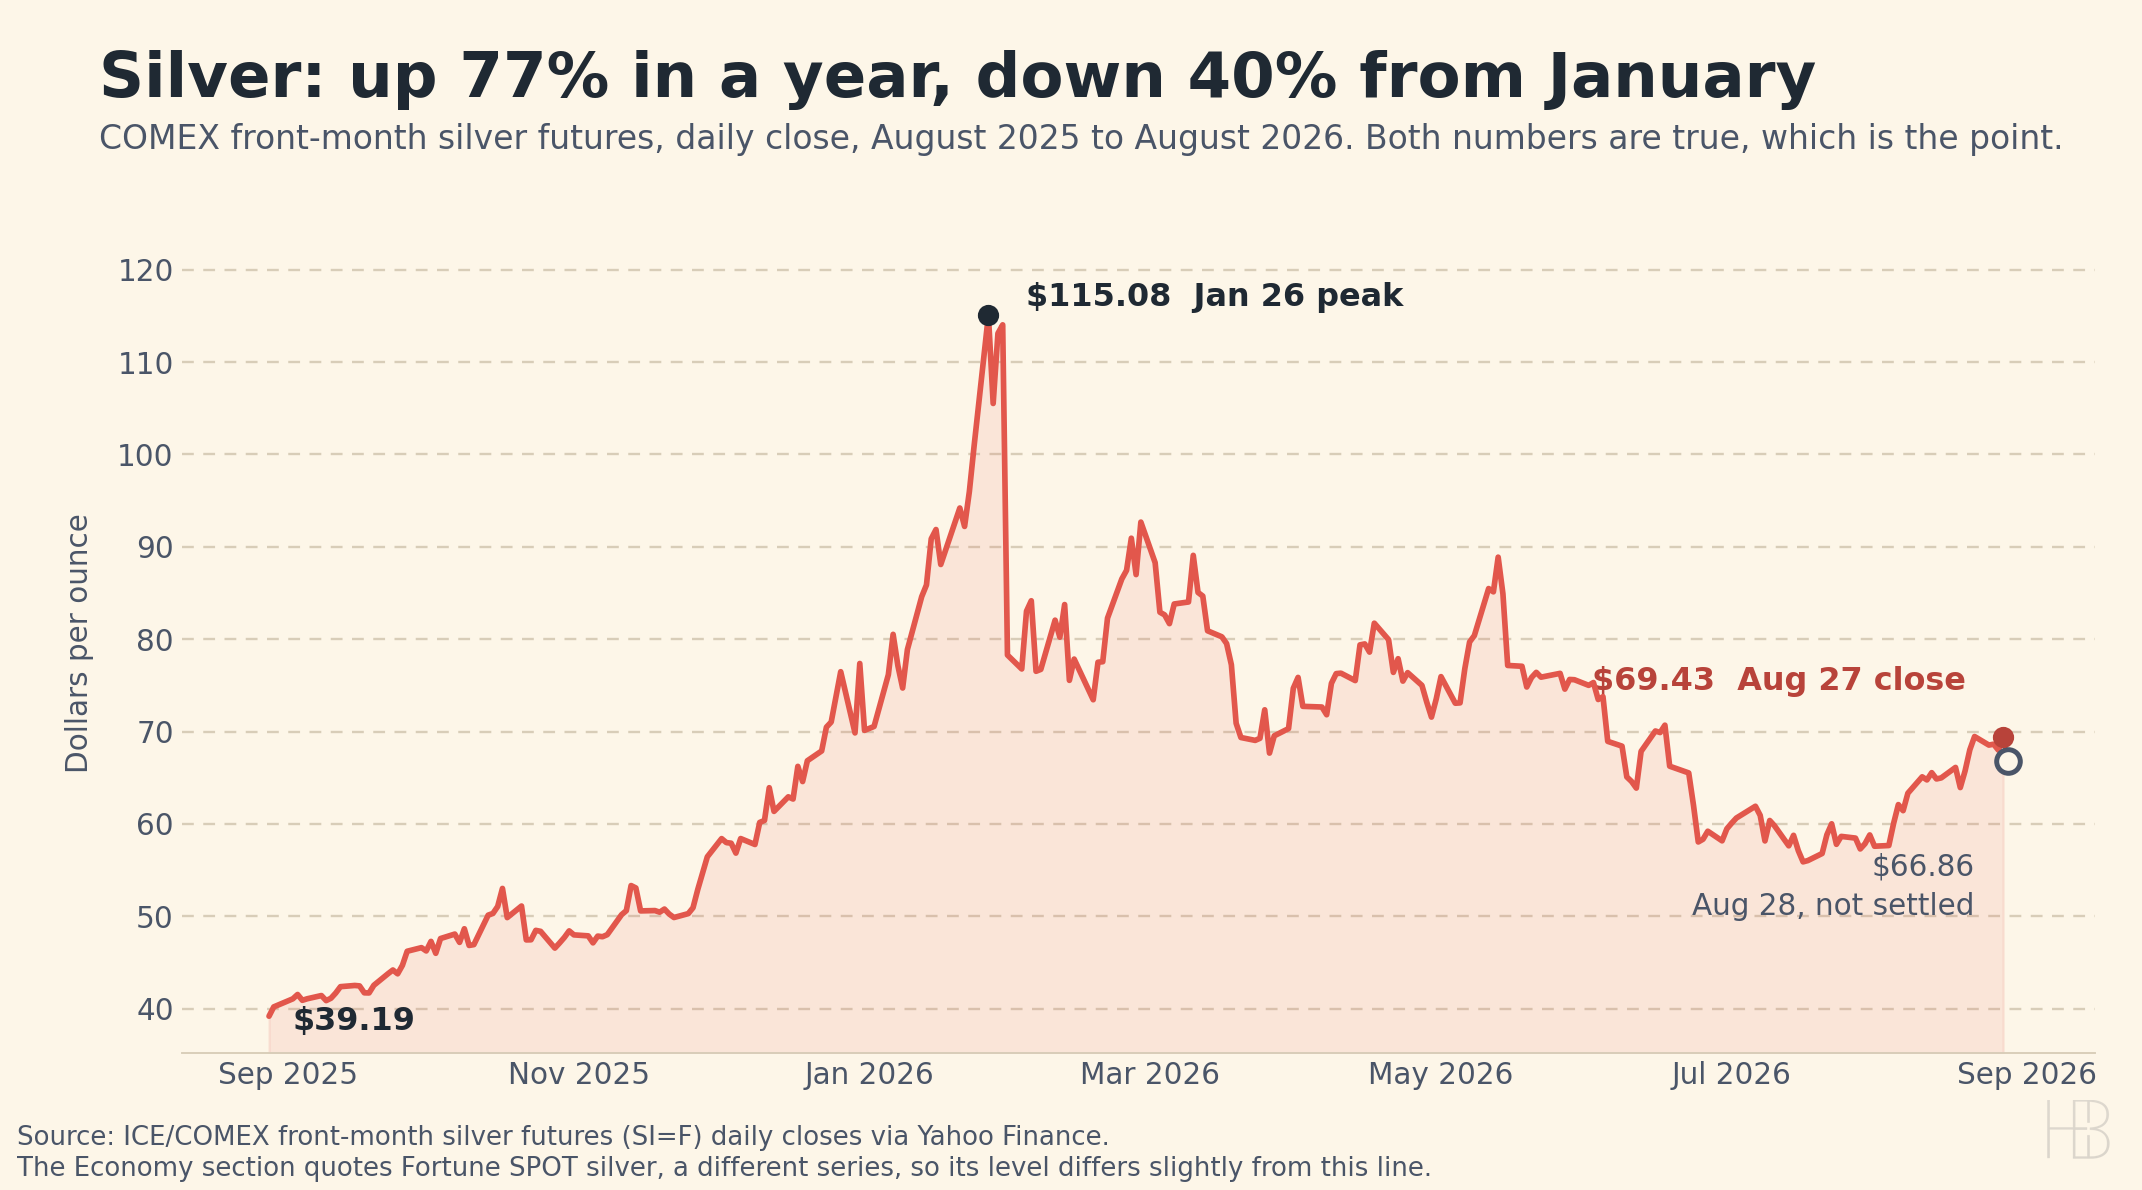
Read those metals figures as a 6:30 AM photograph, not as where the metal sits now. Gold printed $4,608 and silver $70.62 at 6:30 AM Eastern, and both reconcile exactly against yesterday's published prices. Then the US session opened and hard assets were sold. By roughly 2:50 PM Eastern, gold futures were at $4,495.90 against Thursday's $4,609.70 settlement, about 2.5% lower, and silver futures were at $66.86 against Thursday's $69.43, about 3.7% lower.
Silver deserves the closer look, and the chart shows why. From a year ago it is up 77%, the number a bull hands you. From its January 26 peak of $115.08 it is down about 40%, the number nobody hands you. Both are true at once. An asset that round trips like that inside seven months is not behaving like a safe haven, whatever it is being sold as.
Two corrections to this morning's newsletter. It put the ten year at 4.68% and called the day's change zero, while Treasury's own daily curve has August 26 at 4.66% and August 27 at 4.67%, so the yield rose a basis point. And it reported Brent at $89.53 and falling, when the front month contract settled at $89.70 and rose 2.12%. The direction was wrong there, not merely the level, and oil up 2% is a different inflation story from oil drifting lower.
The Fed is at Jackson Hole. Cleveland's Beth Hammack said now is the time to act on rates, Kansas City's Schmid called inflation sticky and stubborn, and Chair Warsh speaks later today. With core inflation at 3.3% against a 2% target, nobody on that stage is preparing the market for a cut.
S&P 500: 7,730 ▲ 0.72% | DOW: 53,569 ▲ 0.20% | NASDAQ: 26,541 ▲ 1.57%
Software came back to life. CrowdStrike jumped 20.5% and Okta 28.6% after both beat their quarterly numbers, carrying the NASDAQ to a 1.57% gain while the DOW managed 0.20%.
Those moves were violent for a reason worth understanding. Investors have spent the year assuming artificial intelligence would eat business software from the inside. Two of the most exposed names just reported that it has not happened yet, and the market repriced them in a single session.
Credit where it is due: all three index figures in this morning's newsletter reconciled exactly against yesterday's published levels, which is the first clean sweep on that line in a while.
BTC: $77,409 ▼ 3.19% | ETH: $2,423 ▼ 2.97% | XRP: $1.37 ▼ 5.08%
Everything is red, and Bitcoin has given up the $80,000 level it spent yesterday defending. XRP is off better than 5%.
This is the same tape as the Economy section above, which is the useful part. Gold down, silver down, crypto down, all on one afternoon, while stocks closed higher yesterday and the ten year ticked up. That pattern is money leaving hard assets rather than money fleeing into them.
A fairness note rather than a correction: the newsletter printed Bitcoin at $80,070 and stamped it 4:00 PM Eastern yesterday, which was accurate when taken. It has simply been overtaken. The same issue ran a story crediting a 20% weekly surge for pulling hedge funds back in, and the asset is down more than 3% since that story was written.
Sources
- Mortgage News Daily (mortgage rates)
- Market Briefs (market data)
- Apartment List (national rent report, August 2026)
- Zillow Research (Zillow Observed Rent Index, July 2026)
- U.S. Treasury (daily yield curve)
- Yahoo Finance (Brent front-month futures)
- Yahoo Finance (COMEX silver futures)
- Fortune (gold spot)
- Fortune (silver spot)
- CoinGecko (crypto quotes)
- Live Inventory (5-city MLS board)
Disclaimer: The market data, rates, and information provided are for informational purposes only and should not be considered financial advice. Always verify rates and data with your lender or financial advisor before making any decisions.