



"At a Glance" Local Housing STATS and News 08/11/26
August 11, 2026 · Alameda County Market Dashboard
TODAY'S LIVE INVENTORY
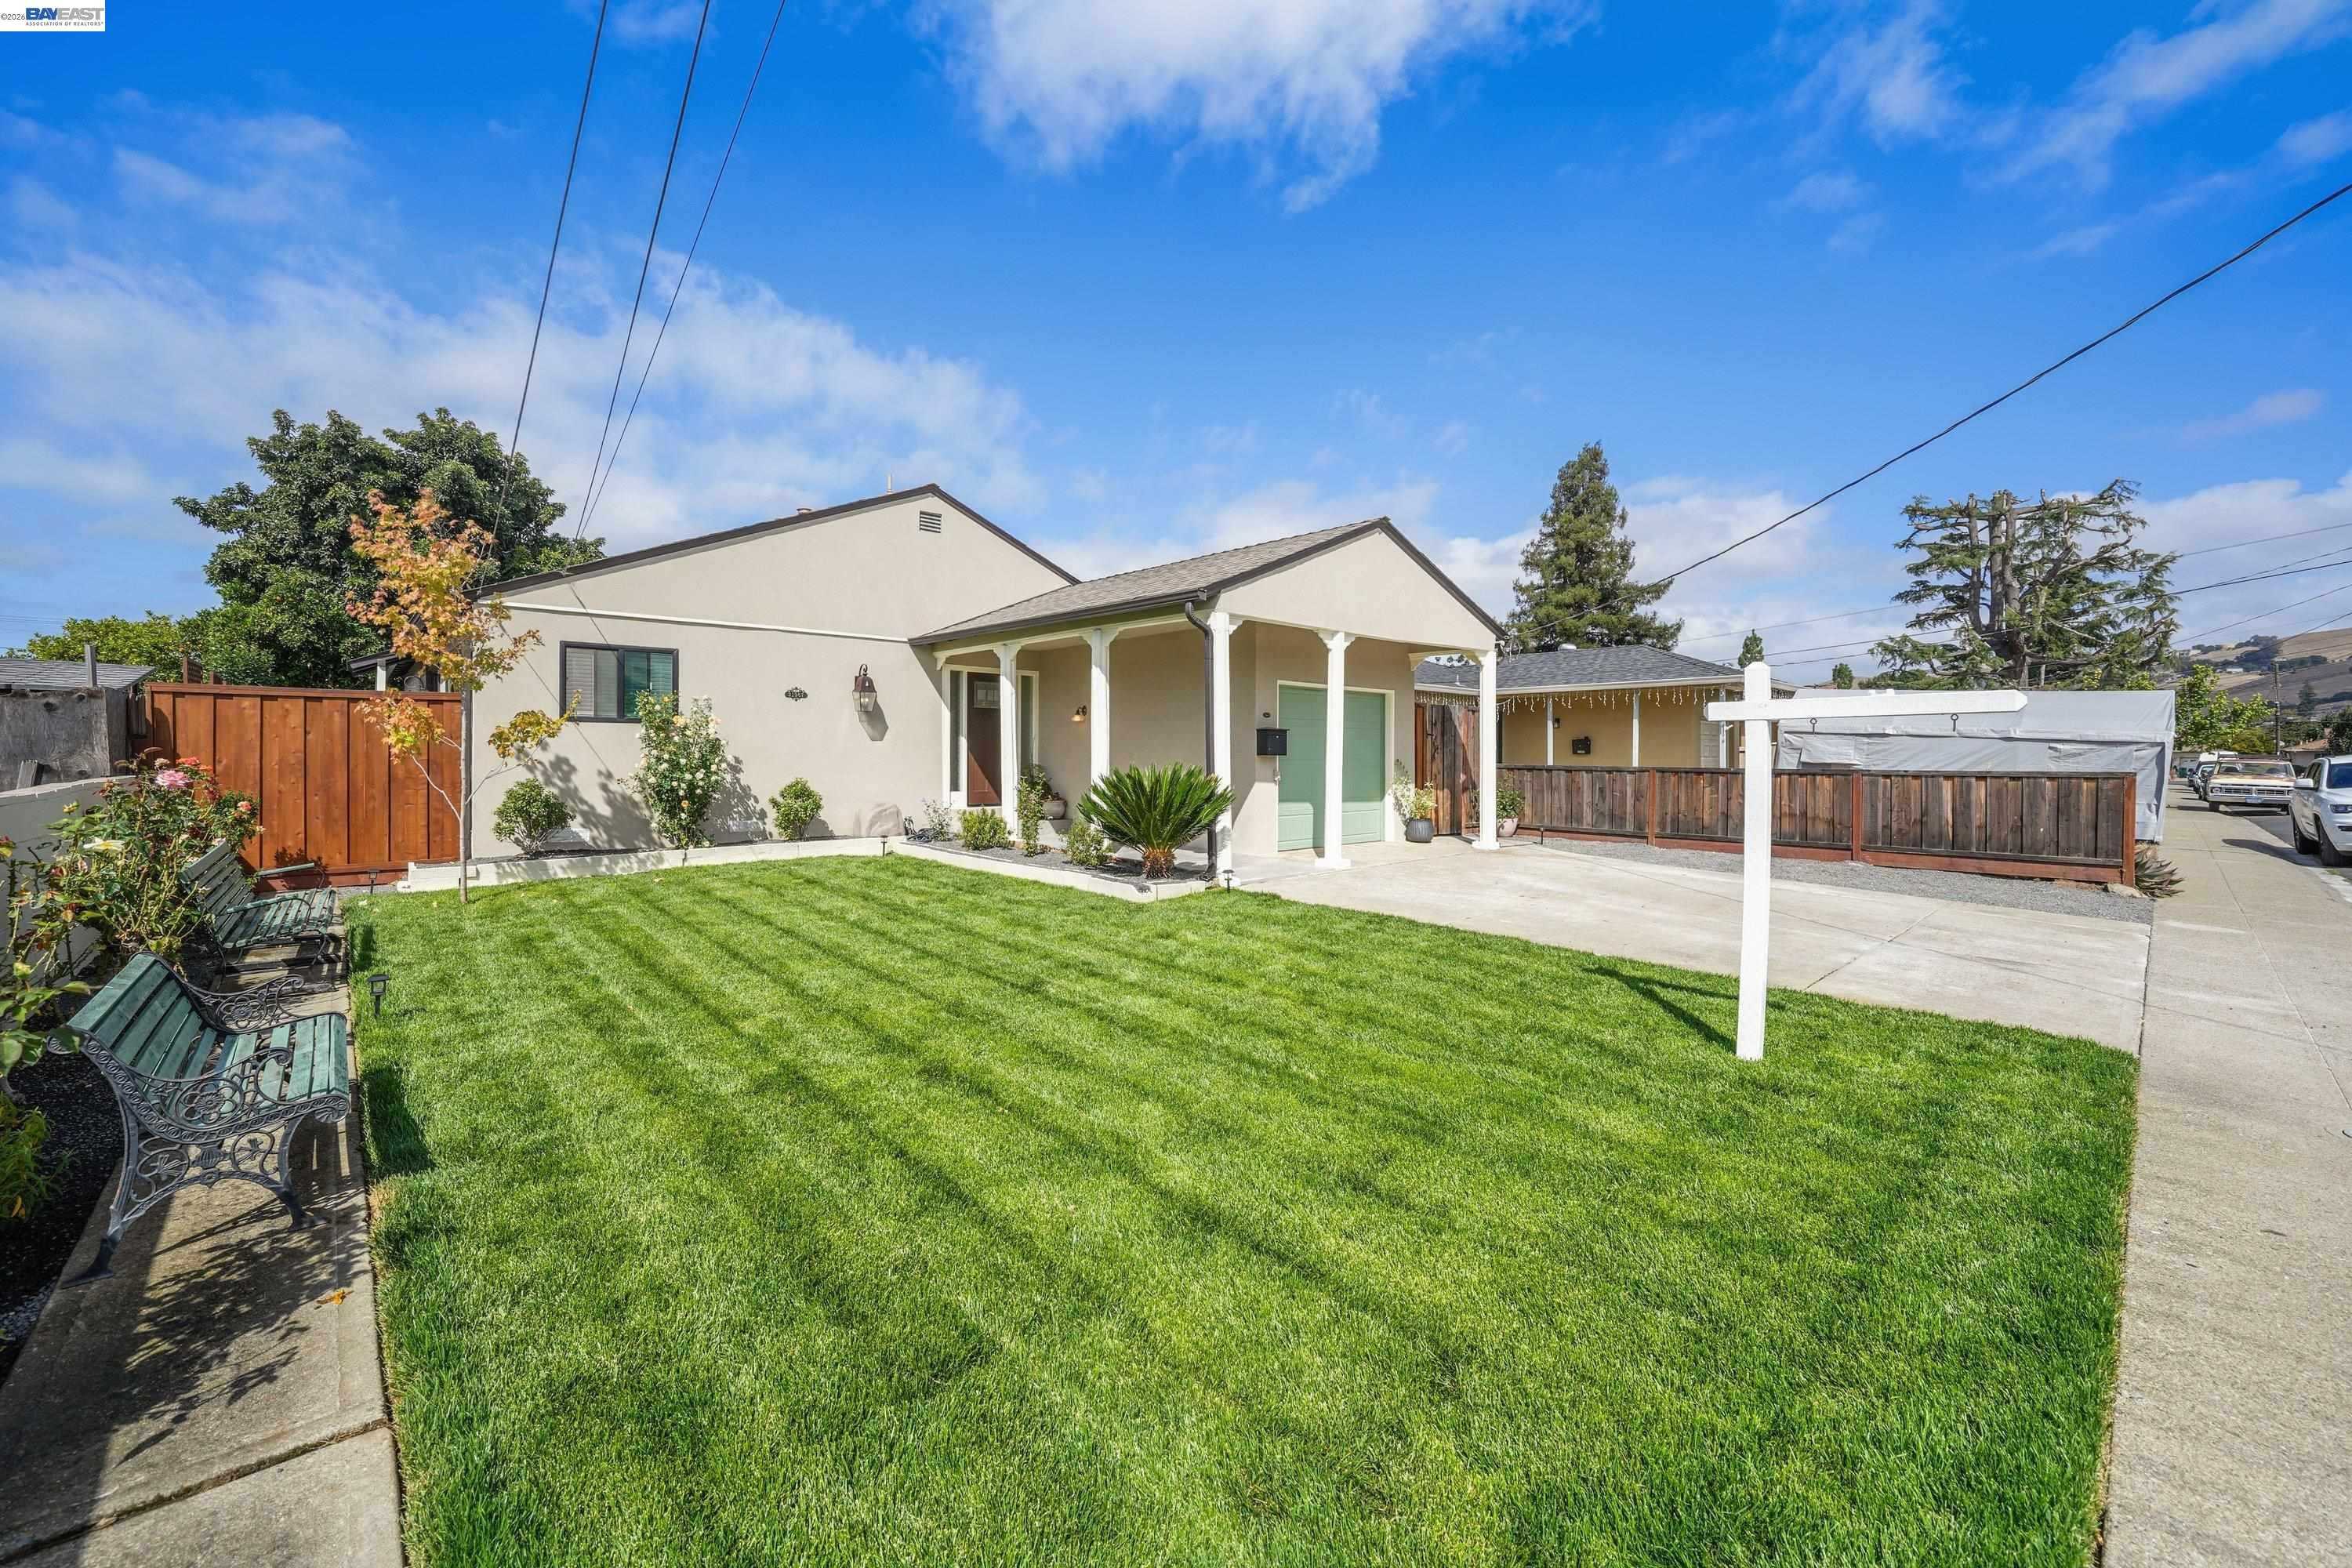
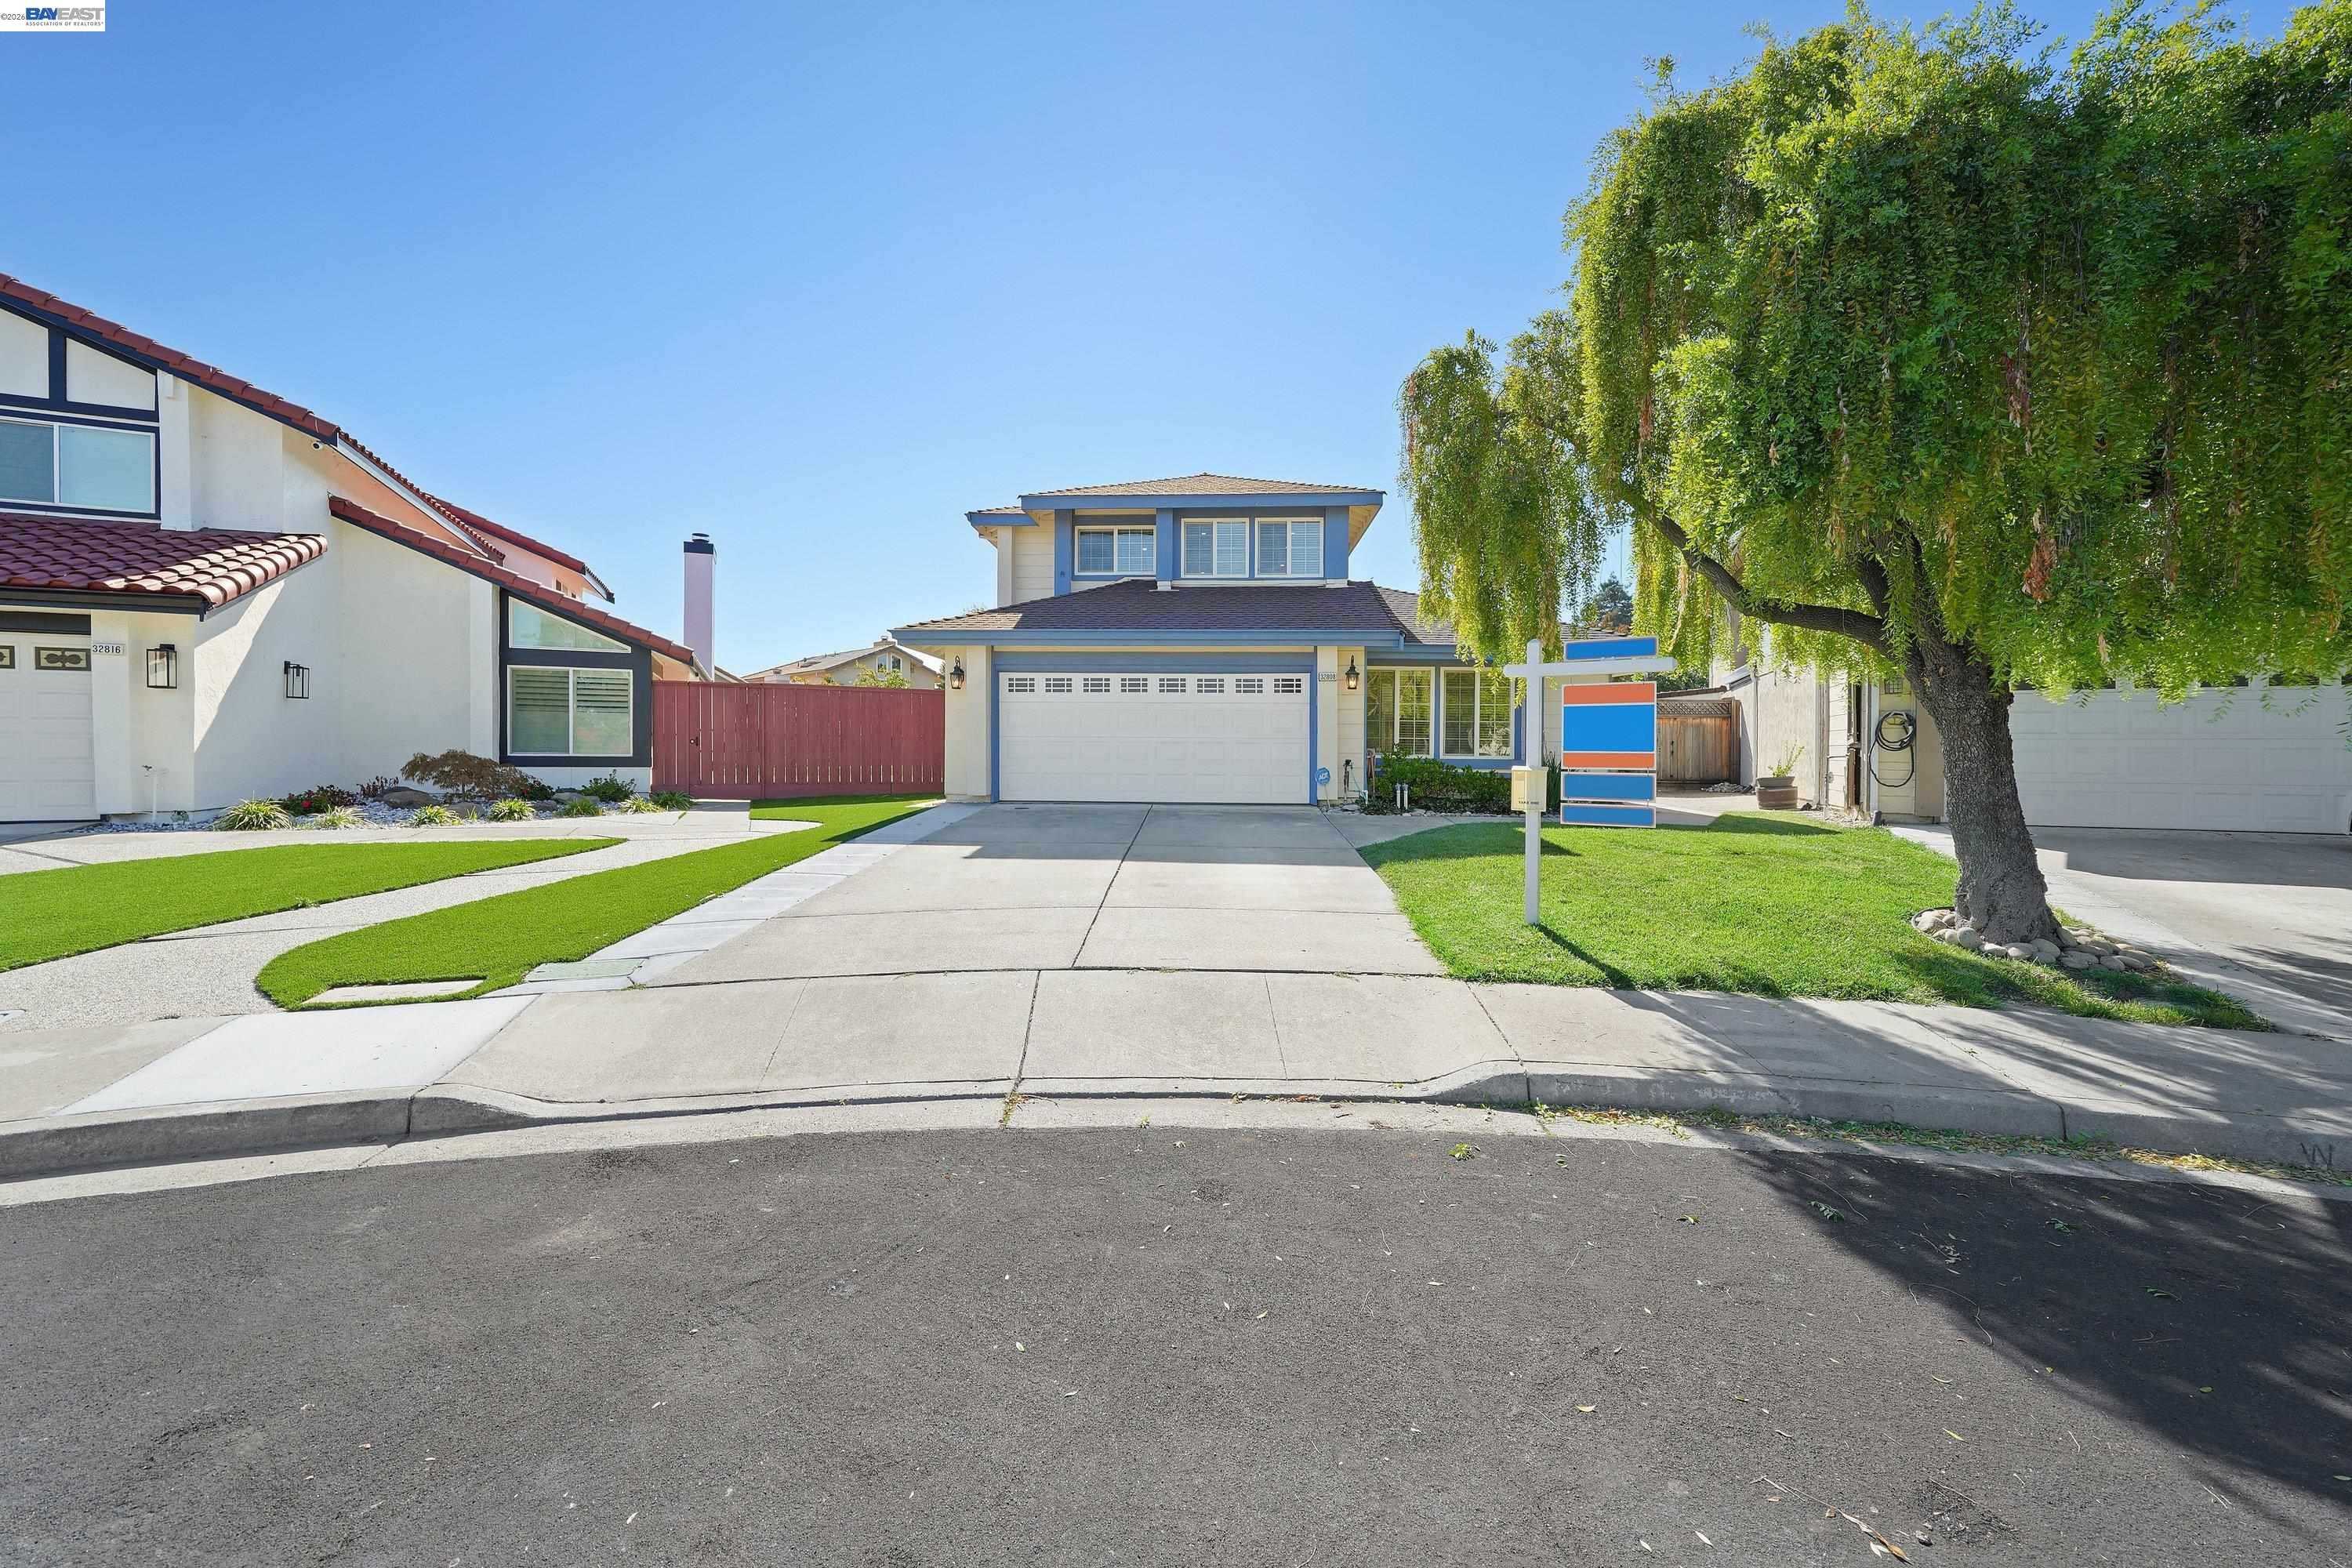
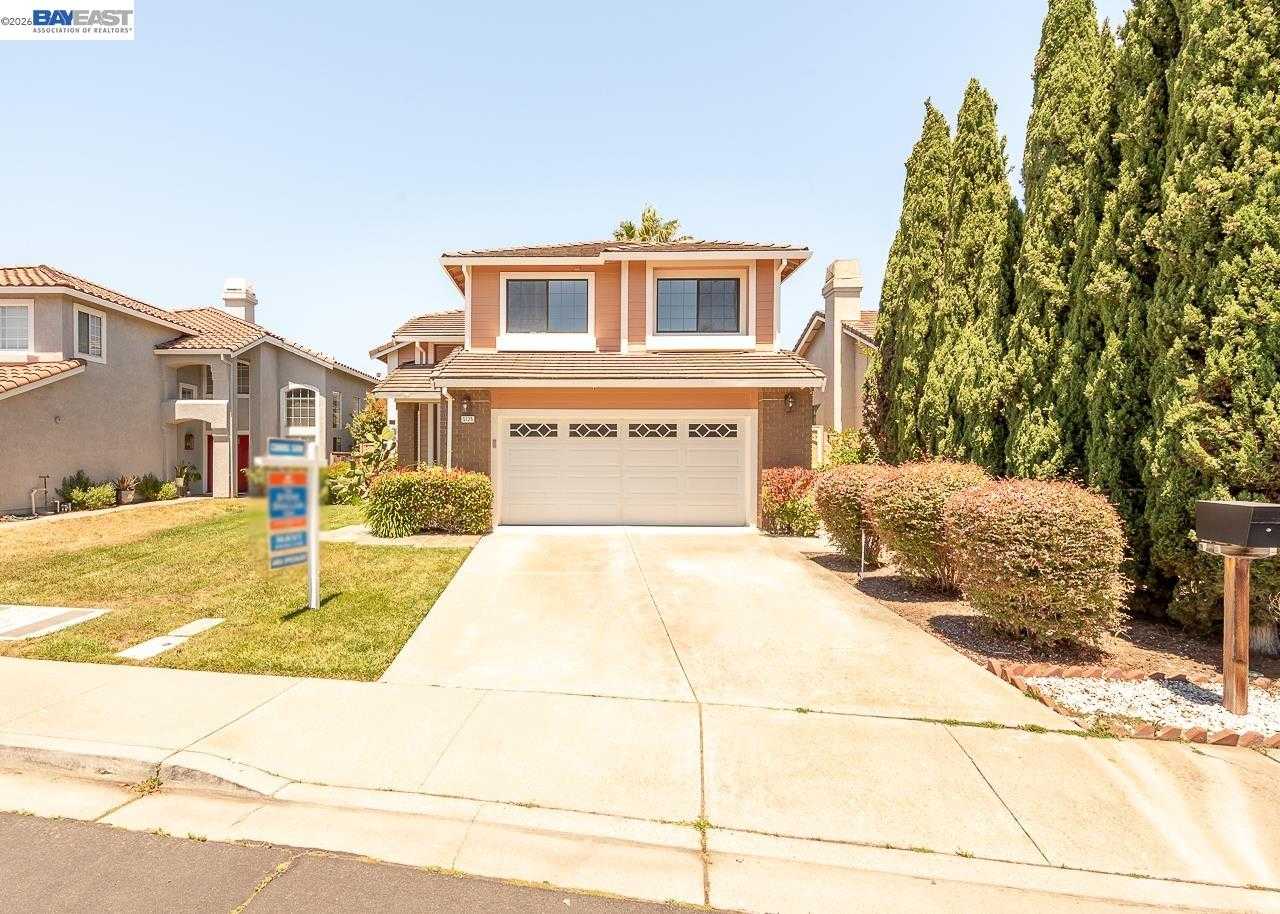
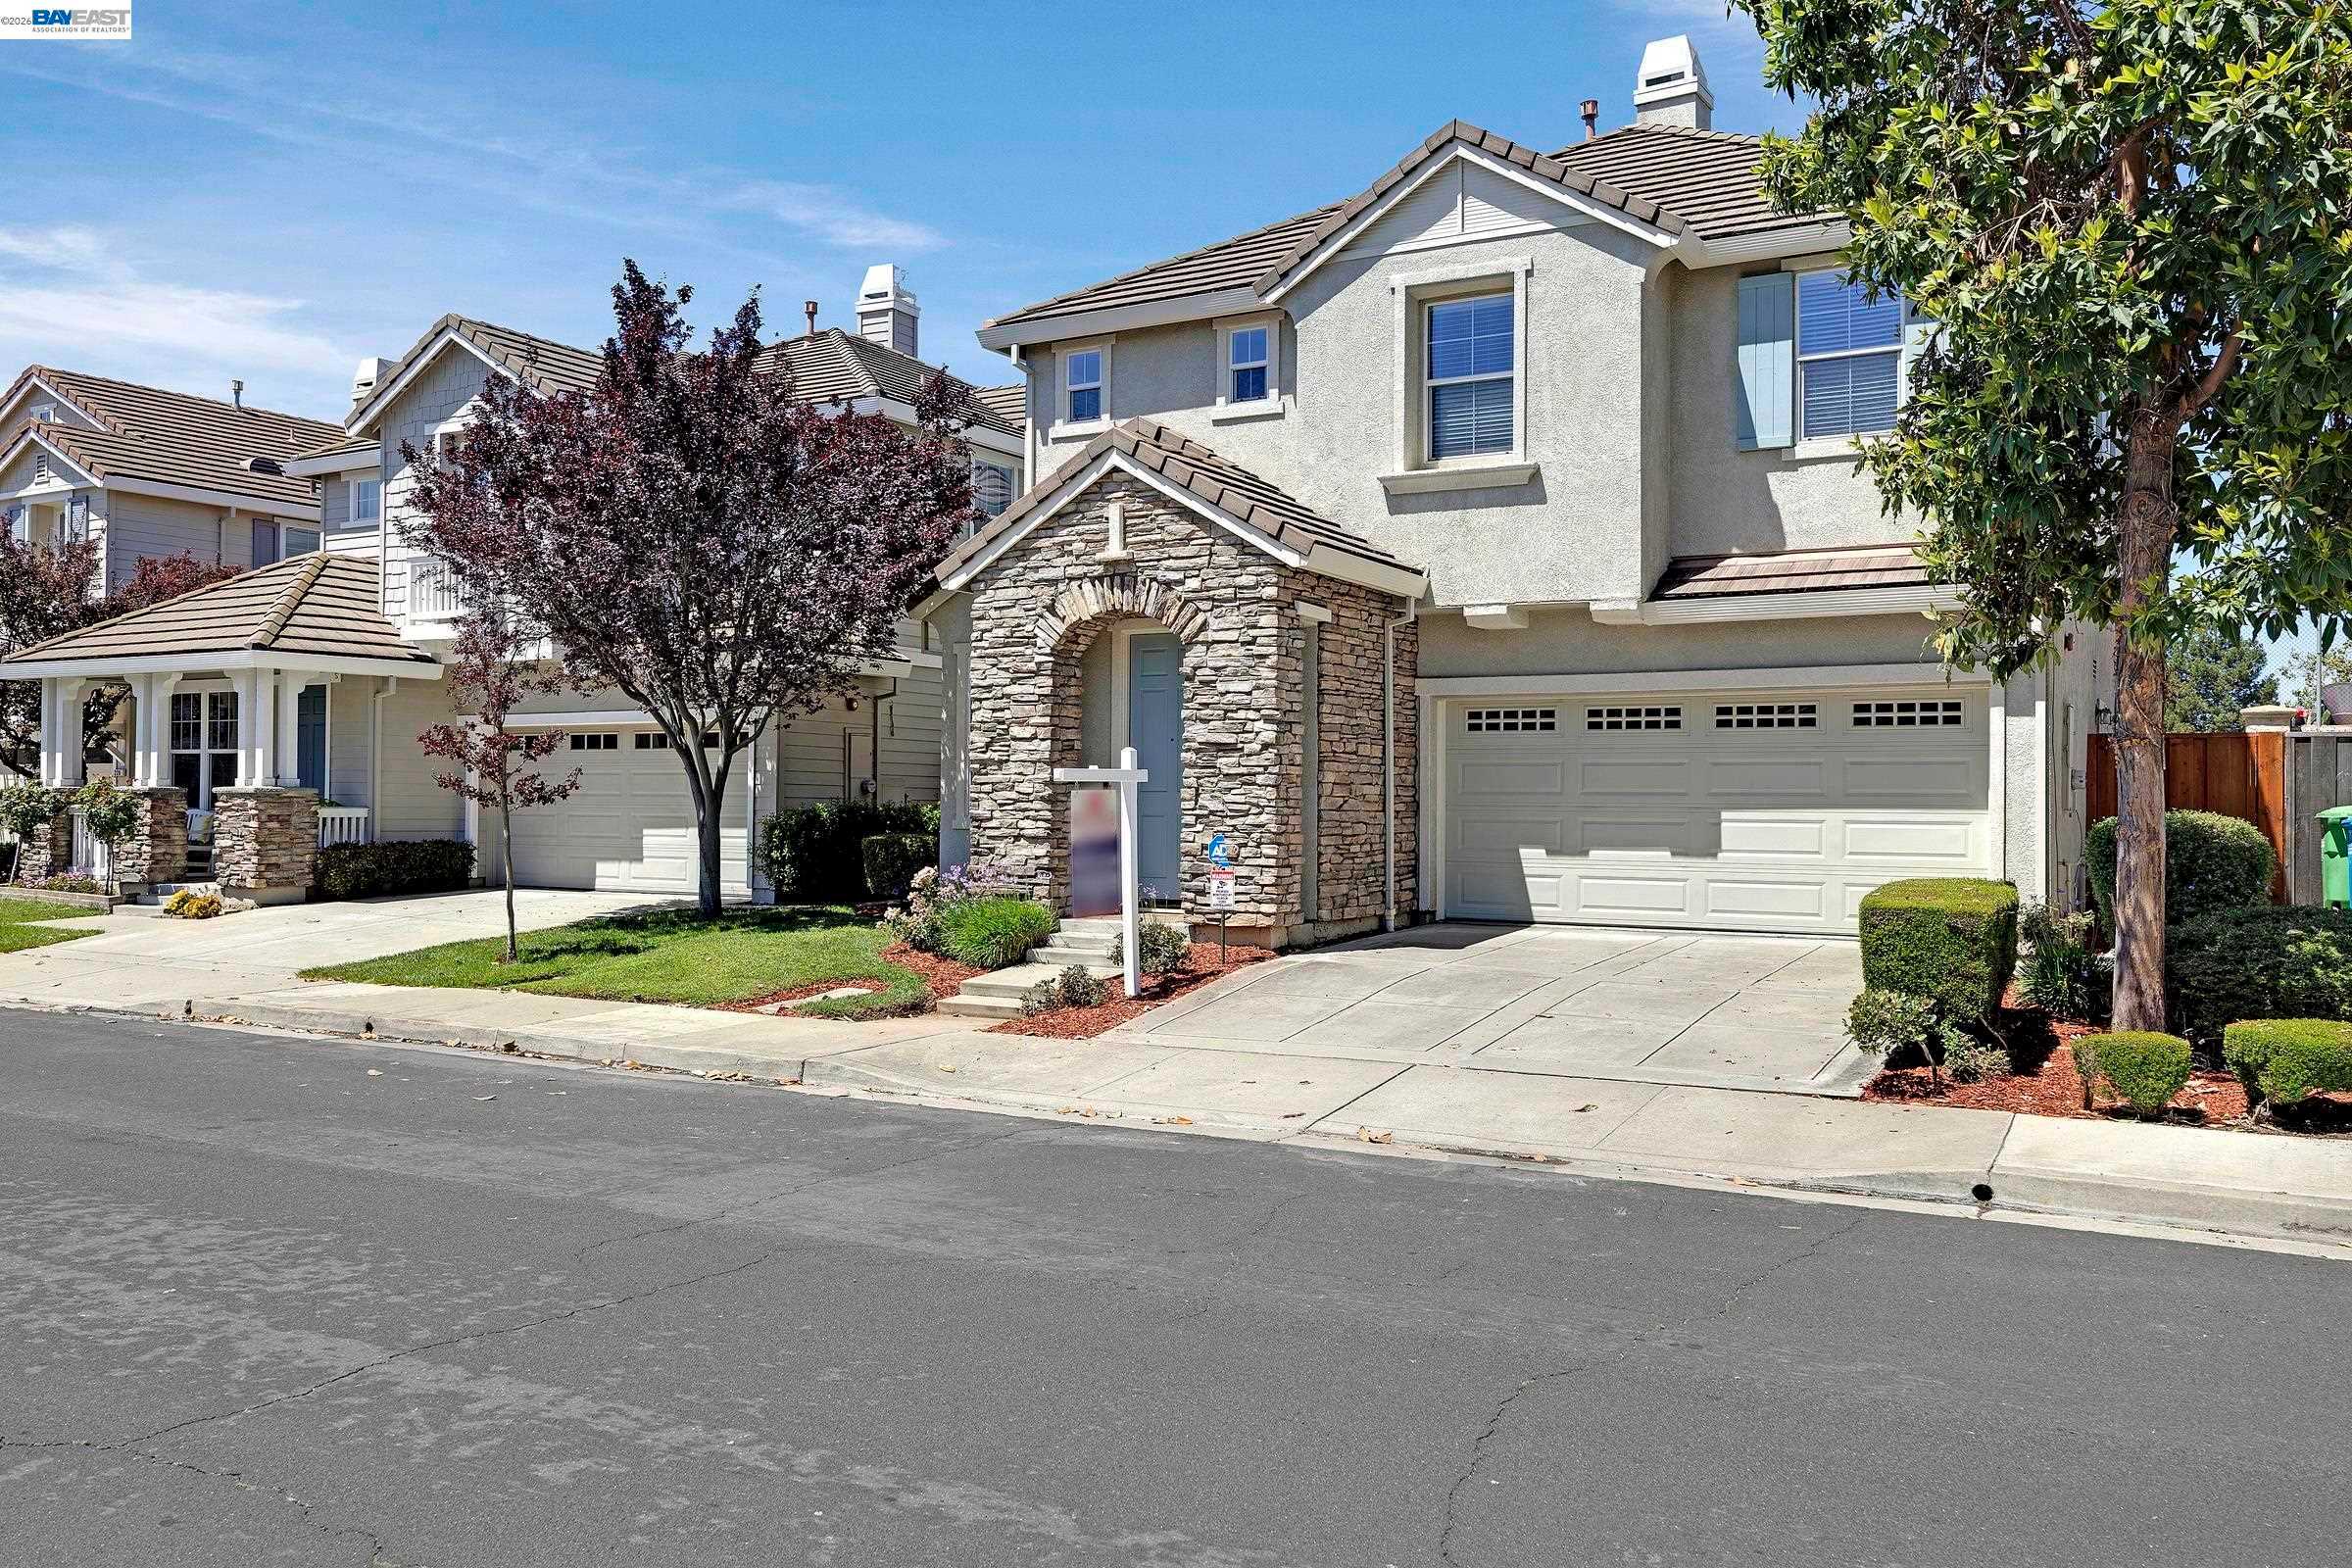
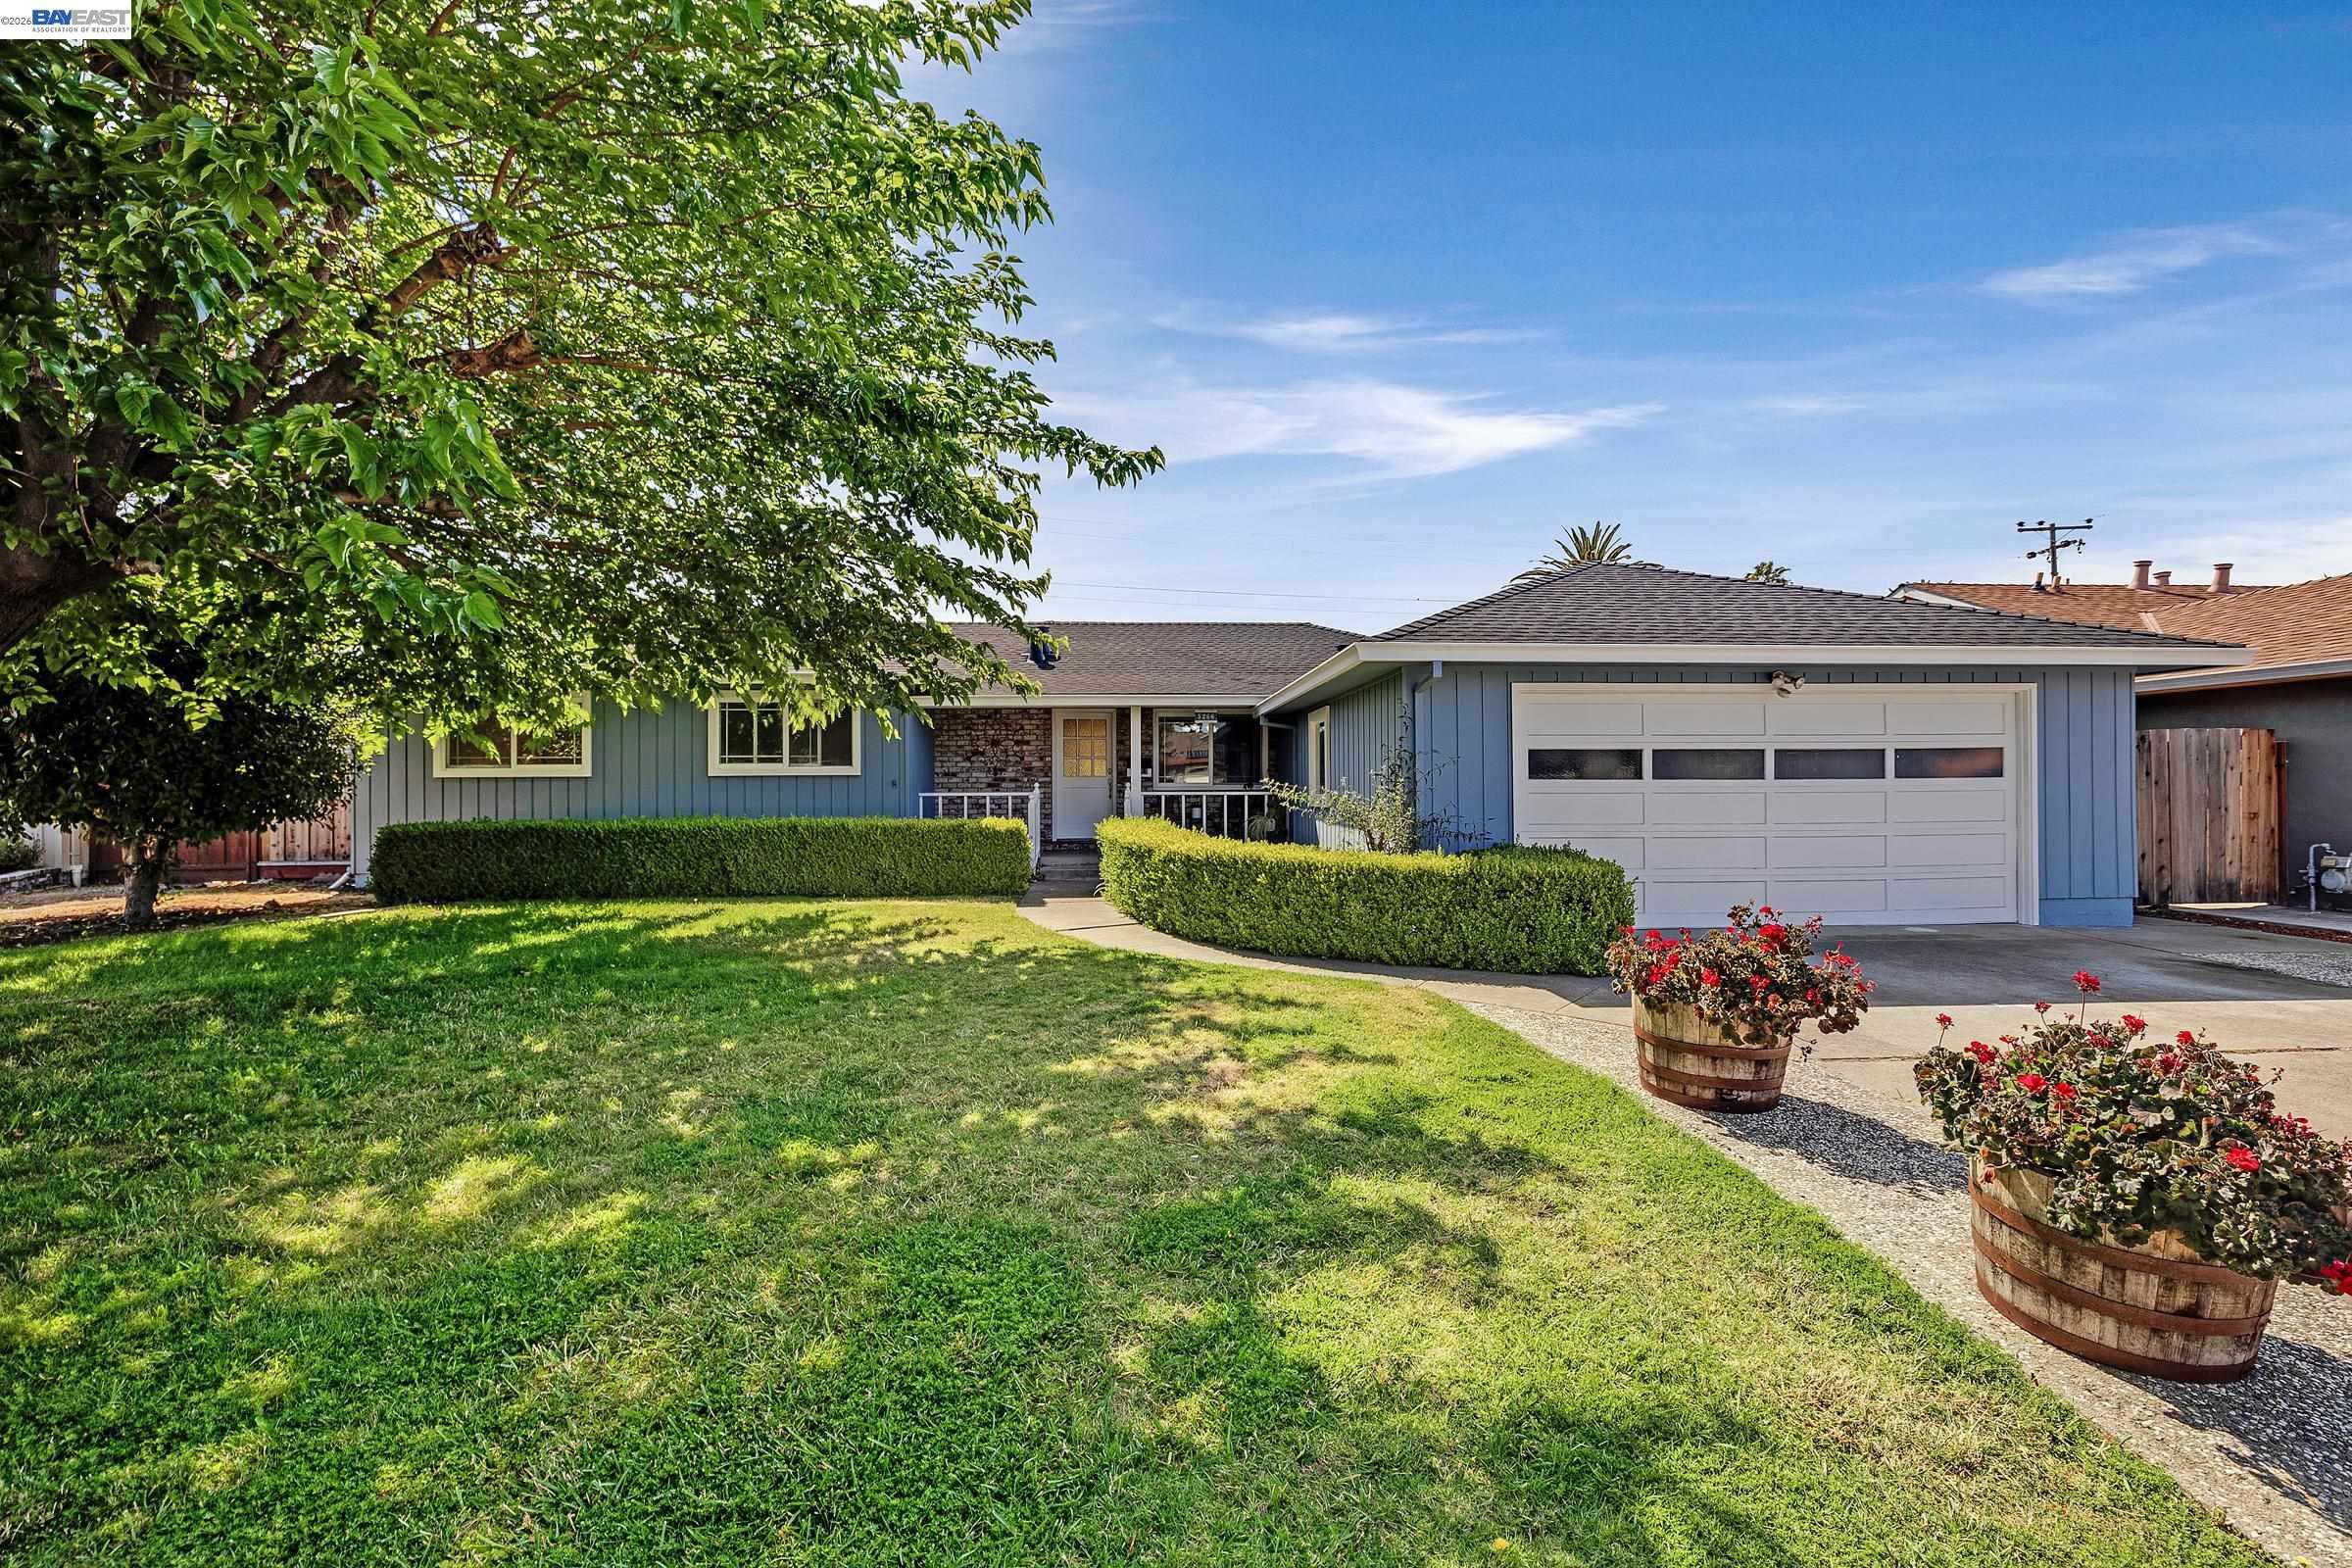
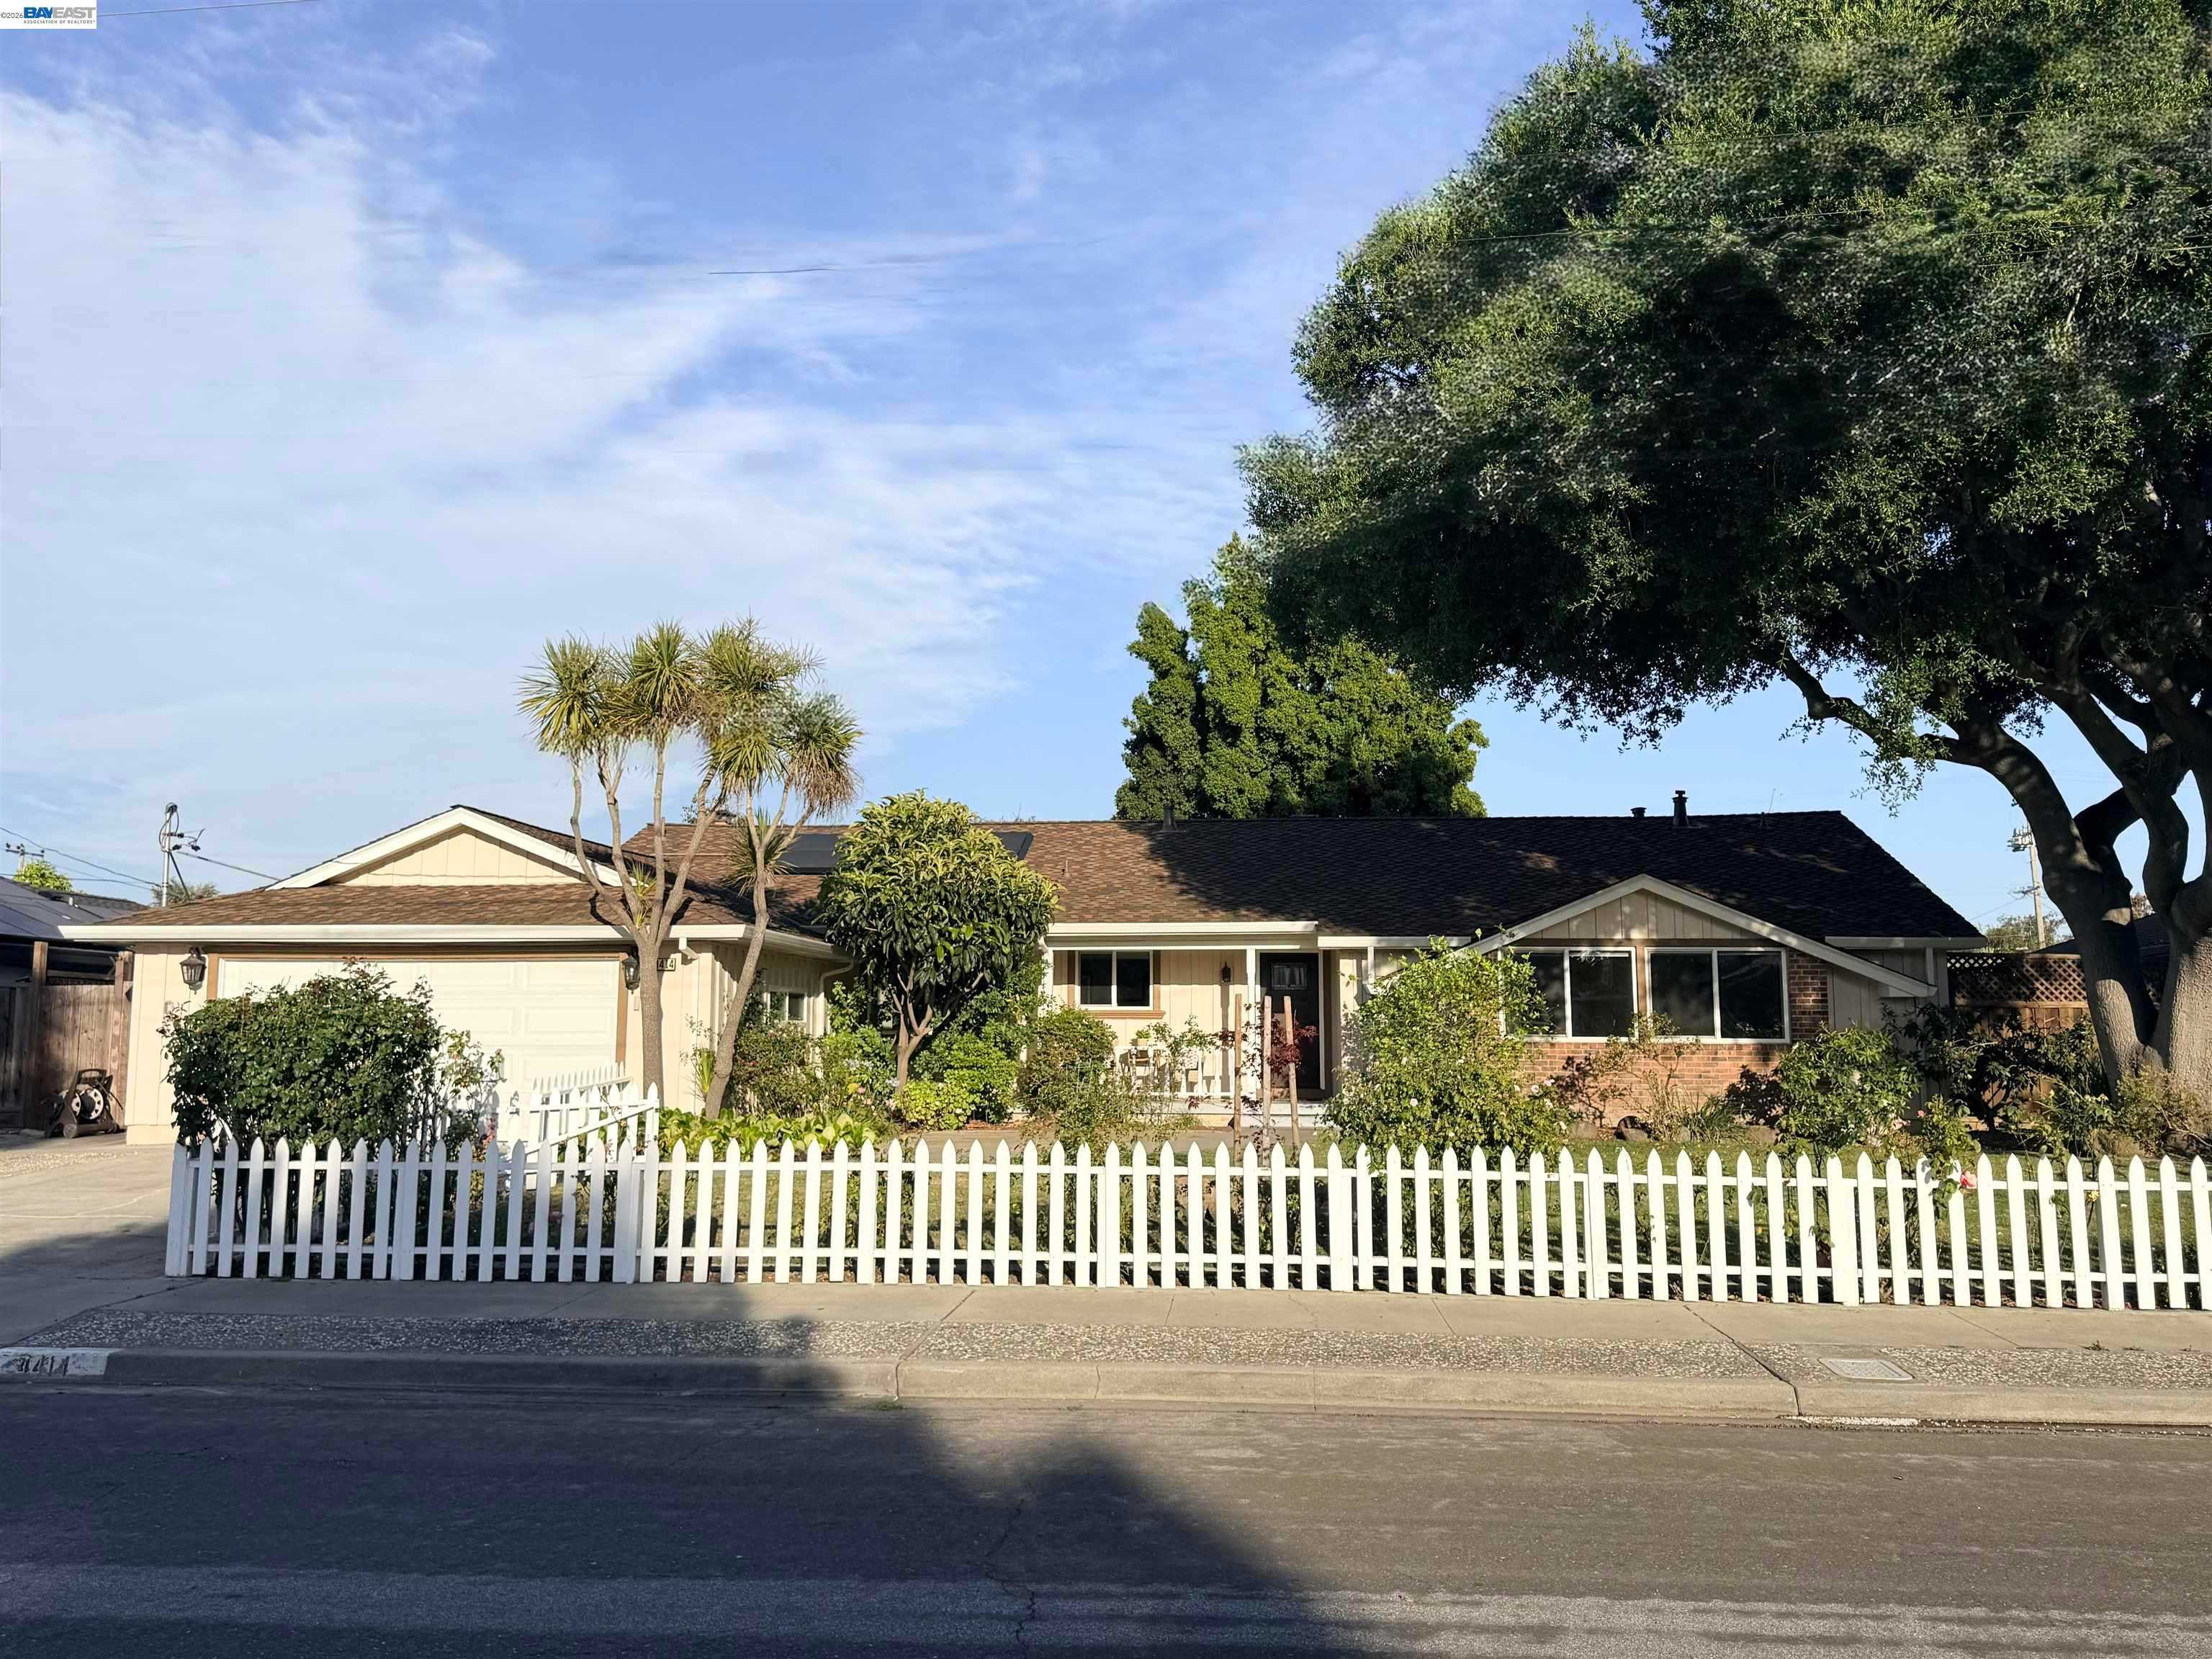
Behind these county totals: hundreds of homes still for sale in Fremont, Hayward, Union City, Newark and Milpitas, one live ledger with prices, sizes and a market read, refreshed each morning from the same MLS export.
30-Year Fixed: 6.76% ▲ 0.02% | 15-Year Fixed: 6.27% ▲ 0.02%
Rates gave back a little. The 30-year fixed rose 2 basis points to 6.76% and the 15-year added 2 to 6.27%, undoing part of Friday’s drop as oil pushed the 10-Year up.
Austin is the cautionary tale, and it is worth understanding precisely. Roughly 79% of homes bought there in 2022 are now worth less than what the buyer paid, meaning those owners are underwater: they owe more than the house would sell for. The cause was not a collapse in demand. Builders flooded the market with new homes at the same moment mortgage rates spiked, so supply arrived exactly when buying power left.
Yesterday we covered Redfin’s finding that homes now sell below asking in 38 of the 50 biggest metros, and Austin is what that looks like taken to its conclusion. It is also the clearest argument for why the Bay Area behaves differently. Austin’s problem was too much new construction meeting a rate shock. We never got the construction. The same rate shock hit here and inventory simply froze instead, which is why our prices held while theirs fell.
The remodeling number is the one to actually use this week. California, Texas, and Florida together account for more than 20% of all U.S. remodeling activity. When people cannot afford to move, because selling means giving up a 3% mortgage for a 6.76% one, they renovate instead. That is the lock-in effect showing up as construction permits rather than listings, and it tells you where your seller’s money is going while they wait.
Why a REALTOR® cares: there is a listing conversation in that remodeling figure. A homeowner spending $80,000 on a kitchen because moving feels impossible is a client who has already decided they want something different from their house. They are worth a real conversation about what a move would actually cost, because many of them have never run the numbers and are guessing at the trade.
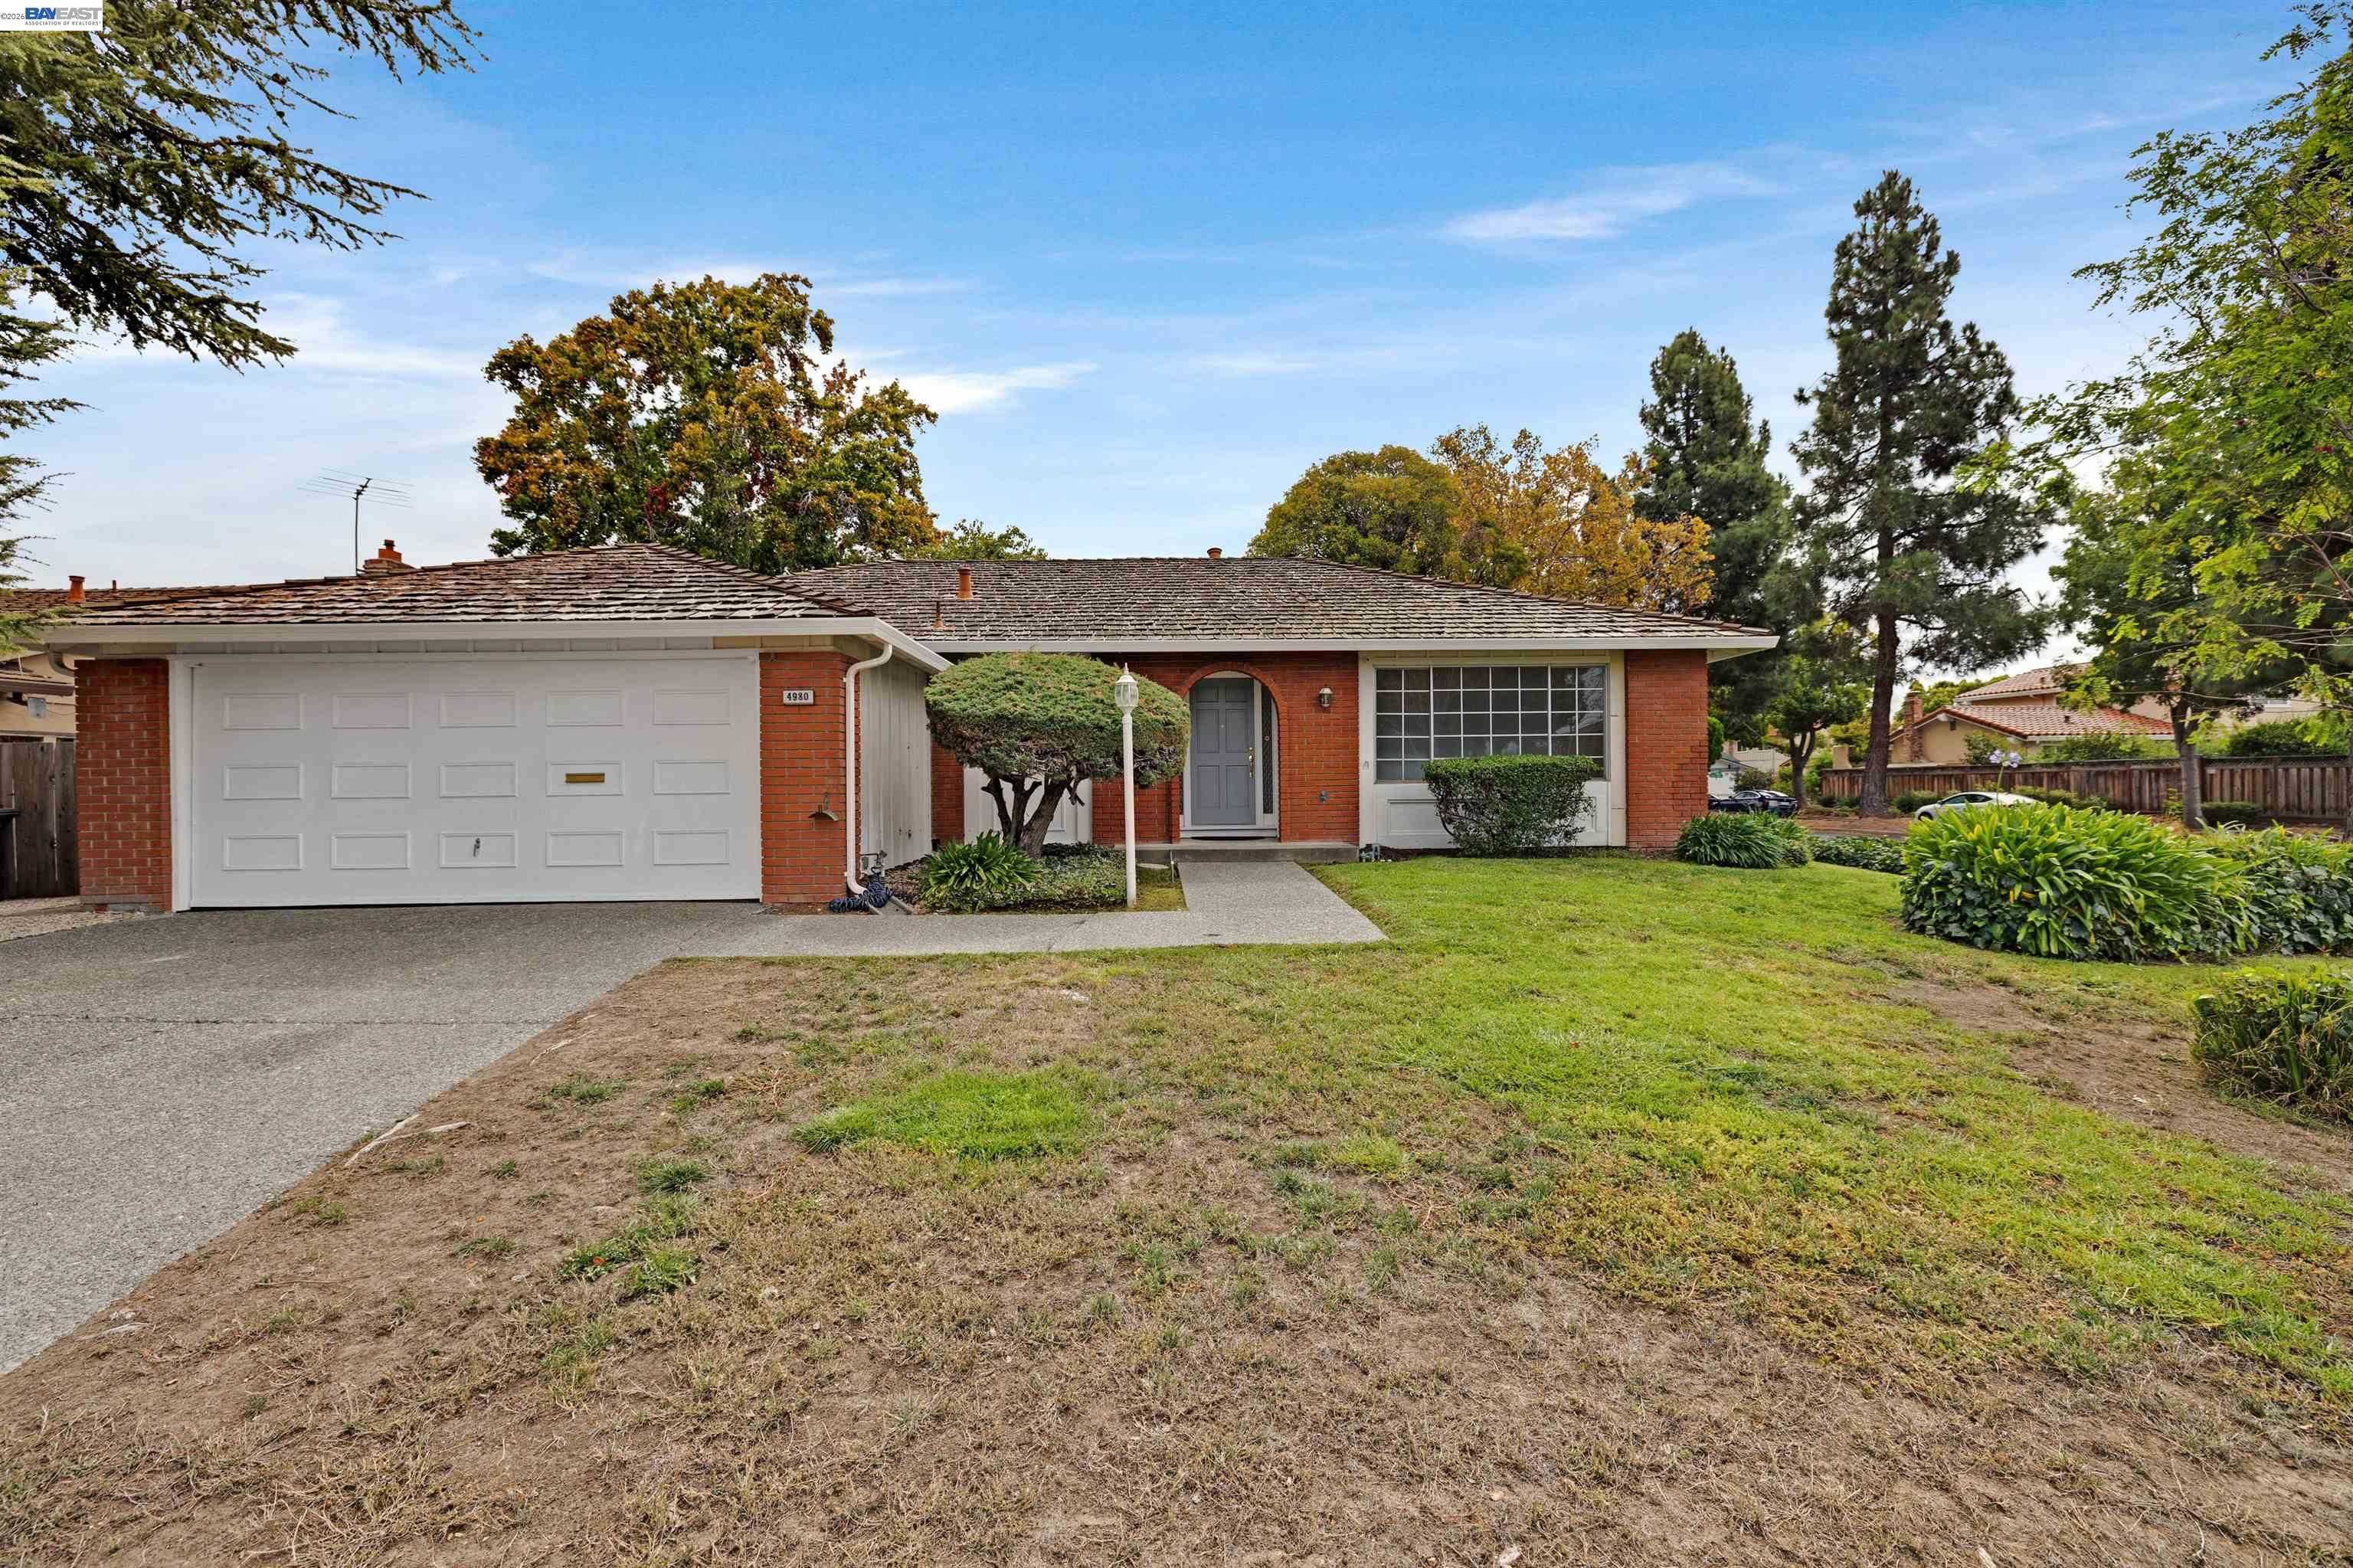
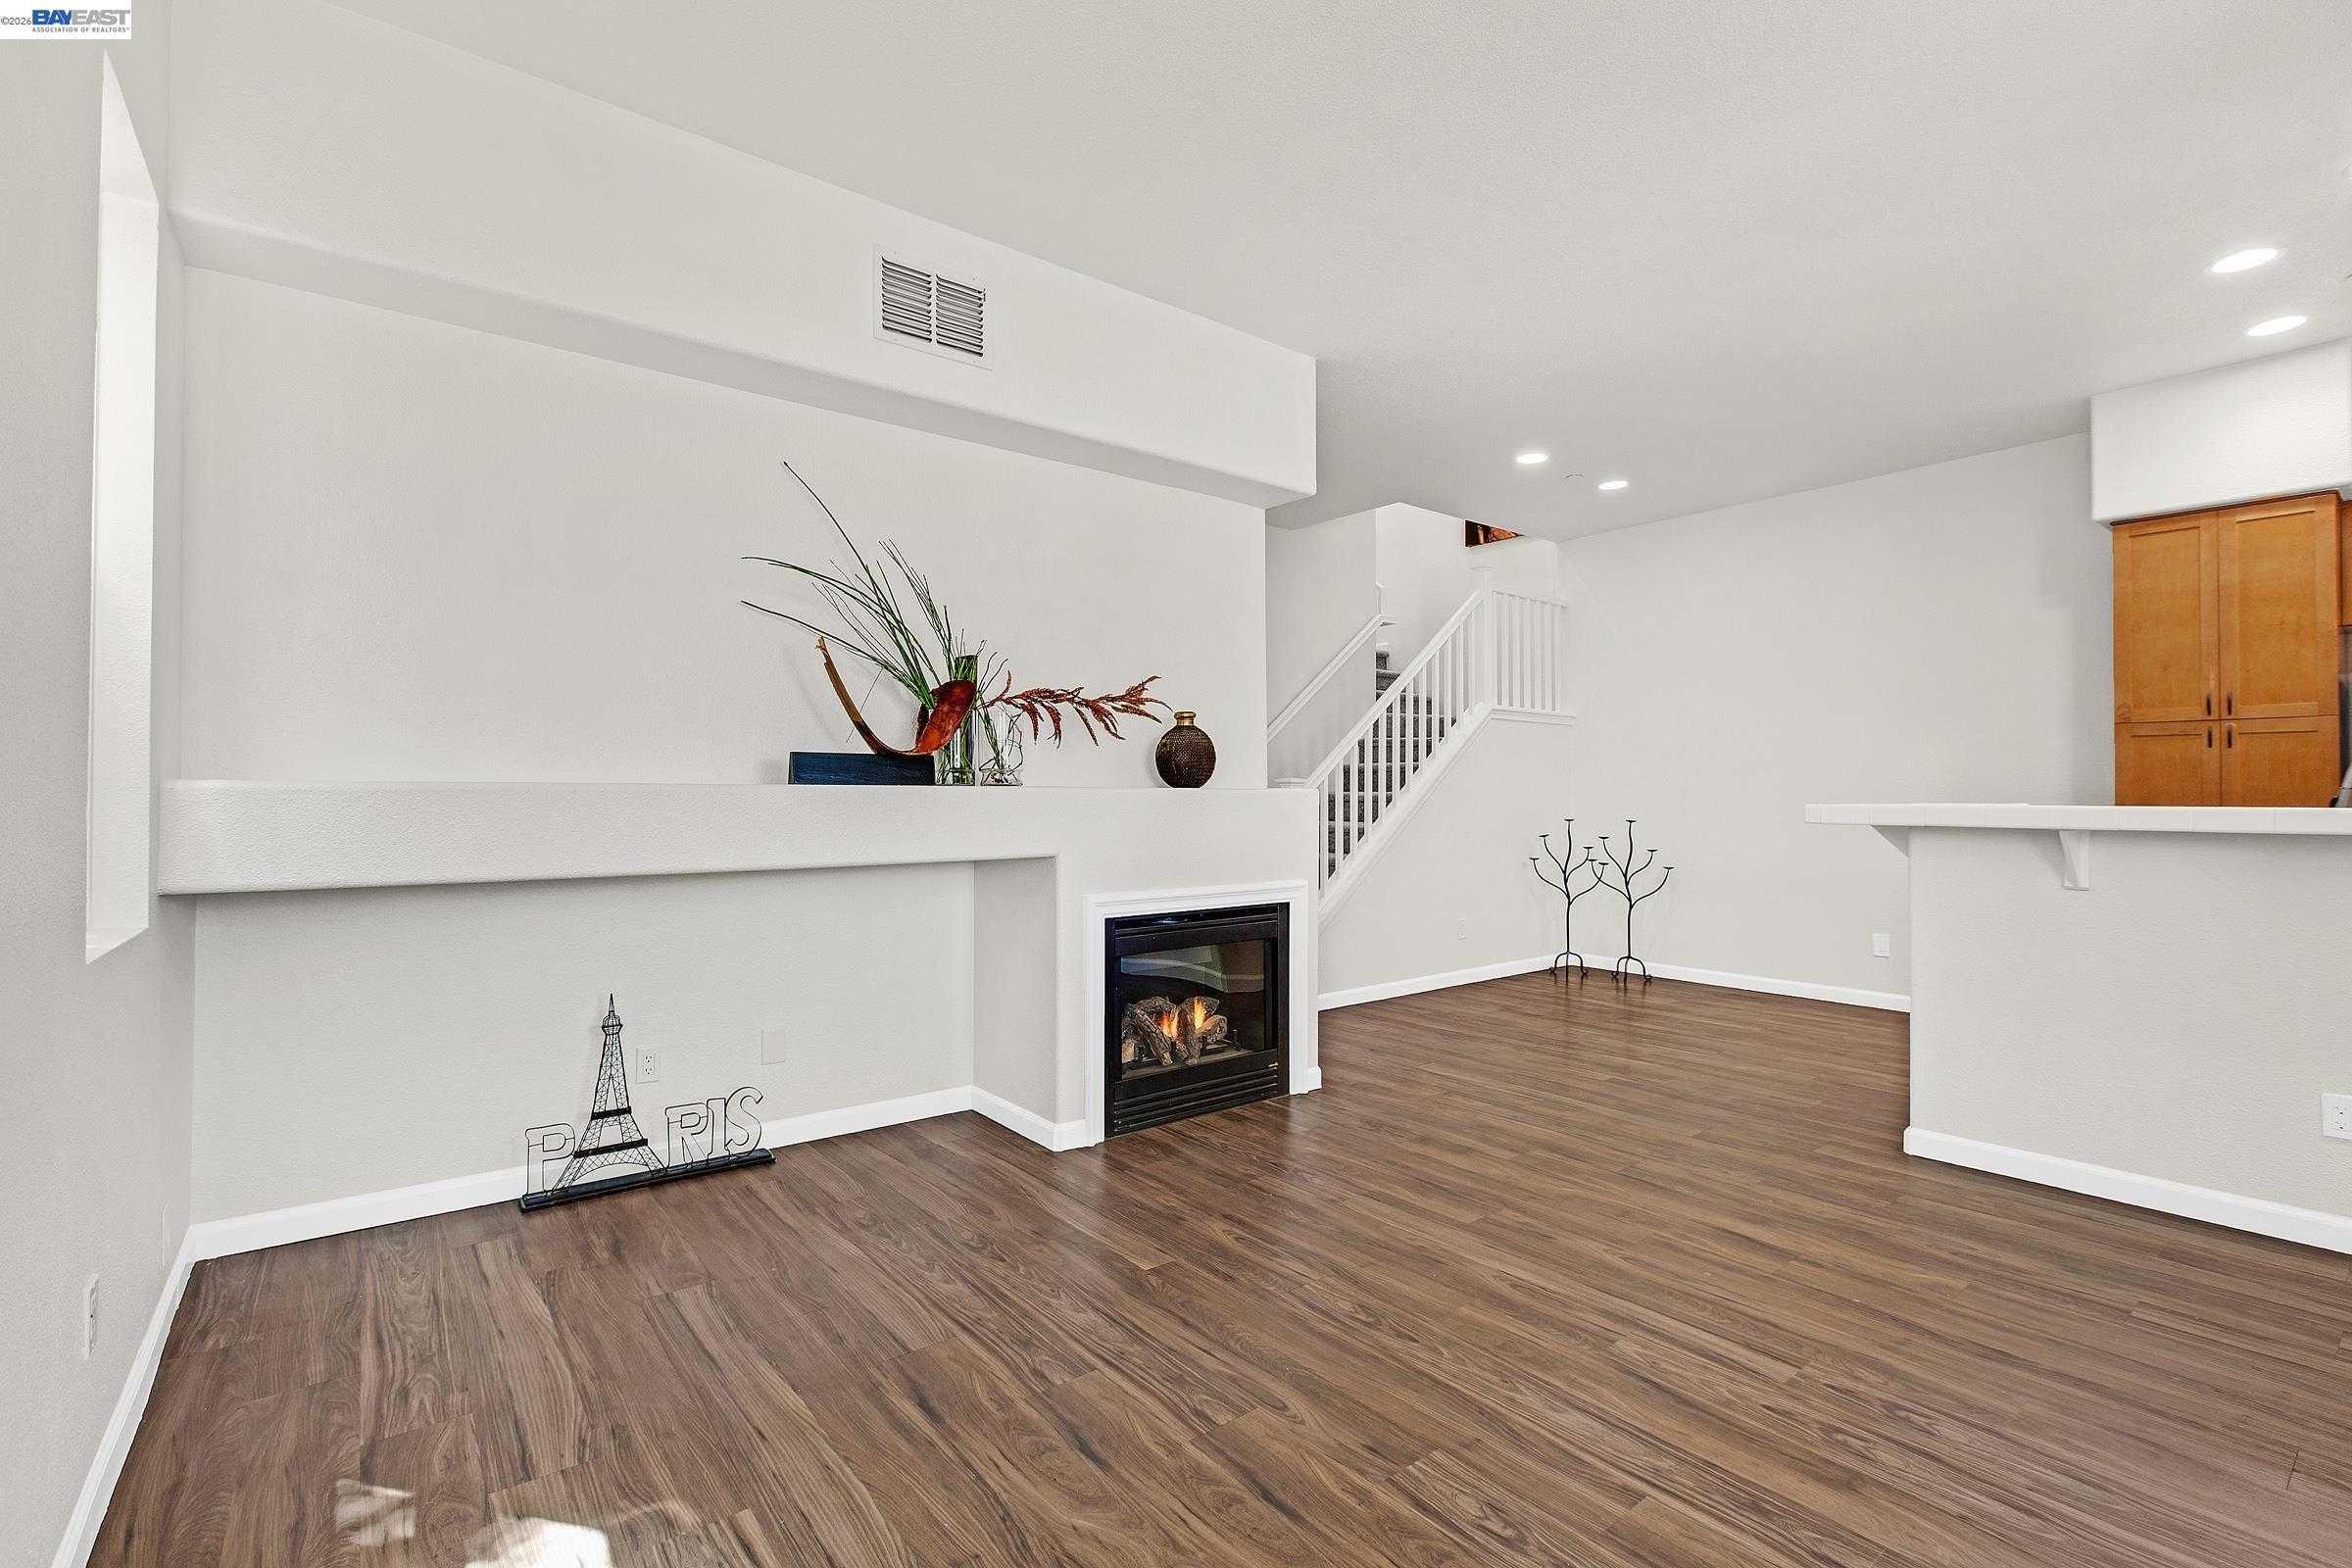
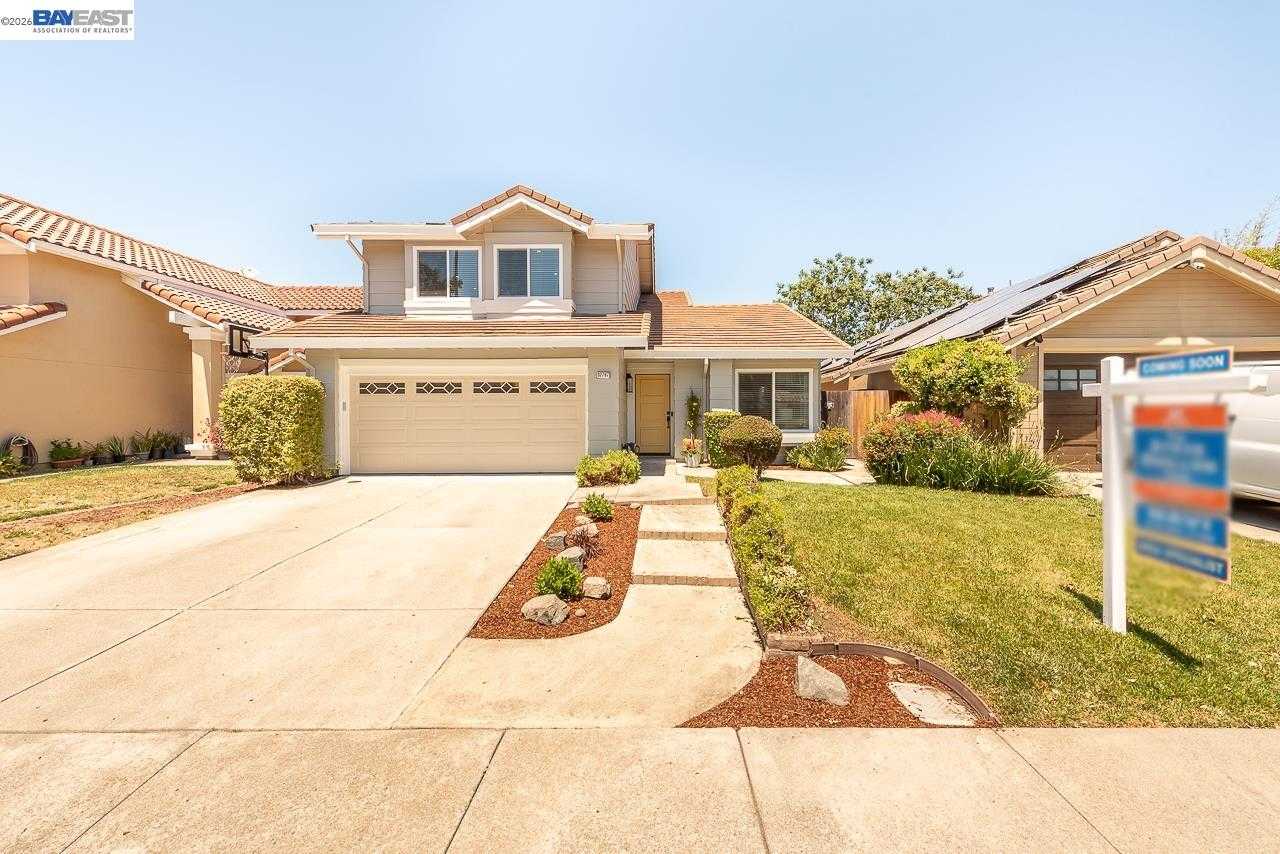
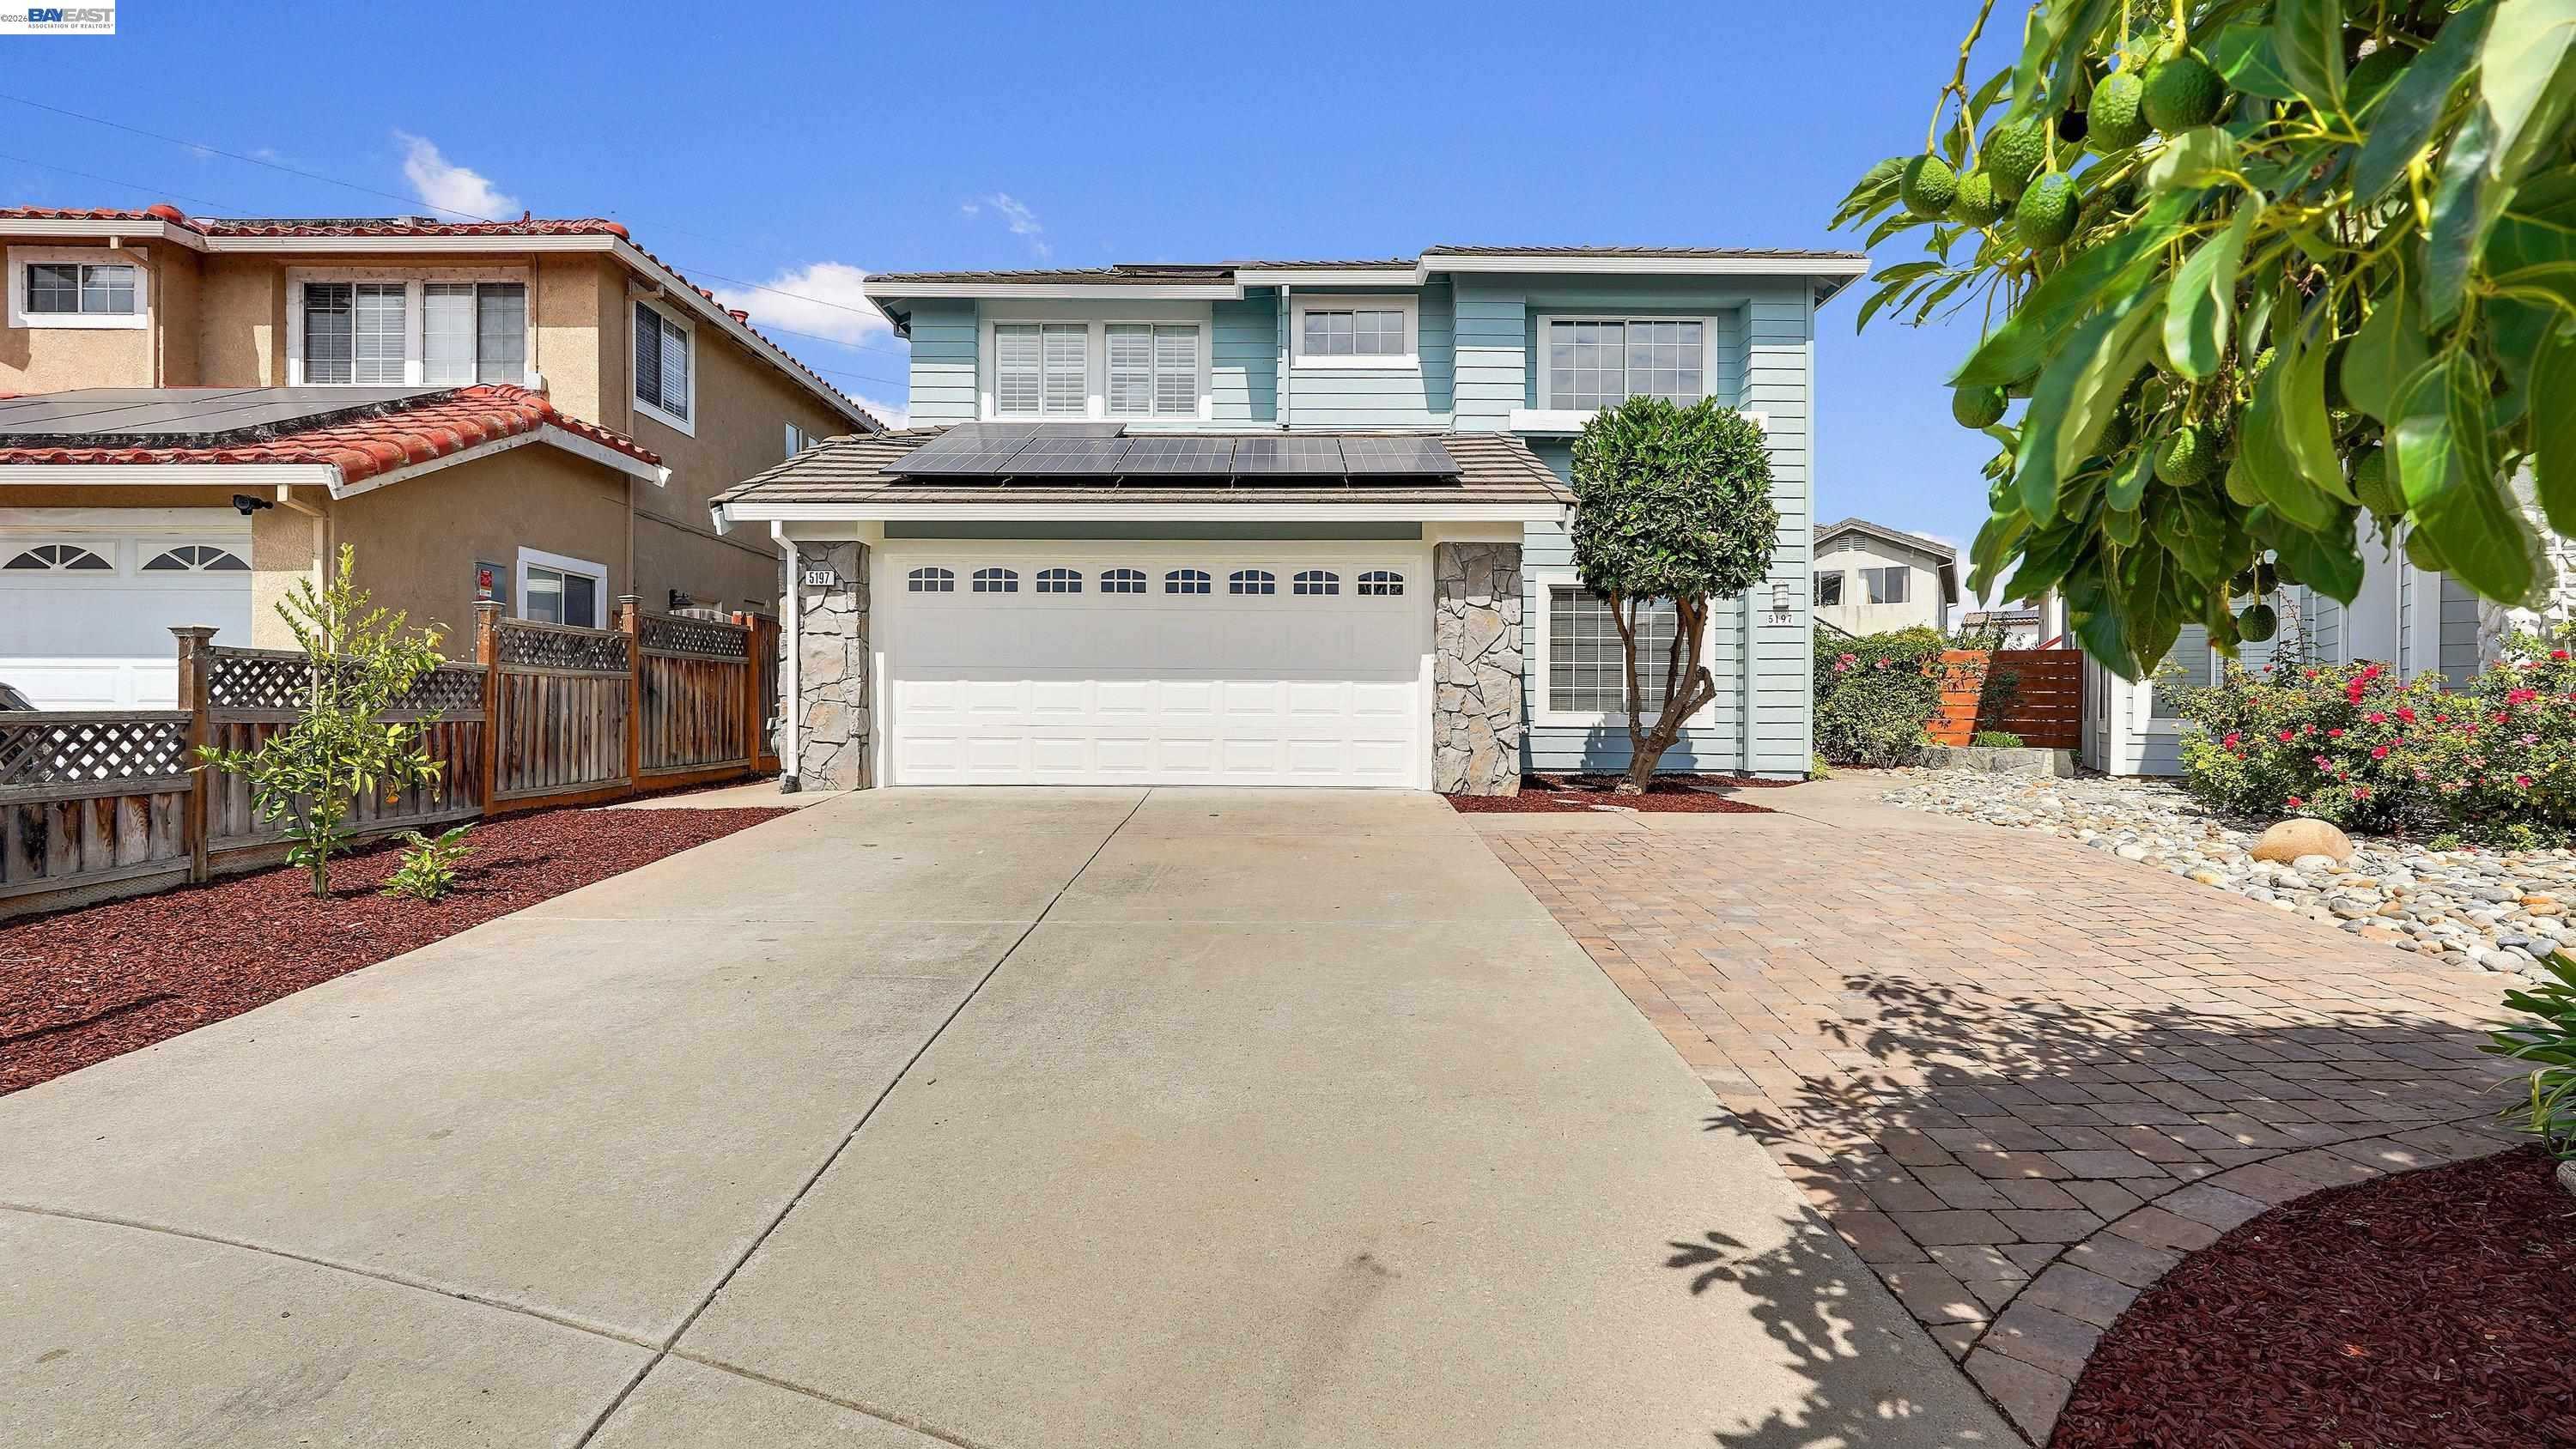
Today’s live board across our five focus cities shows 702 homes a buyer can actually pursue right now, down 13 from yesterday, including 51 brand new listings and 110 more coming soon. The full, always-updating ledger lives at harvrealtor.net/live-inventory.
Today’s Live Inventory (buyable now)
- Fremont: 272 available (199 active, 18 new, 55 coming soon)
- Hayward: 198 available
- Milpitas: 106 available
- Newark: 79 available
- Union City: 47 available
Median asking prices: Union City at $1,298,888, Fremont at $1,288,384, Newark at $1,248,000, Milpitas at $1,150,000, and Hayward at $849,500. Median days on market runs from 22 in Newark to 35 in Hayward. Board-wide the 15-city table carries 2,672 listings, down 40 from yesterday.
Every city except Union City lost listings today, and Union City only held even. Fremont gave up 7, Hayward 3, Newark 2, Milpitas 1. The board-wide table dropped 40 in a single day, the largest one day decline we have printed in weeks, while the coming soon pipeline did not move at all, holding at 110 with Fremont carrying half of it at 55. Inventory is leaving the board faster than sellers are replacing it, and Newark is now the fastest market of the five at 22 days.
US 10-Year: 4.72% ▲ 0.07% | Gold: $4,375 ▲ 0.95% | Silver: $64.96 ▲ 1.62% | Brent: $87.72 ▲ 4.99%
Oil is the story, and it runs through everything else today. Brent settled at $87.72, up 4.99% in a single session, after the White House walked back talk of a deal with Iran and said it is only semi-negotiating. Crude is now well above $87 a barrel, and the reason is simply that the shipping route stays contested.
Which brings us to the chart. America’s emergency oil reserve has been drawn down to levels not seen since the Reagan administration. The Strategic Petroleum Reserve holds 304.8 million barrels as of the week ending July 31, down from a peak of 727 million in January 2010. That is 58% below the high, and the last time the reserve held this little was February 1983, when it was still being filled for the first time.
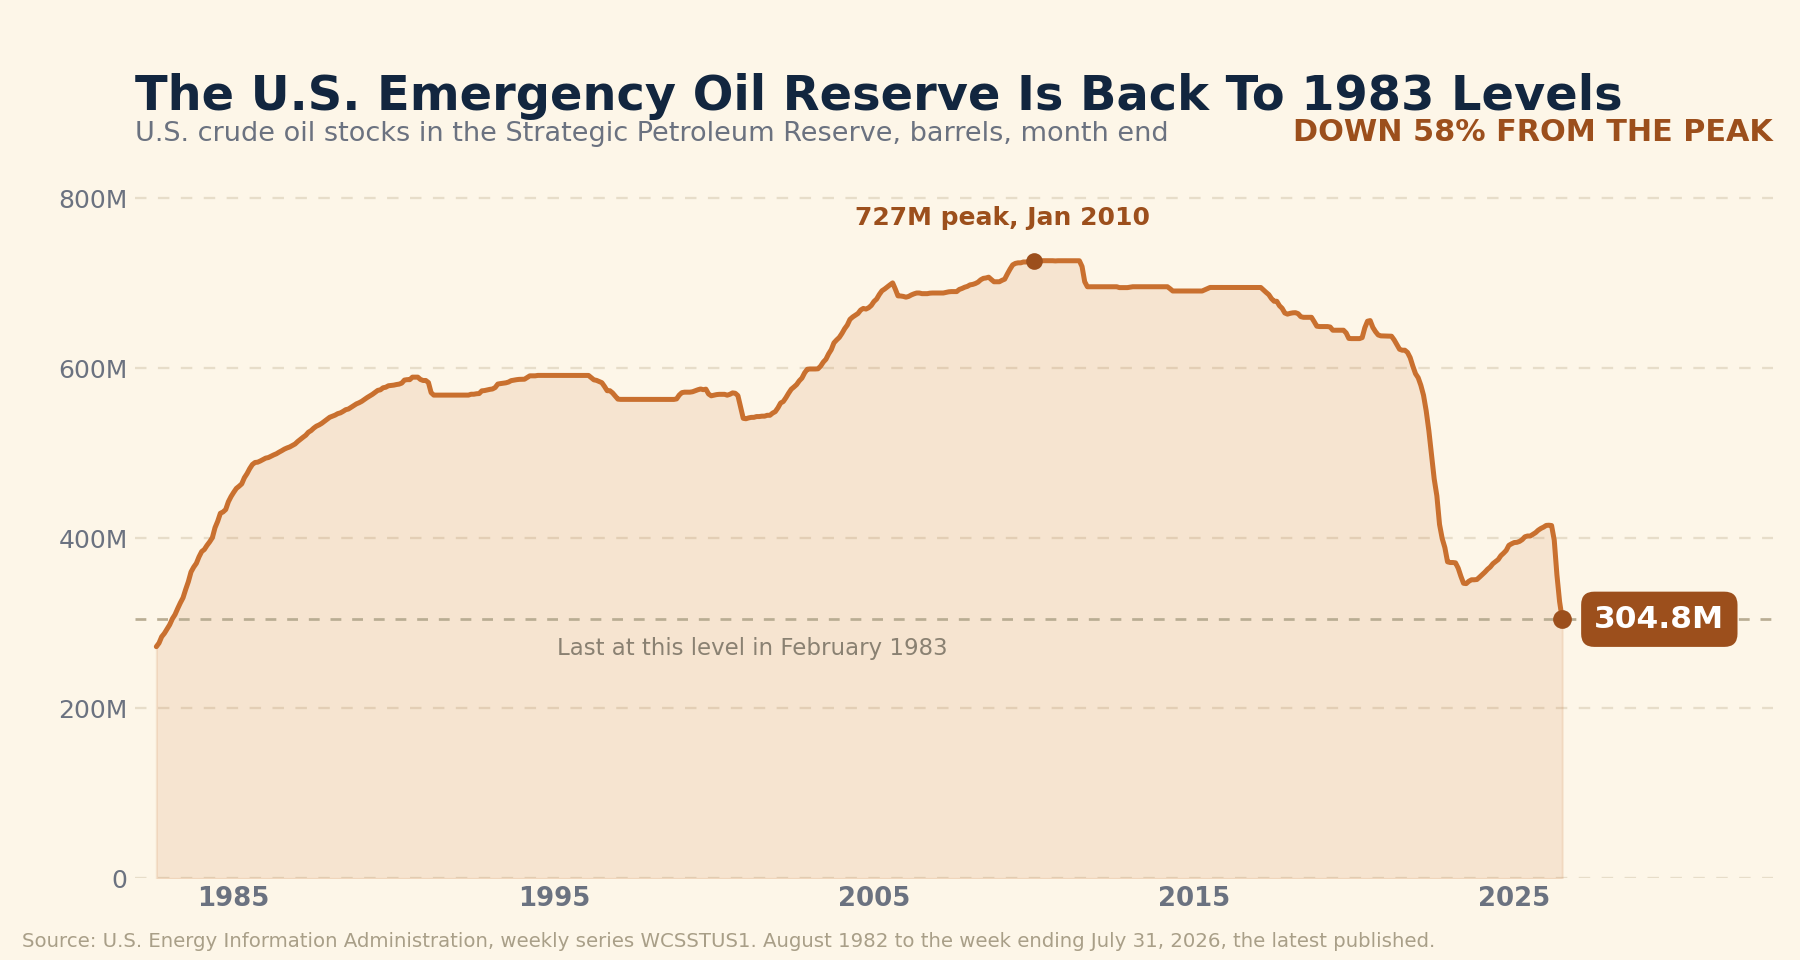
A note on that number. Several outlets are citing 298.7 million as of August 7. That week has not been published. EIA’s weekly series was last updated August 5 and its most recent figure is the 304.8 million for July 31; the August 7 week comes out August 12. We are reporting the last number EIA has actually released. The two checkable claims on the widely shared graphic did hold up: the 727 million peak is right, and the lowest since 1983 framing is true even using the published figure.
The 10-Year jumped to 4.72%, up 7 basis points and its highest of the month. This is the oil story arriving in the bond market: expensive crude feeds into everything that gets shipped or made, which looks like inflation, and inflation is what keeps the Fed from cutting. Metals climbed on the same anxiety, with gold up 0.95% to $4,375 and silver up 1.62% to $64.96.
Why a REALTOR® cares: the through line is that oil at $87 pushes the 10-Year up, and the 10-Year is what mortgage rates follow. Friday’s weak jobs report pulled rates down. This week’s oil spike is pulling them back the other way. That is why the honest answer to “when will rates drop” is still that nobody can put a date on it.
S&P 500: 7,753 ▼ 0.06% | DOW: 53,976 ▼ 0.11% | NASDAQ: 26,605 ▼ 0.32%
A flat, slightly red day. Nothing moved much, which is its own kind of information after last week’s jobs shock.
The headline number was enormous. Nvidia is teaming up with BlackRock, Blackstone, and Apollo to put $500 billion into AI infrastructure, with the investment firms lending the cash for data centers and chip capacity. Nvidia is already the most valuable public company in the world and does not need the money in any ordinary sense. What this really is: the AI buildout has outgrown what even the biggest technology balance sheets want to fund alone, so it is being financed the way pipelines and toll roads are.
Intel went the other direction and got punished for it, dropping 4.06% after announcing a $15 billion share sale to fund AI chip factories. Selling new stock raises cash but splits ownership among more shares. The two stories side by side are the whole market right now: everyone is spending enormous sums on AI, and the market rewards the ones who can borrow to do it while punishing the ones who have to sell equity.
BTC: $63,784 ▼ 0.85% | ETH: $1,875 ▲ 0.04% | XRP: $1.01 ▼ 1.62%
Quiet and slightly lower. The interesting move is where the money went after last week’s theft: roughly $850 million flowed into Bitcoin ETFs in a single week, driven by the $130 million cold wallet hack. Cold storage is supposed to be the safest way to hold crypto, so when it fails, holders do not necessarily leave the asset. They move to a regulated product where somebody else carries the custody risk. Separately, Strategy sold $108.6 million of Bitcoin to build its cash reserve to $4.65 billion, the second straight week it has sold, with no purchases in more than six weeks. For a company whose entire identity is accumulating Bitcoin, a six week pause is the signal, not the sale.
Sources
- Mortgage News Daily (mortgage rates)
- Market Briefs (market data)
- U.S. Energy Information Administration (SPR weekly stocks)
- U.S. Treasury (10-year yield, daily curve)
- Fortune (gold spot)
- Fortune (silver spot)
- ICE Brent front-month (crude settlement)
- CoinGecko (crypto quotes)
- REALTY EXPERTS Live Inventory (5-city MLS board)
Disclaimer: The market data, rates, and information provided are for informational purposes only and should not be considered financial advice. Always verify rates and data with your lender or financial advisor before making any decisions.