



"At a Glance" Local Housing STATS and News 08/05/26
August 5, 2026 · Alameda County Market Dashboard
TODAY'S LIVE INVENTORY
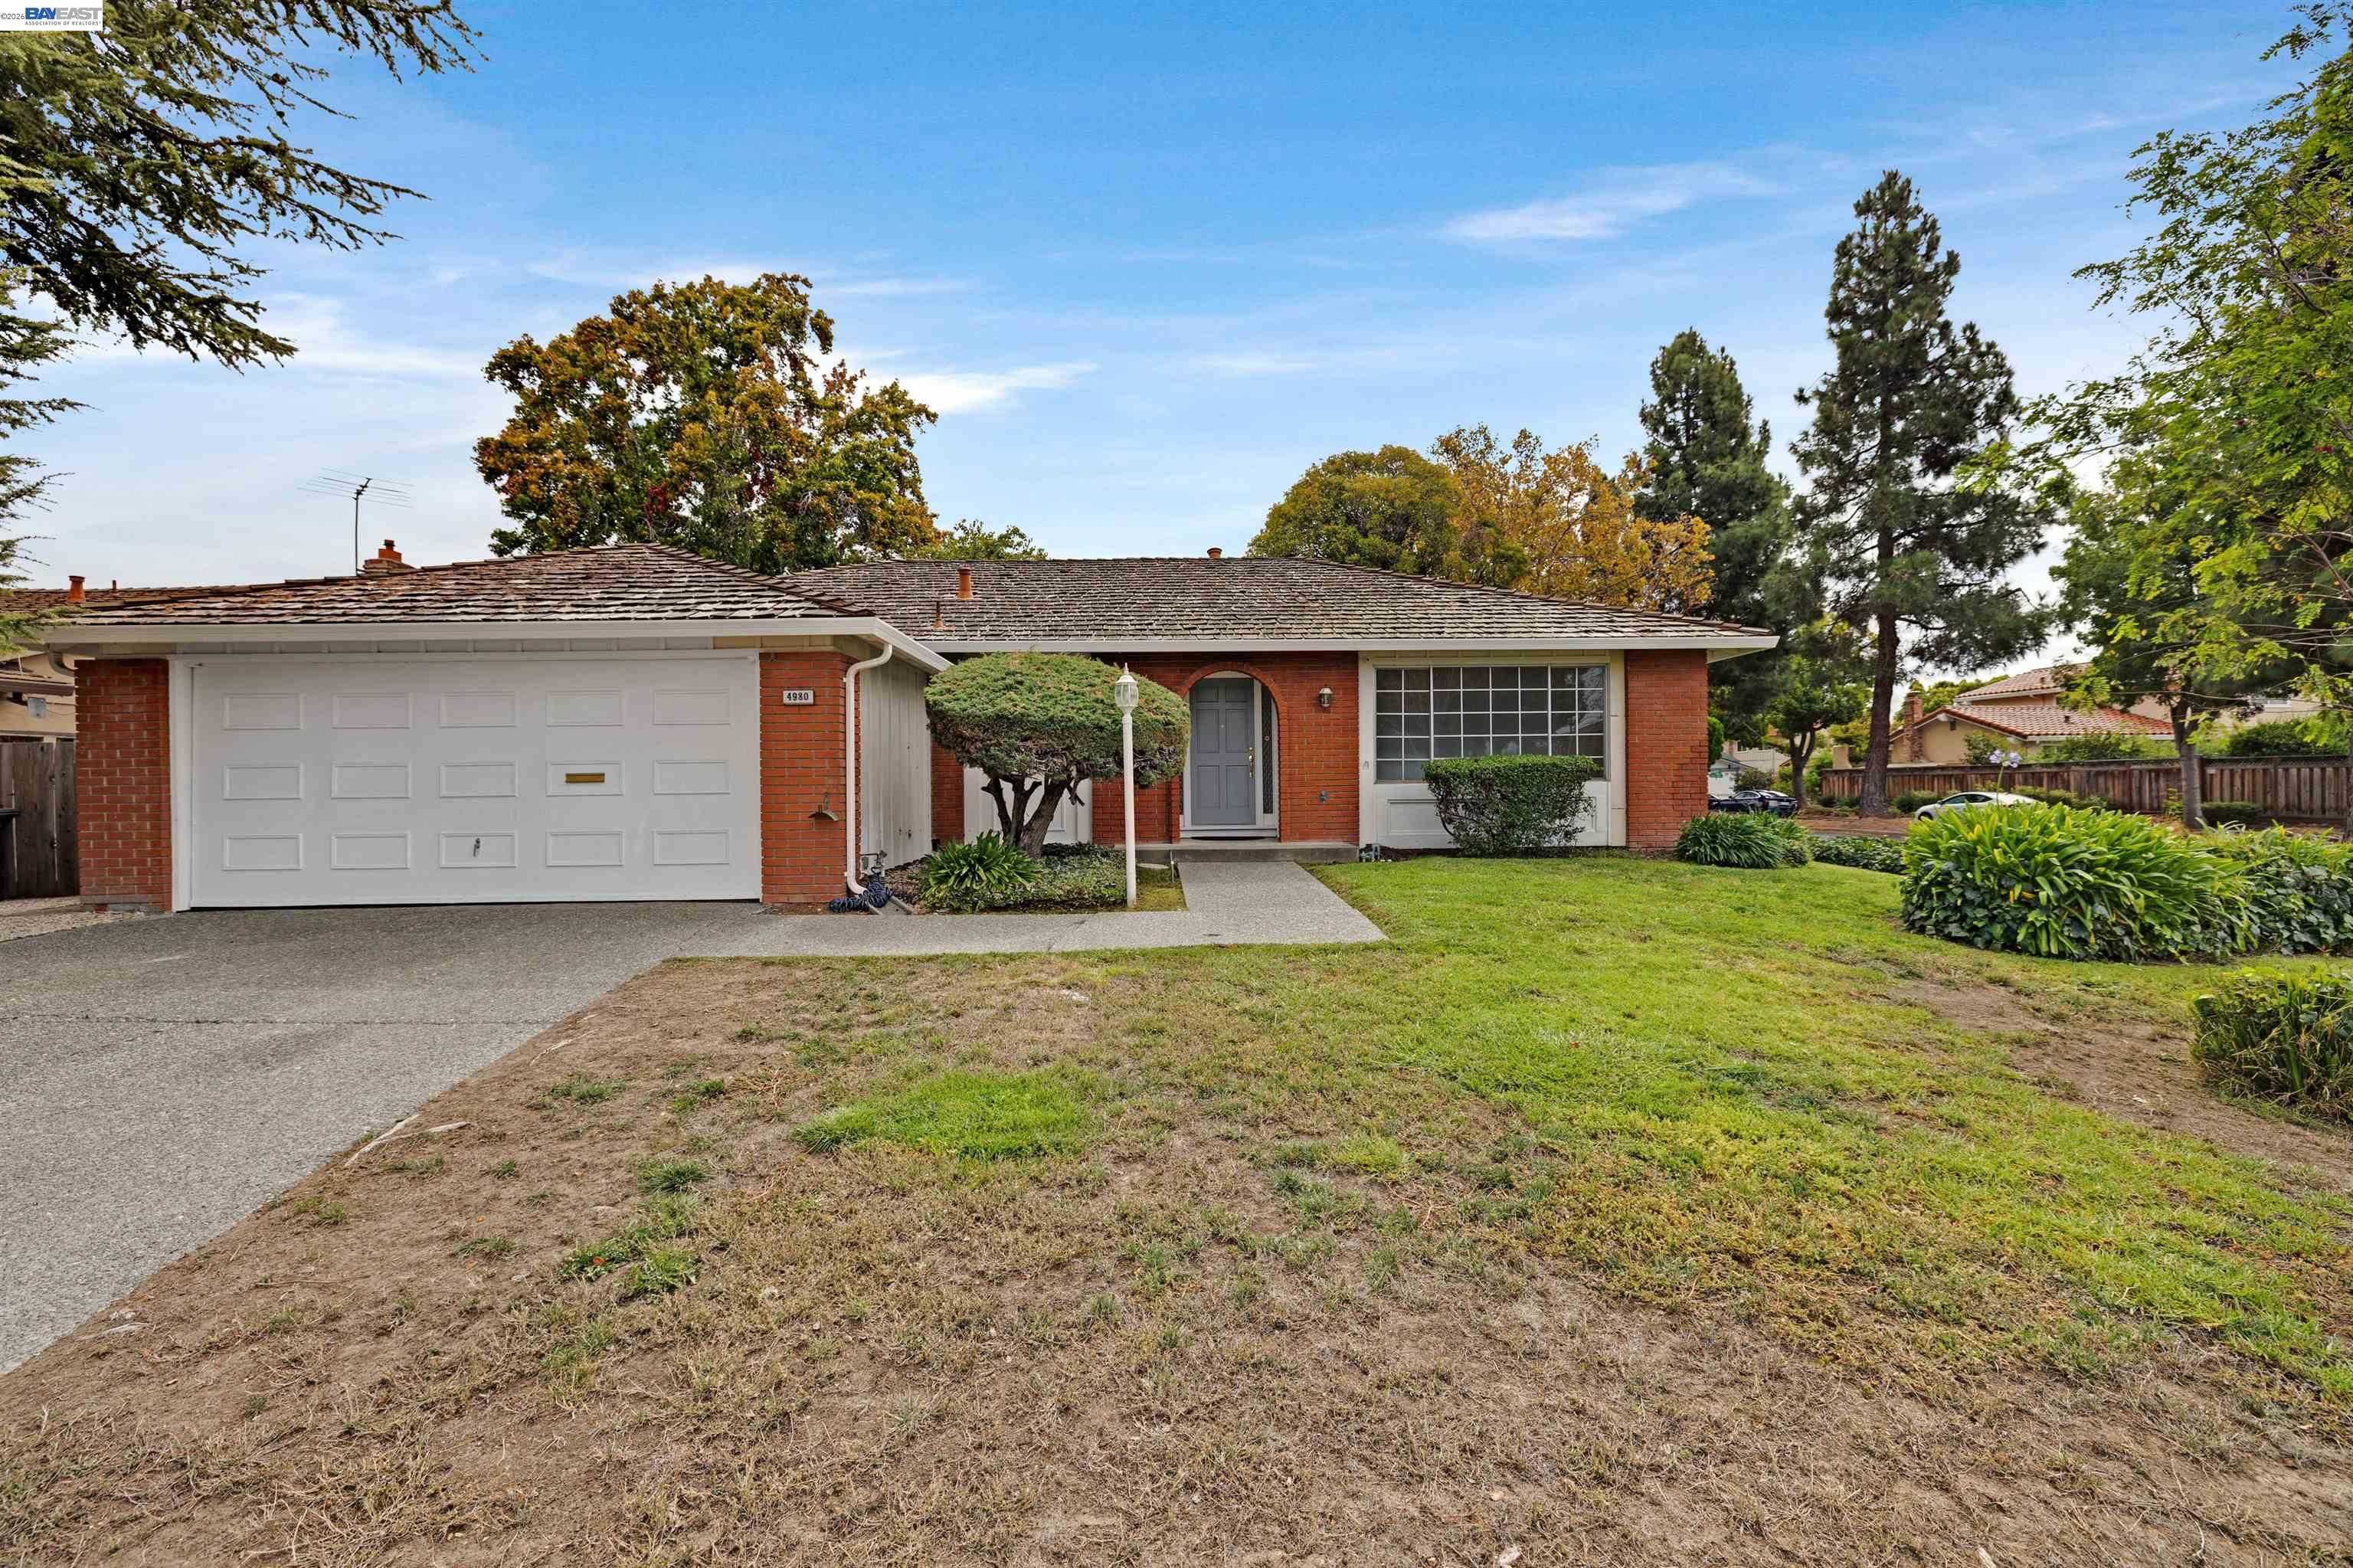
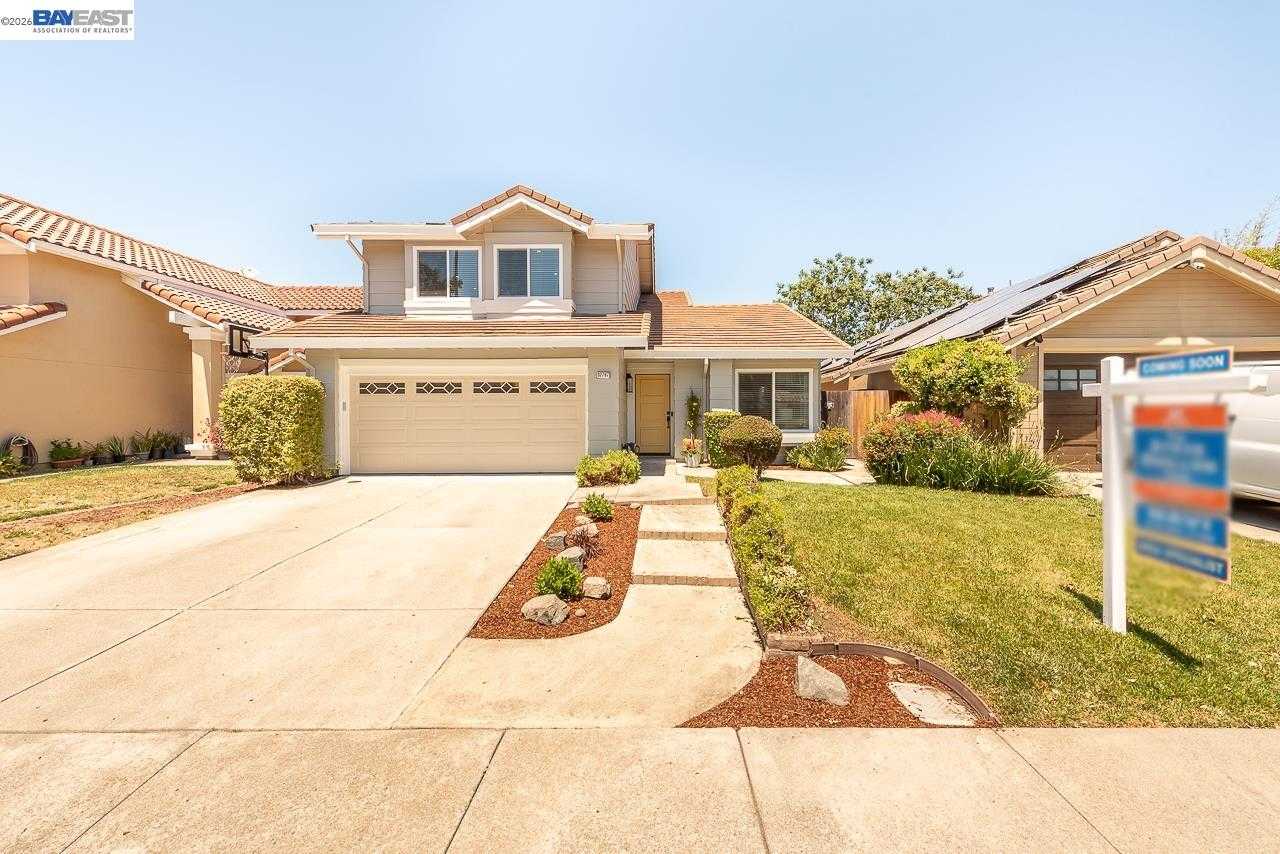
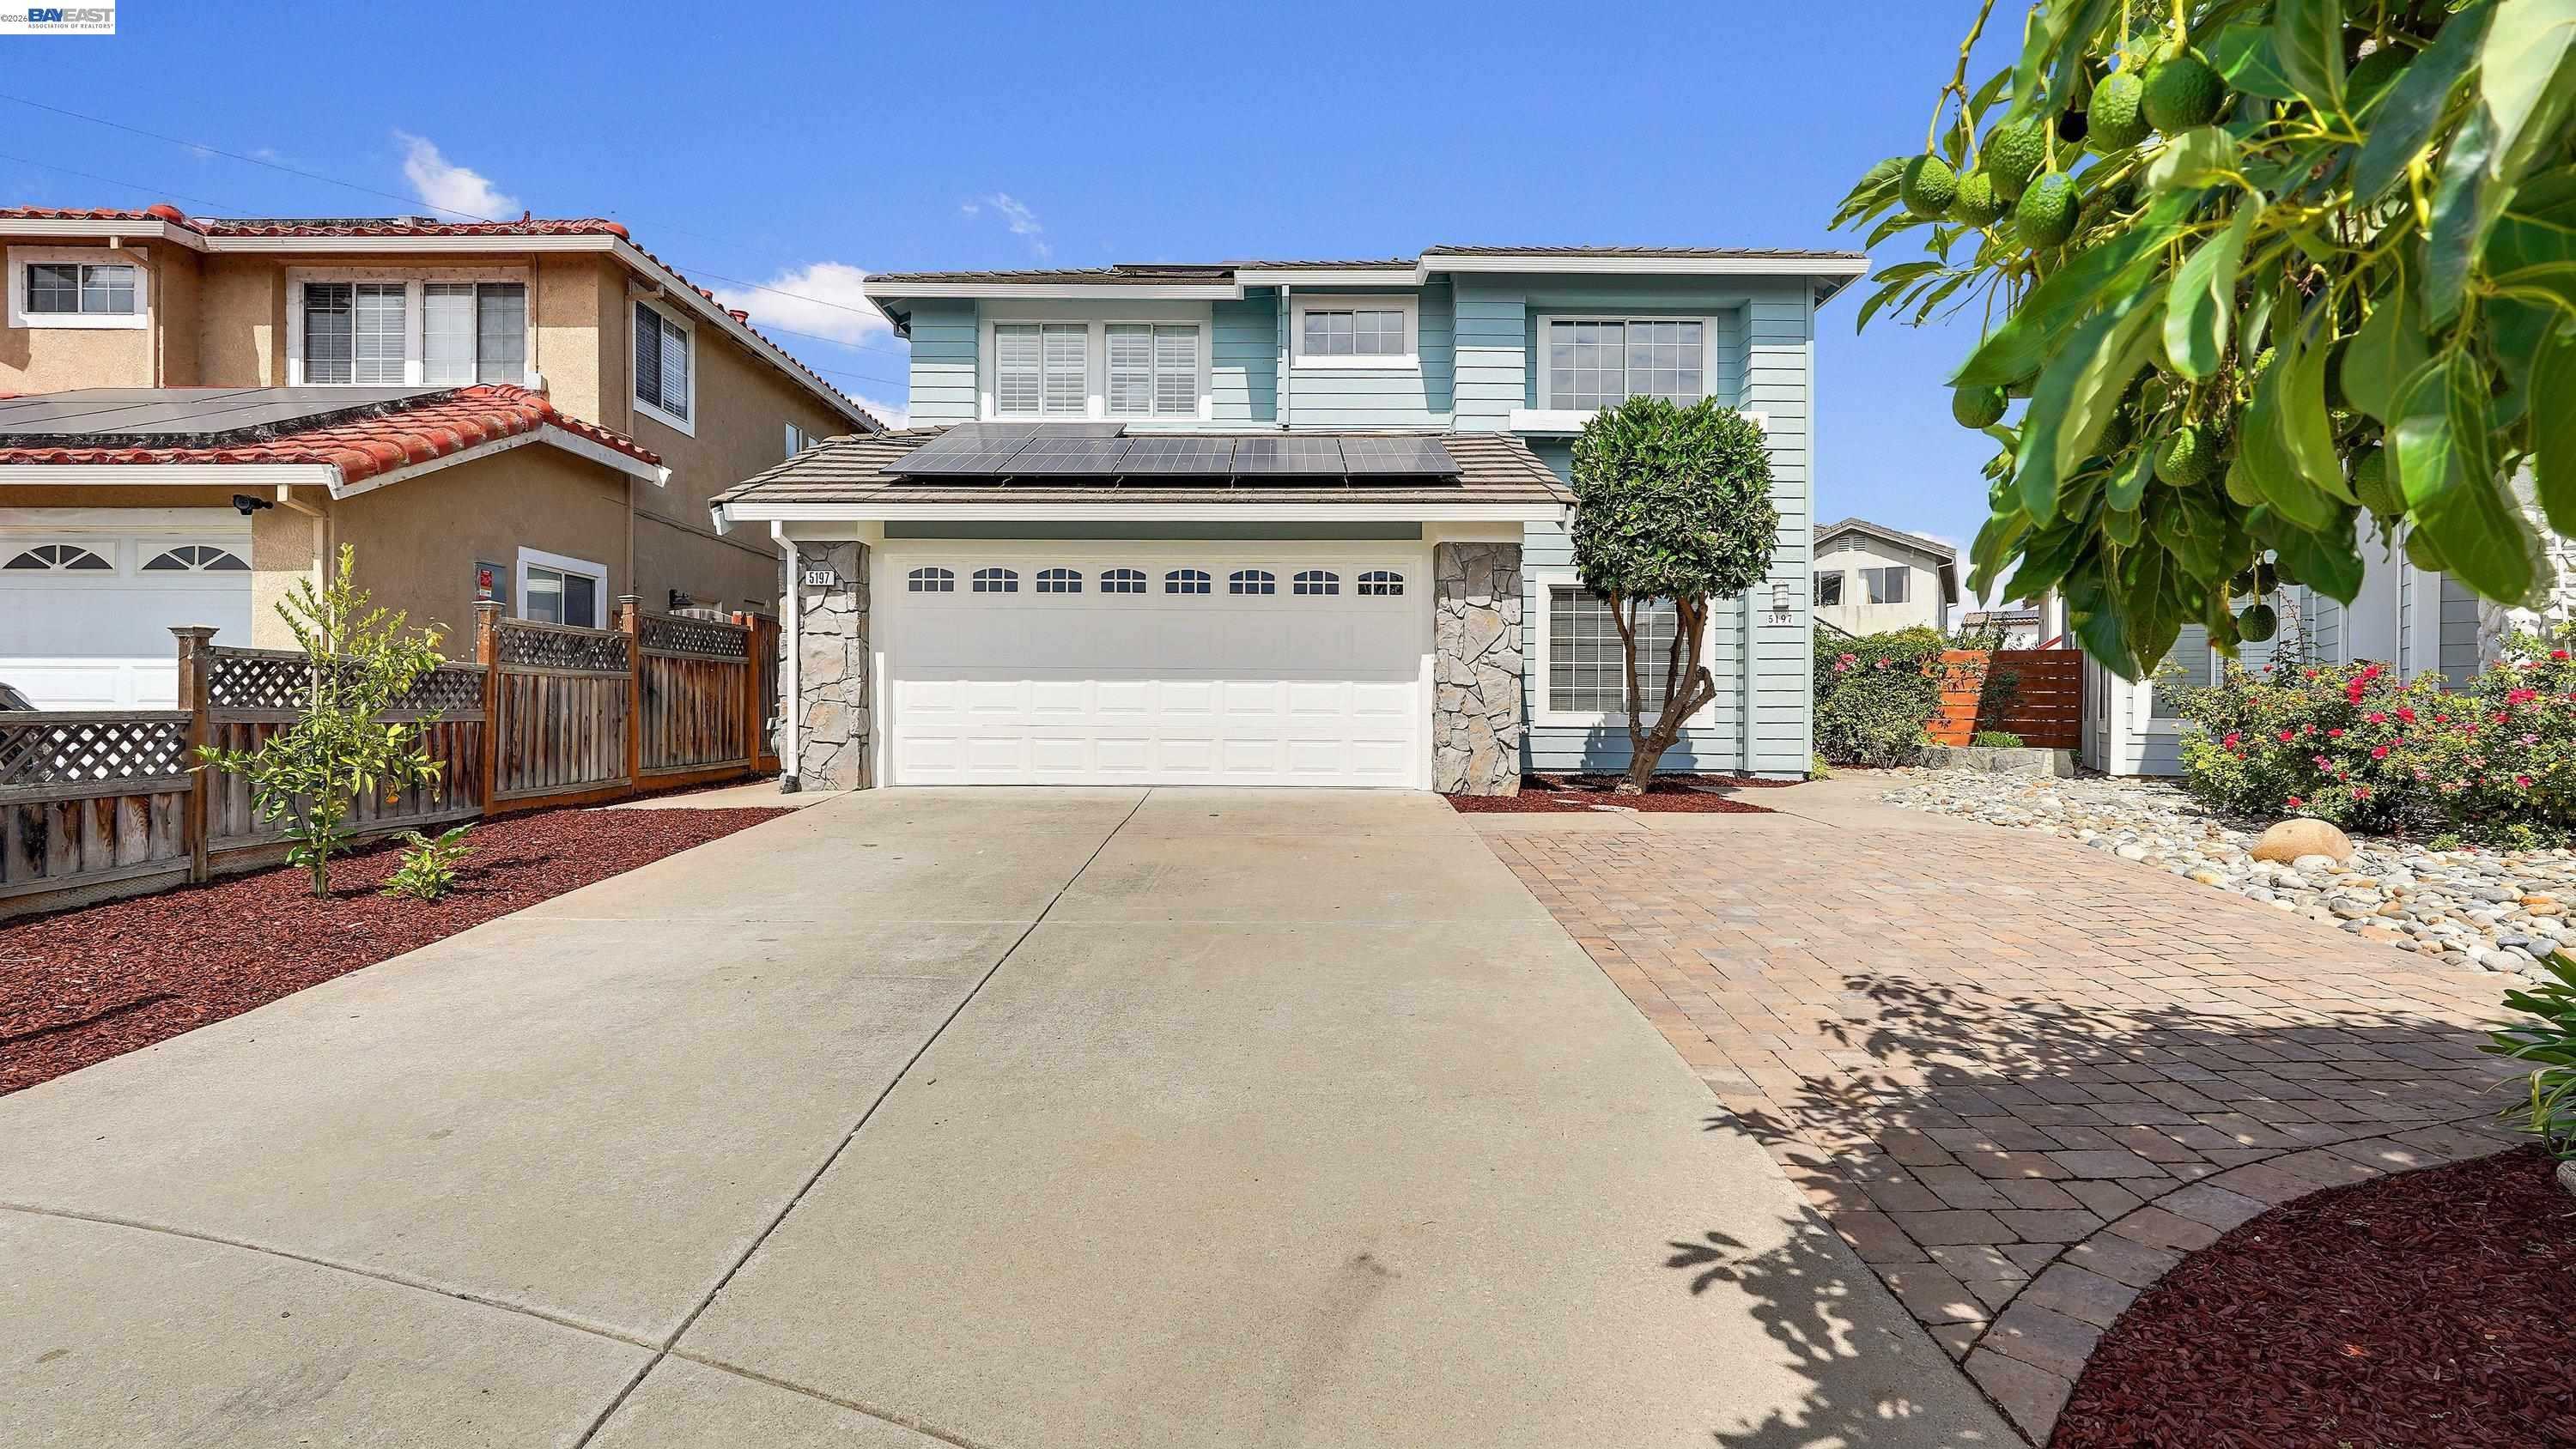
Behind these county totals: hundreds of homes still for sale in Fremont, Hayward, Union City, Newark and Milpitas, one live ledger with prices, sizes and a market read, refreshed each morning from the same MLS export.
30-Year Fixed: 6.75% ● 0.00% | 15-Year Fixed: 6.29% ● 0.00%
Rates sat still. The daily 30-year fixed is 6.75% and the 15-year is 6.29%, both unchanged on the day with mortgage backed securities flat. After the 10-Year’s move down, flat is a little disappointing, but it beats another climb.
NAR published quarterly metro prices, and California owns the list. Eight of the ten most expensive metro areas in the country are in California.
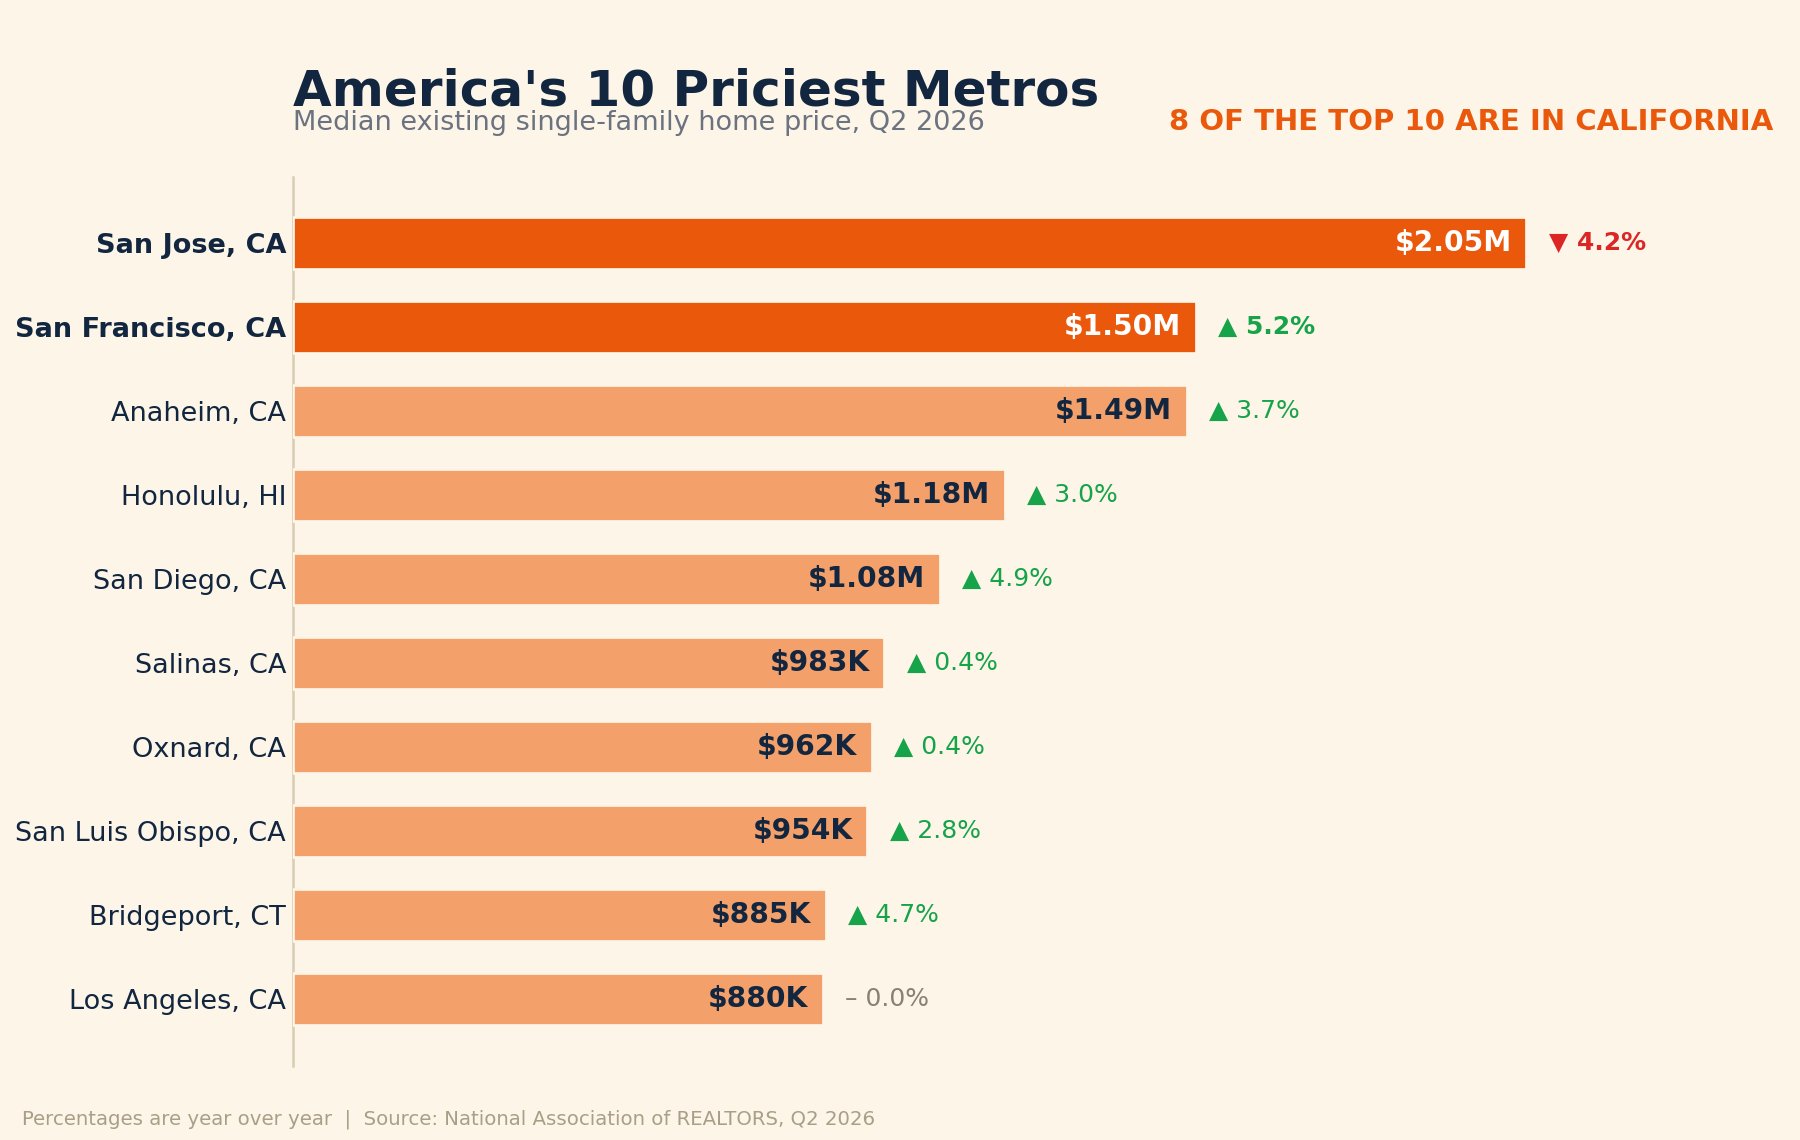
San Jose is number one in America at $2,050,000, and it is the only metro in the top ten that went down, off 4.2% year over year. San Francisco is number two at $1,500,000 and went the other way, up 5.2%. Los Angeles landed exactly flat at $879,900. Nationally the median existing single-family home hit $434,900, up 1.5%, with prices rising in 80% of metros. The West was the only region in the country to fall, off 0.8%, while the Northeast led at up 3.8%.
Read the top of that list again, because we sit directly between those two numbers. San Jose and San Francisco are the two most expensive metros in the United States and they just moved in opposite directions by nearly ten points of spread. Our five cities are the affordable middle of that sandwich, which is exactly the position that holds up best when the very top of a market softens.
The split is showing up in what is for sale, too. Zillow says starter home listings rose 4.5% year over year in June while luxury listings fell 5.2%. Wealthy buyers have stock gains and are still transacting; everyone else is squeezed by inflation and a shaky job market. Same story as San Jose falling while San Francisco rises, just told through inventory instead of price.
Why a REALTOR® cares: when the priciest metro in the country drops 4.2% and its neighbor gains 5.2%, averages stop being useful. Your buyer does not purchase a region, they purchase a city and a street. This is the quarter to price off the actual comps in front of you rather than off any headline about the West being down.
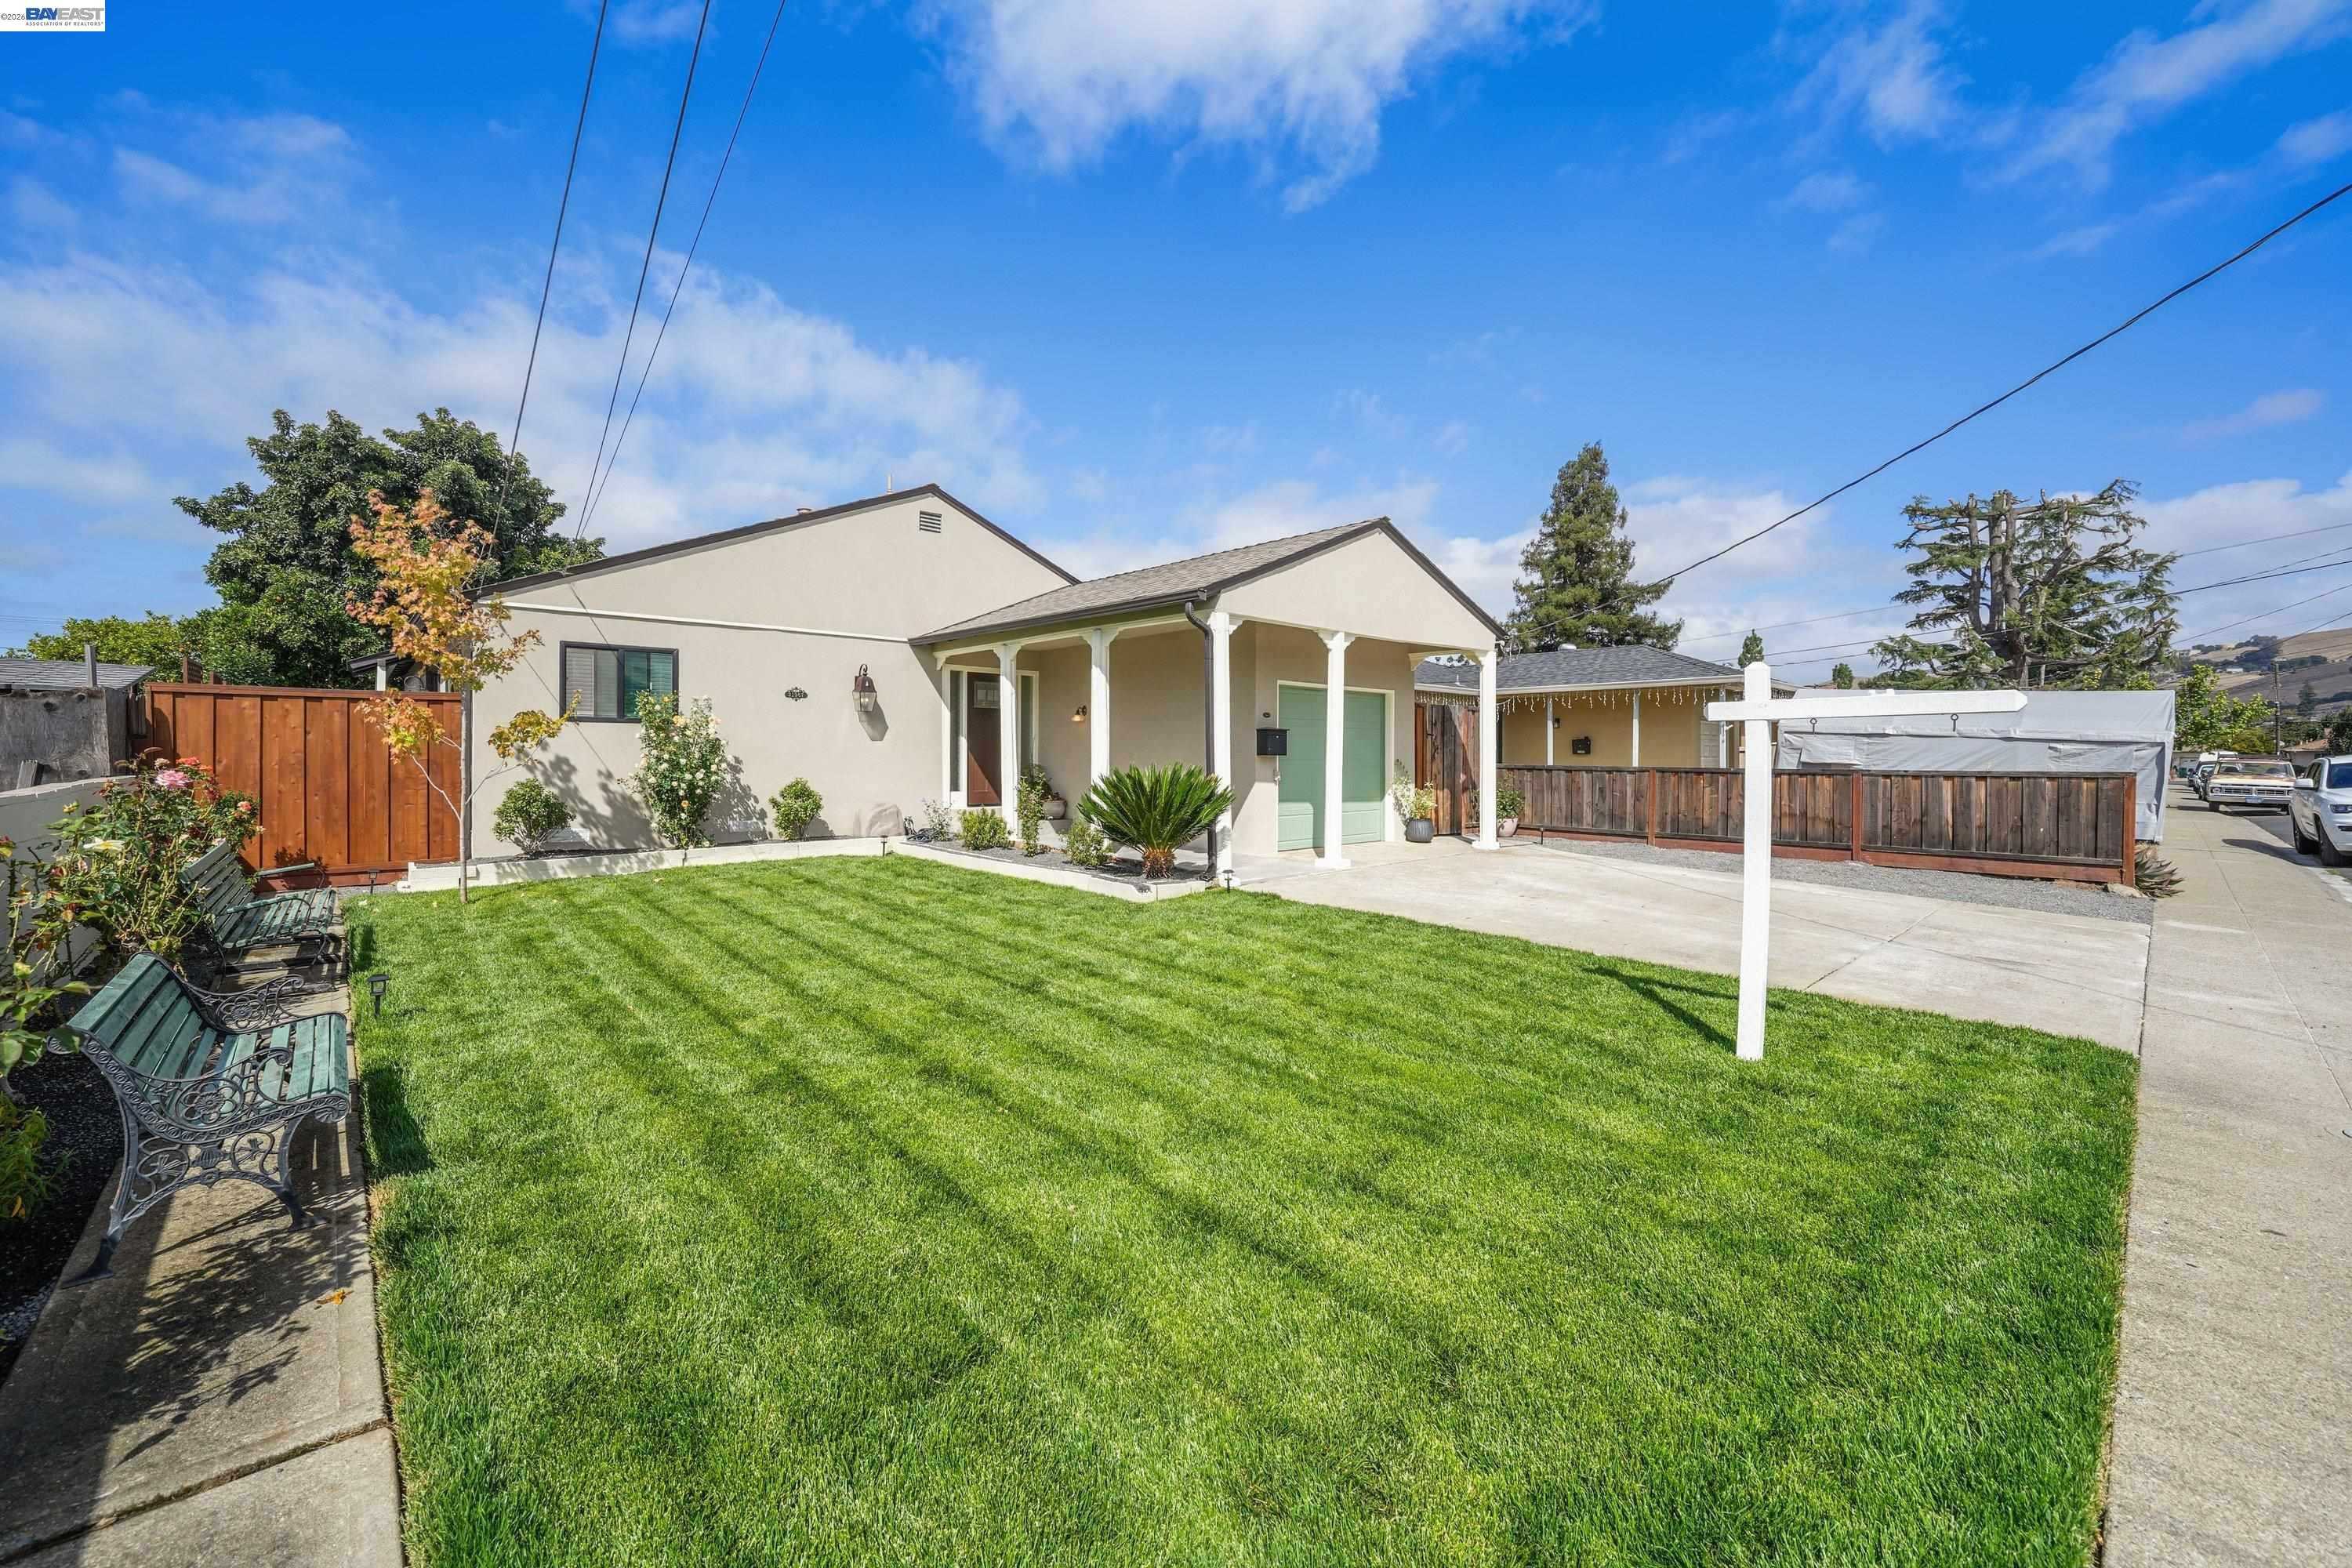
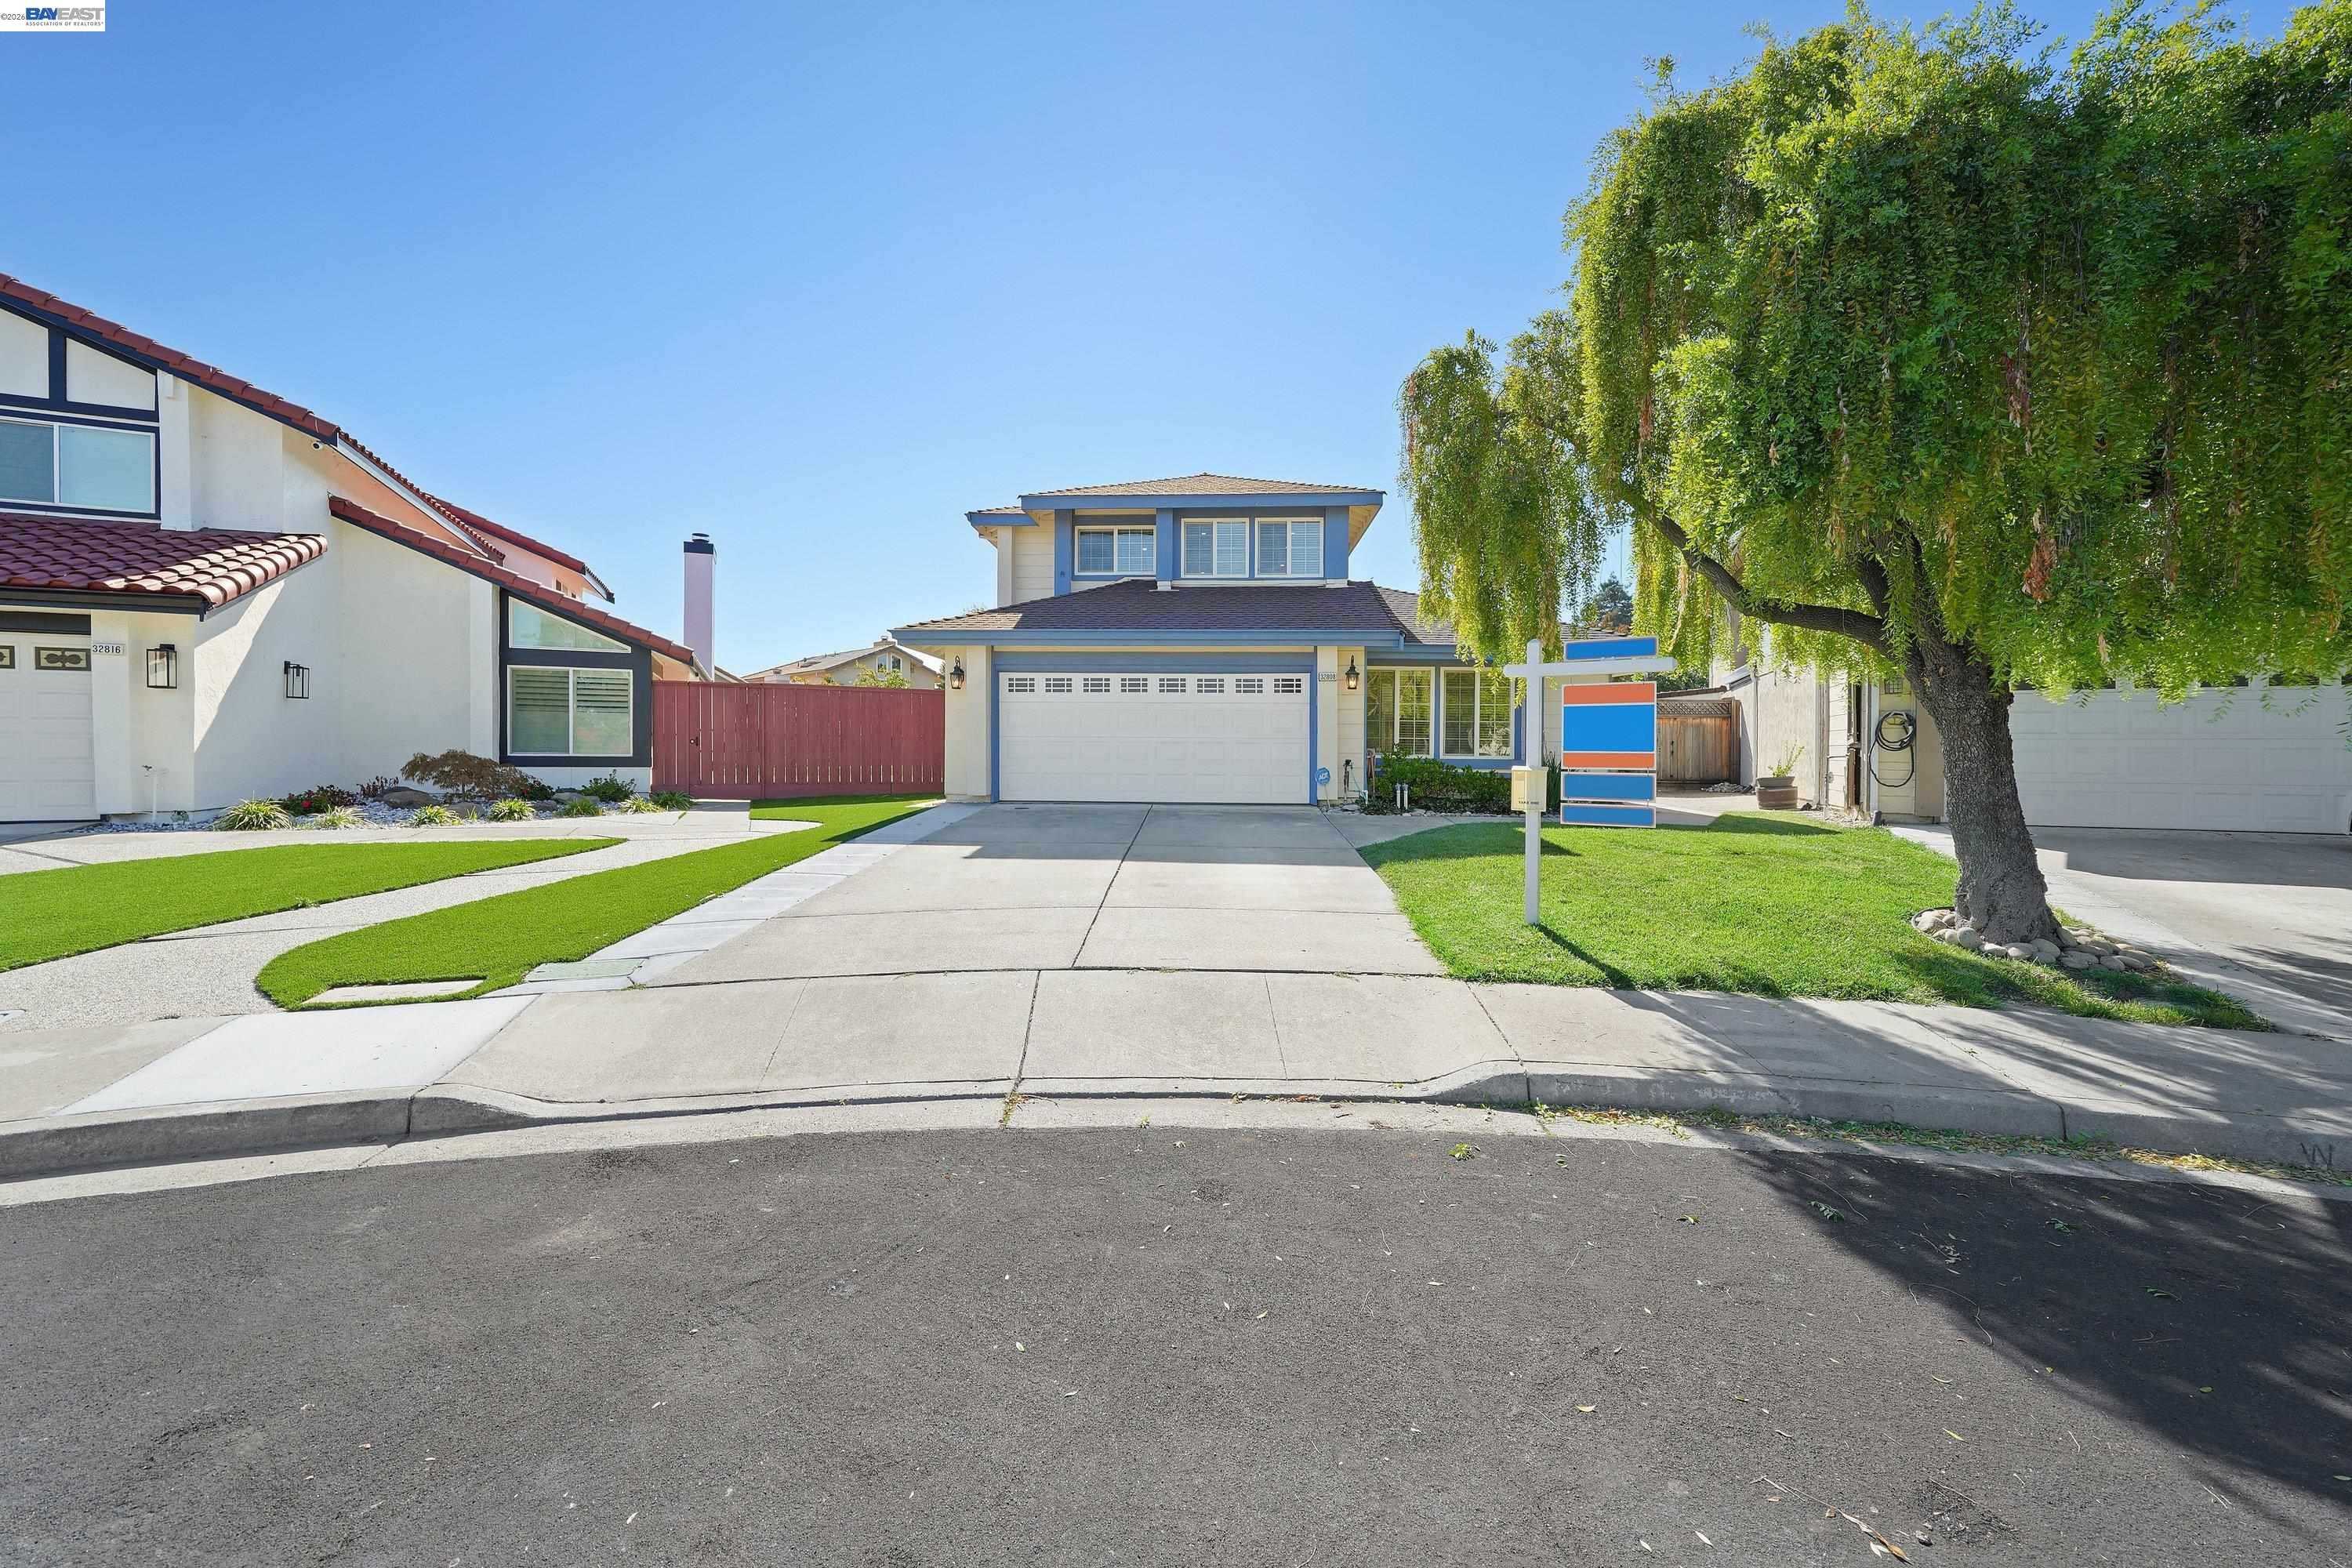
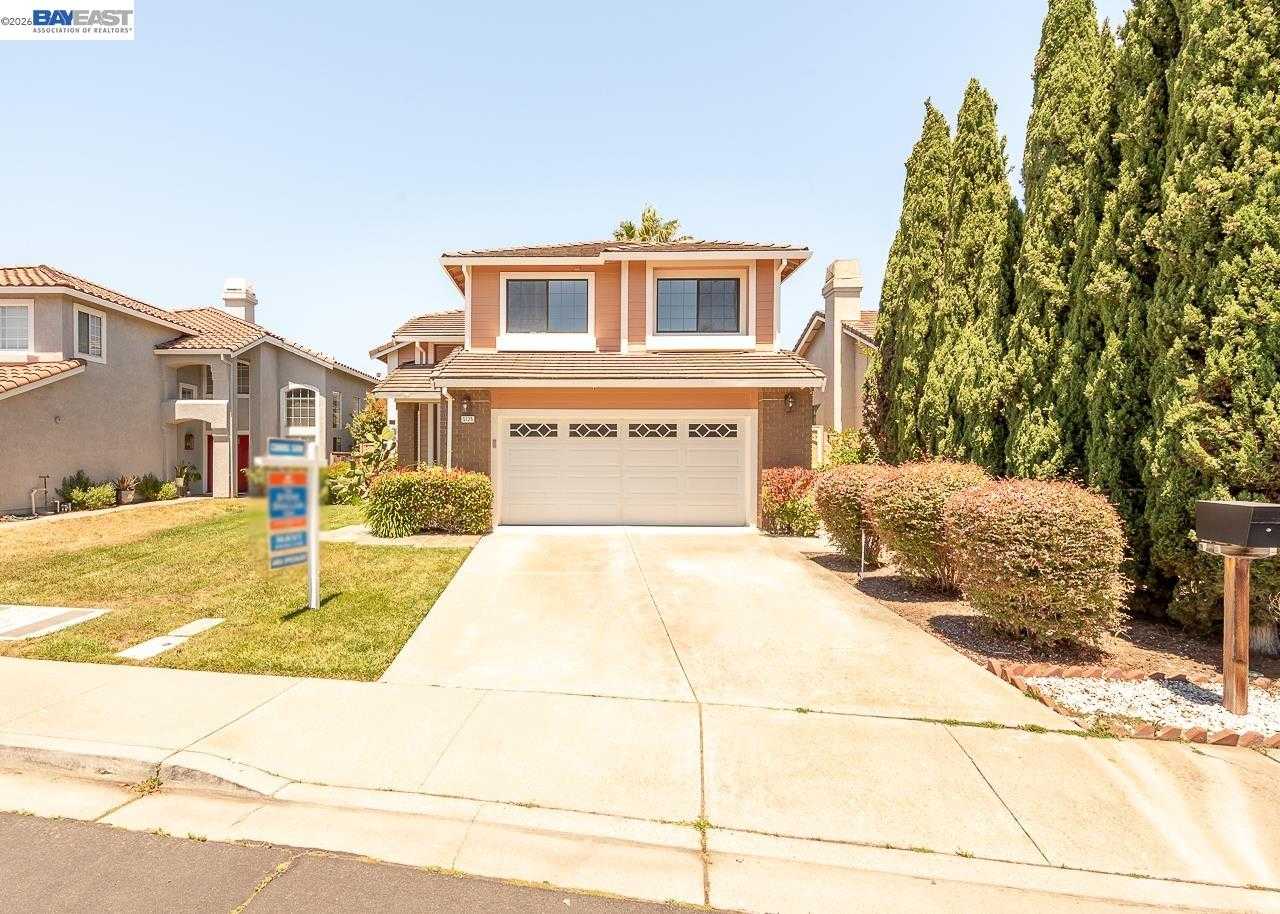
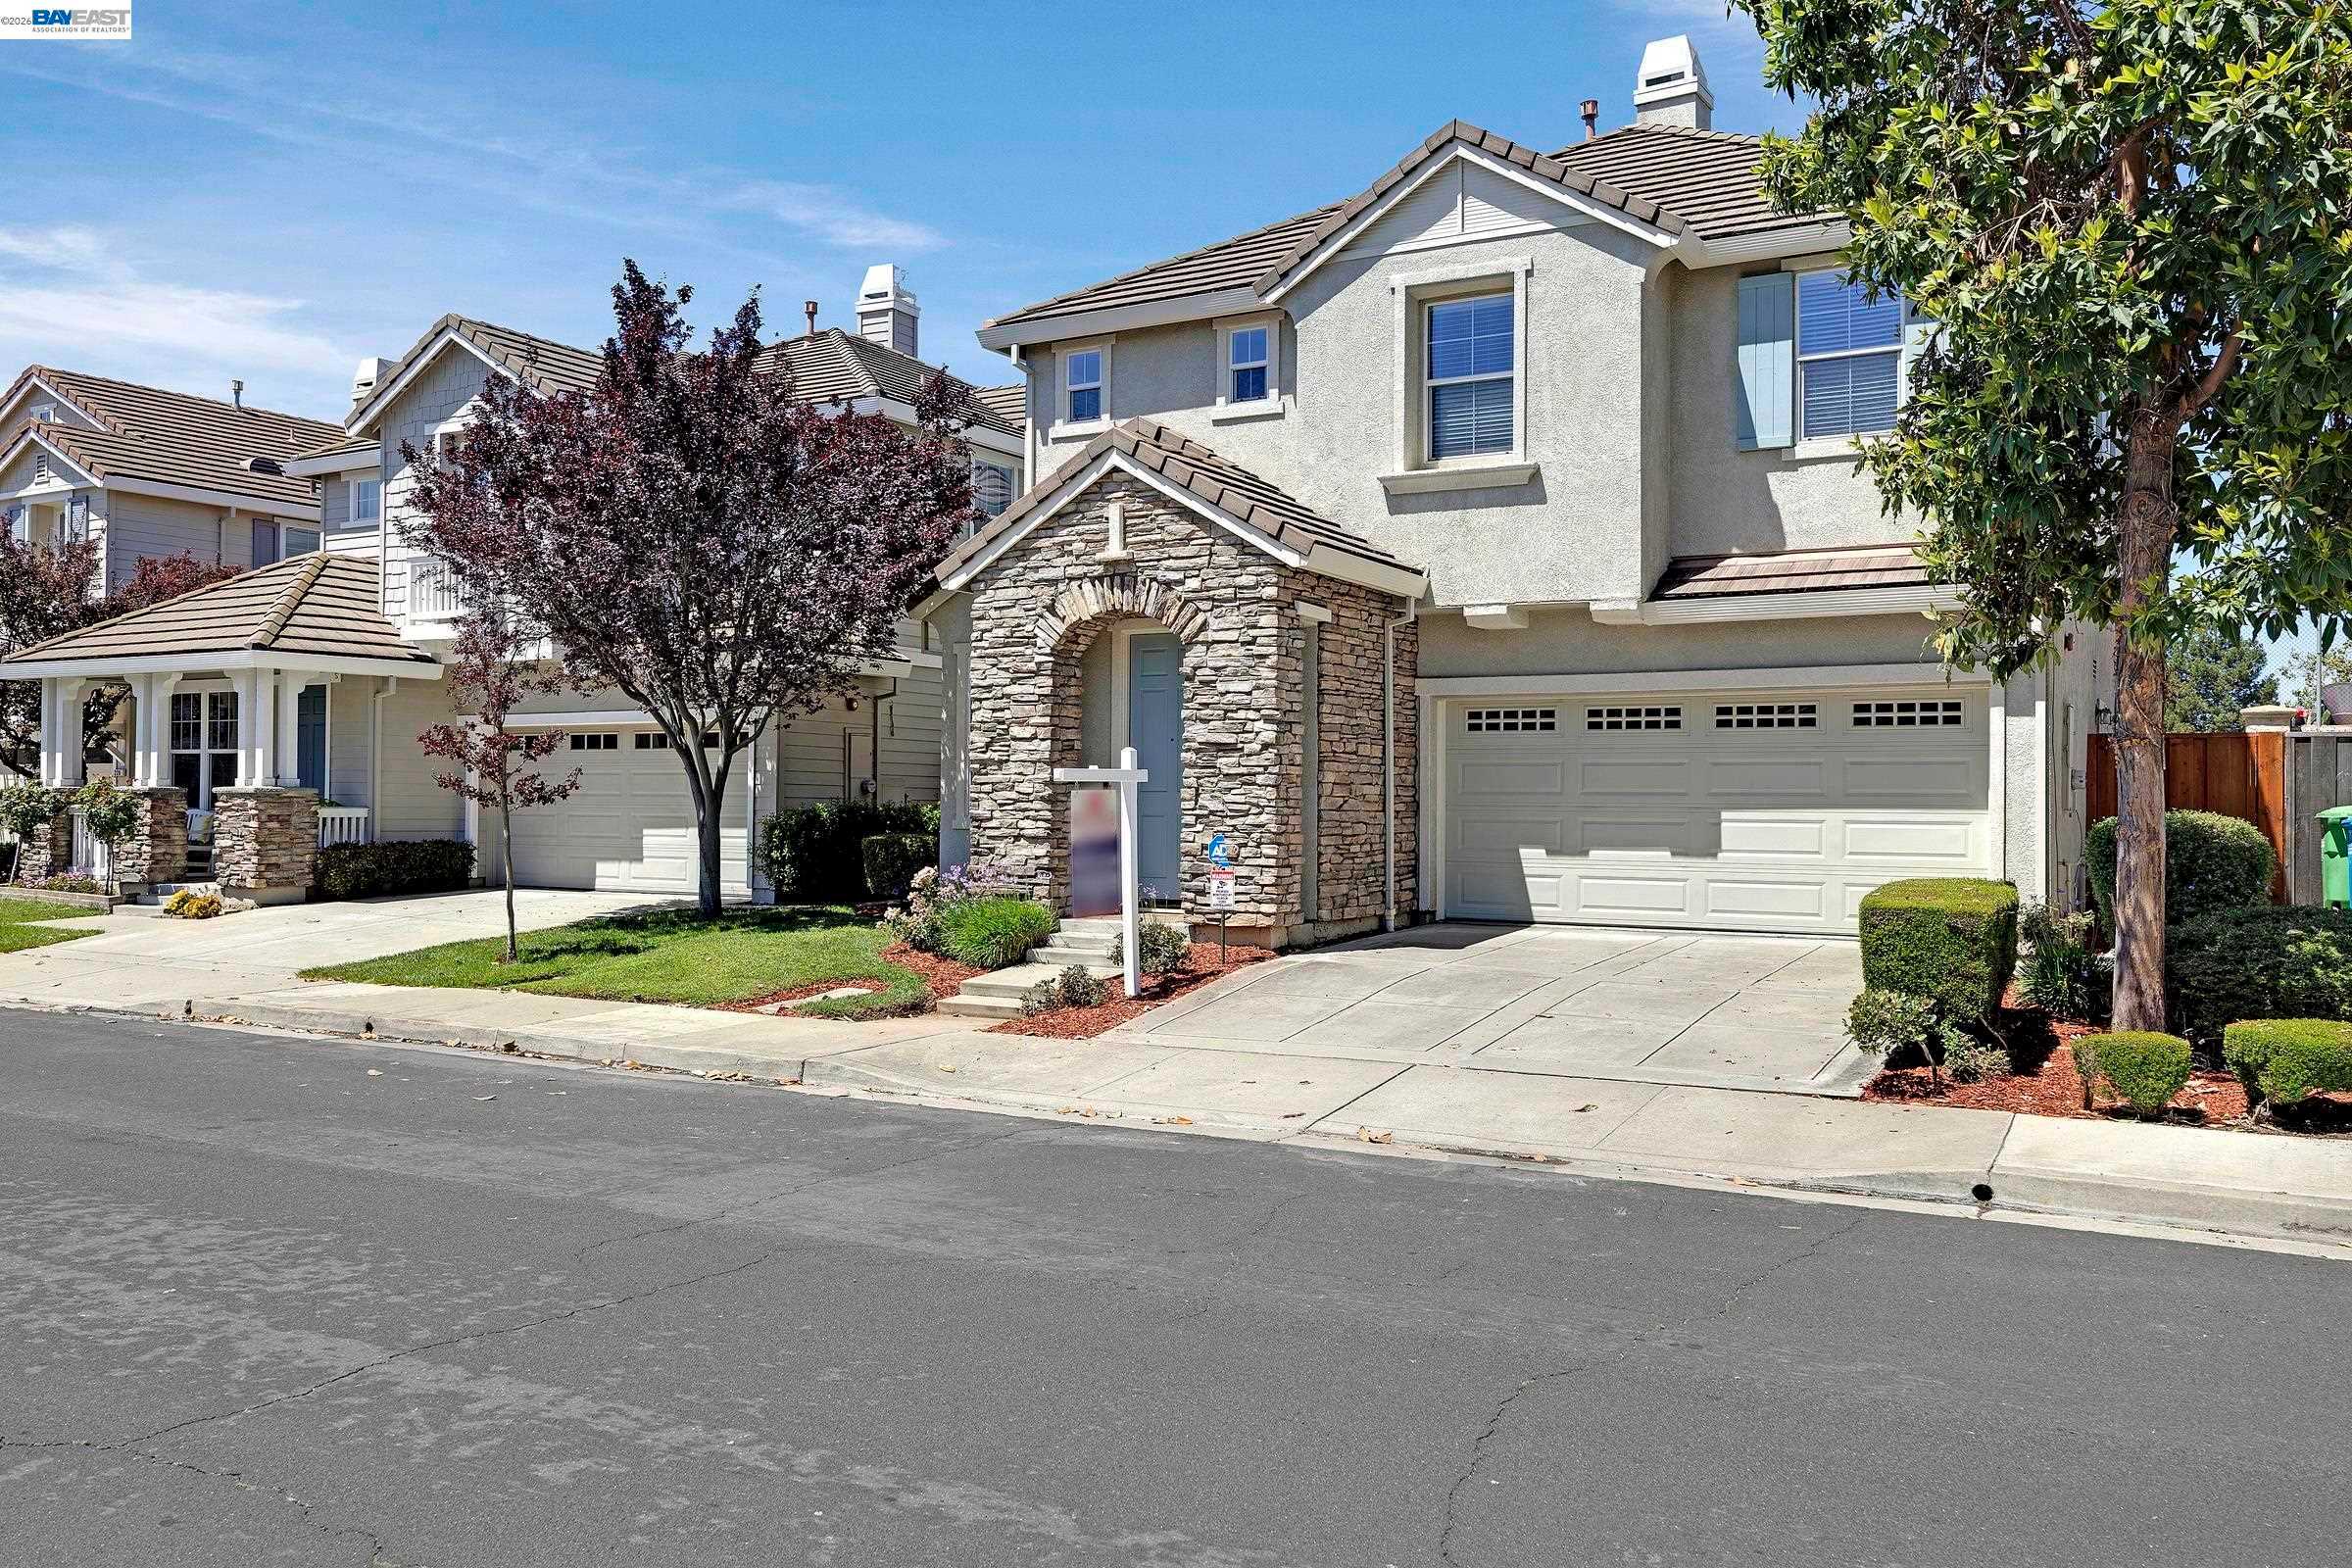
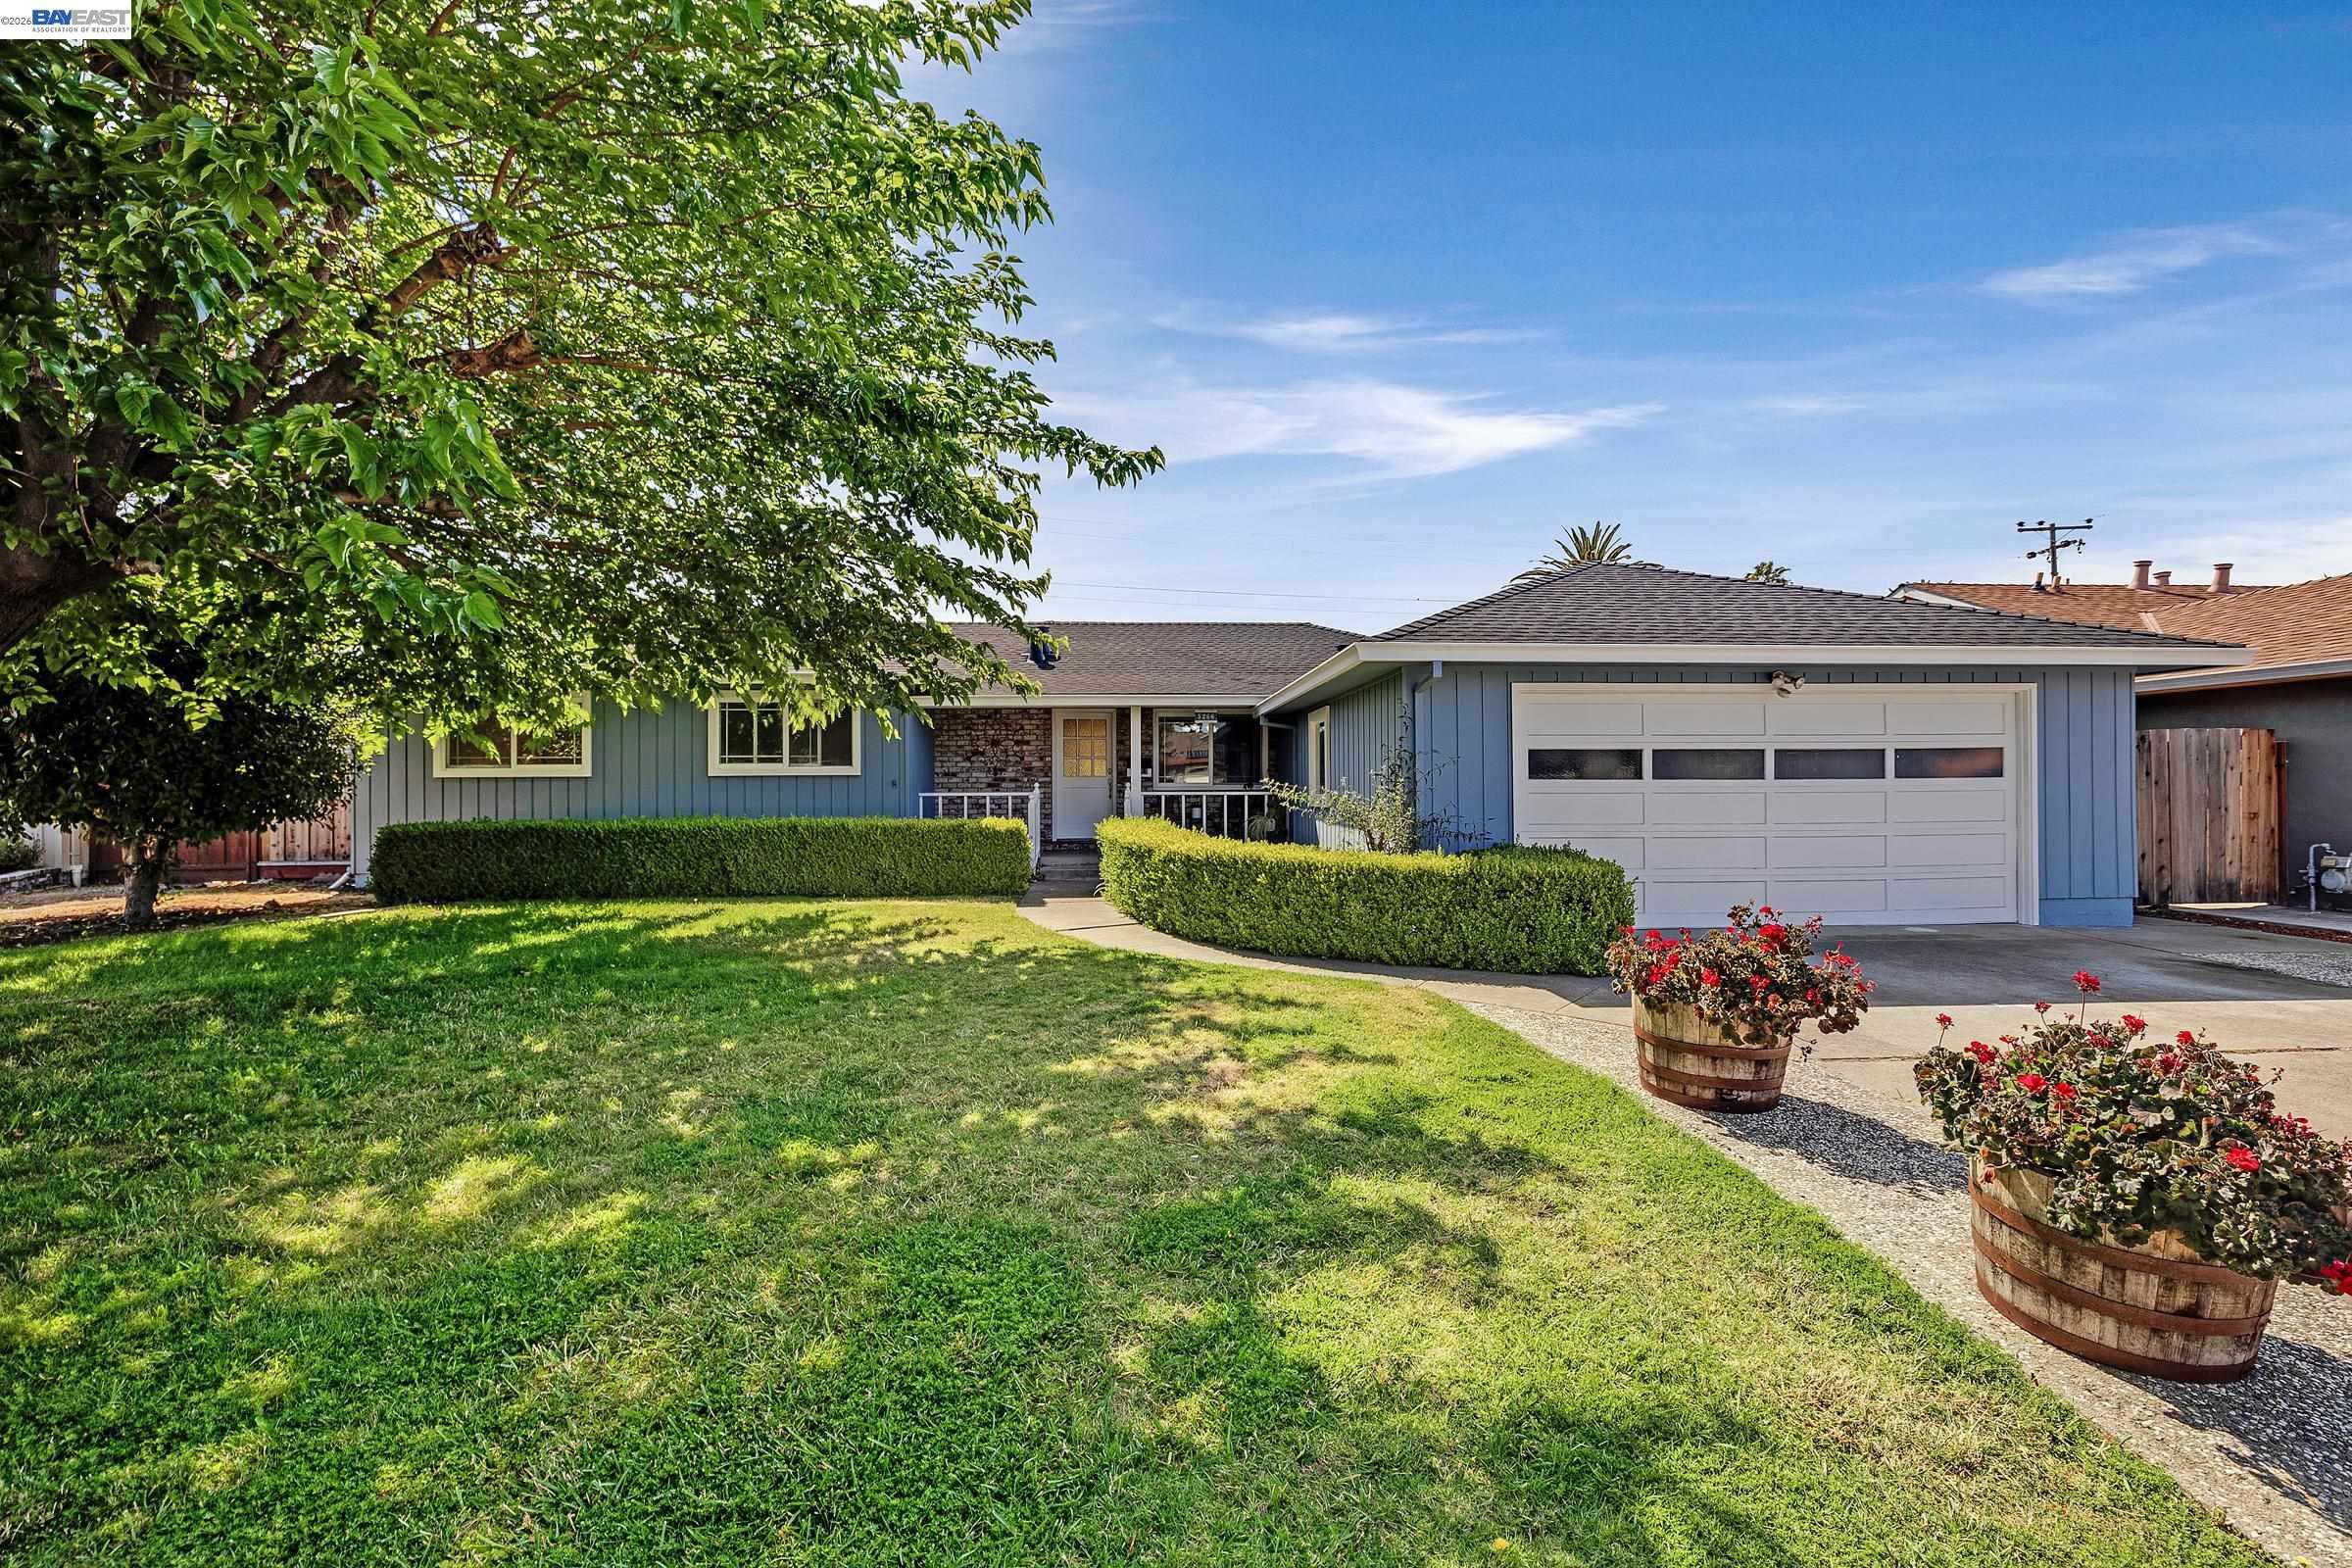
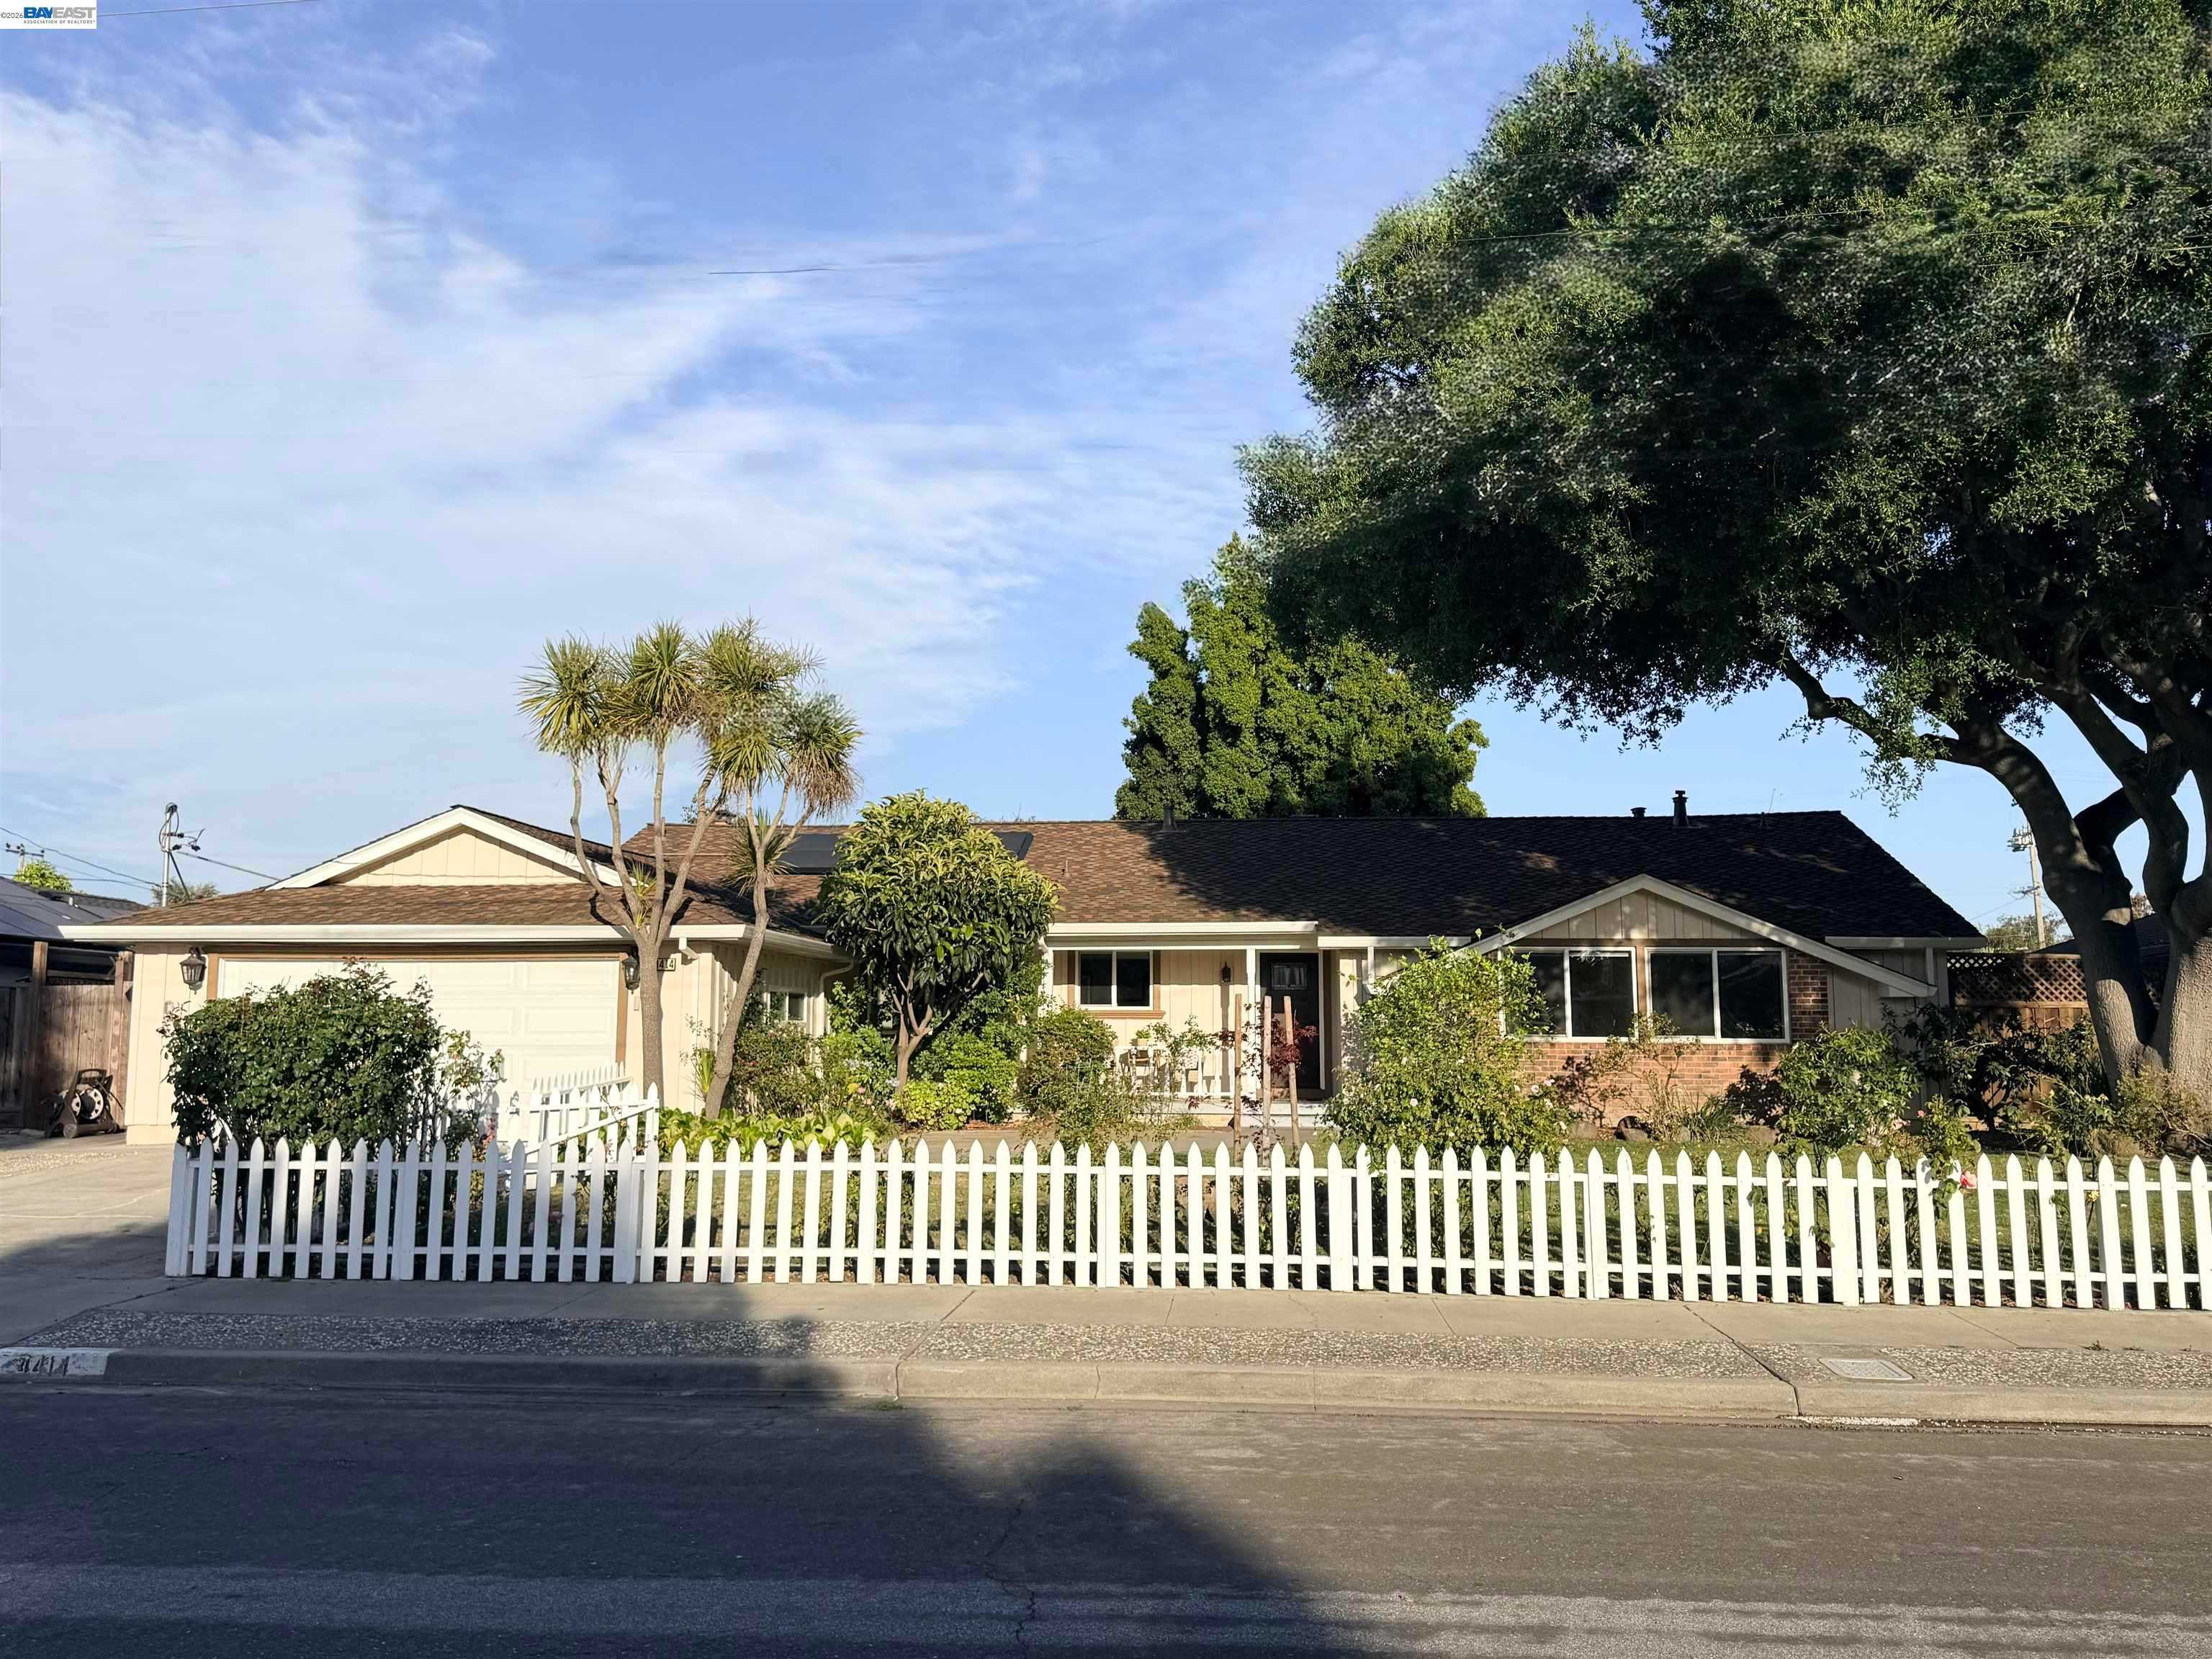
Today’s live board across our five focus cities shows 700 homes a buyer can actually pursue right now, including 42 brand new listings and 95 more coming soon. The full, always-updating ledger lives at harvrealtor.net/live-inventory.
Today’s Live Inventory (buyable now)
- Fremont: 276 available (213 active, 18 new, 44 coming soon)
- Hayward: 193 available (167 active, 12 new, 14 coming soon)
- Milpitas: 101 available (78 active, 3 new, 20 coming soon)
- Newark: 80 available (62 active, 4 new, 13 coming soon)
- Union City: 50 available (40 active, 5 new, 4 coming soon)
Median asking prices: Union City at $1,299,388, Fremont at $1,281,384, Newark at $1,214,500, Milpitas at $1,155,000, and Hayward at $850,000. Median days on market runs from 21 in Union City to 39 in Hayward. Board-wide the 15-city table carries 2,685 listings, up 8 from yesterday. Our medians sit roughly 37% below San Jose’s $2.05 million, which is the number to put in front of any buyer who thinks they have been priced out of the Bay Area entirely.
S&P 500: 7,736 ▲ 1.79% | DOW: 54,085 ▲ 1.71% | NASDAQ: 26,584 ▲ 2.59%
All three indexes closed at record highs. The S&P 500 rose 1.79% to 7,736, the Dow added 1.71% to 54,085, and the NASDAQ led again with 2.59% to 26,584. Second straight session of green across the board, and it puts the Dow up roughly 12.5% for the year. The reason was one sentence: Treasury Secretary Scott Bessent said an Iran deal could land within a day or two. Markets have heard almost deal before and nothing has stuck yet.
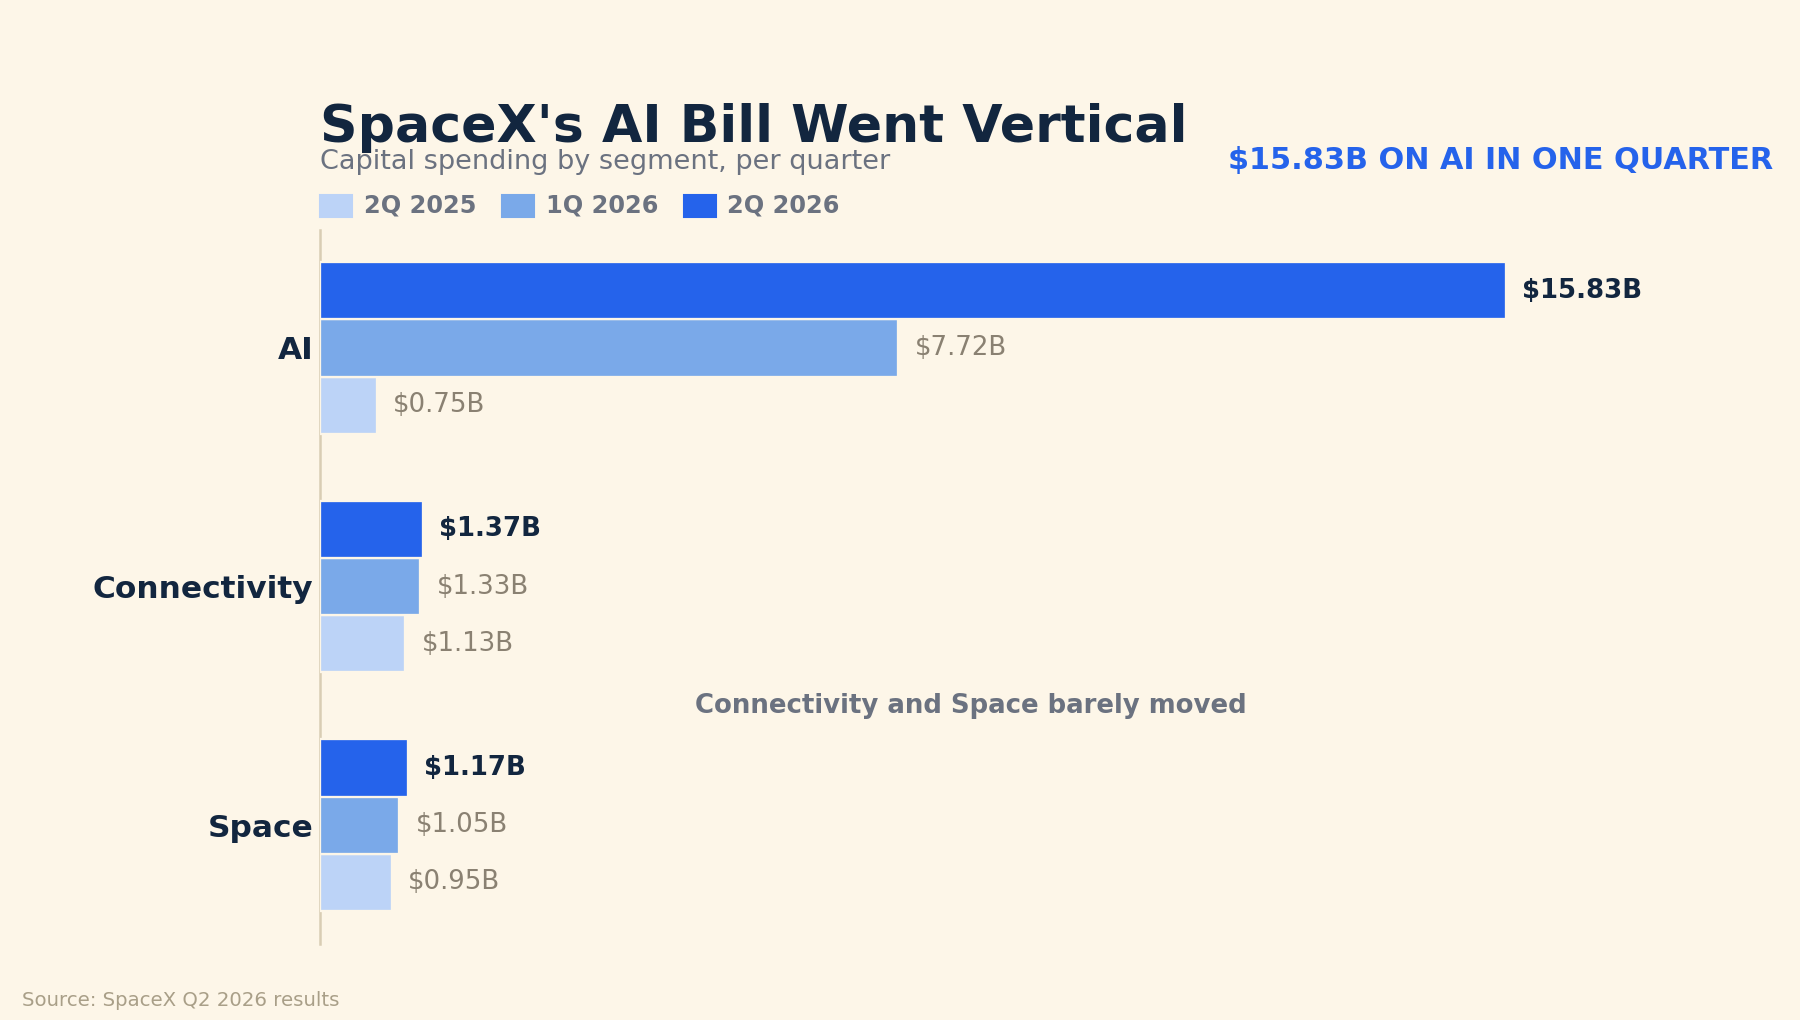
SpaceX posted its first earnings as a public company and gave everyone a number to argue about: $15.83 billion on AI in a single quarter, out of $18.37 billion of total capital spending. The chart is the whole story. Connectivity and Space barely moved over the past year, going from $1.13 billion to $1.37 billion and from $0.95 billion to $1.17 billion. AI went from $0.75 billion to $15.83 billion, a jump of about 2,000%. Revenue grew 92%, and the stock still rose 9.43% during the session before falling after close. The worry is not whether the spending is happening, it is whether it pays off before a share lockup expires and insiders get to sell.
AMD beat expectations and got punished anyway. It guided to about $13 billion this quarter, up from $11 billion, but analysts wanted $14 billion, so shares fell more than 10% after hours despite gaining 7.00% in the regular session. Two AI names, two strong reports, two after hours selloffs. The market is no longer paying up for AI on faith alone.
US 10-Year: 4.63% ▼ 0.07% | Gold: $4,184 ▲ 2.83% | Silver: $61.46 ▲ 4.82%
The 10-Year came down again. Treasury’s daily curve put the 10-year yield at 4.63% at Monday’s close, down 7 basis points from 4.70%. That is the second meaningful step down in a week and it is the direction that matters for anyone shopping a mortgage.
Metals had a big day. Gold jumped 2.83% to $4,184 an ounce, gaining more than $115. Silver ran harder still, up 4.82% to $61.46, its third straight gain. When money moves into both metals this hard on the same session, it usually says something about how much conviction there really is behind a record stock close.
A note on oil, because we would rather tell you than guess. Brent came back four materially different ways this morning, from the high $70s in one newsletter to $88.90 in the federal daily series for August 3, and the benchmarks have swung more than $20 a barrel in two weeks on Iran headlines. We could not reconcile them to one defensible number, so we left the oil reading out today rather than print a figure we cannot stand behind. The direction is not in doubt: crude is violently volatile and trading on whether that Iran deal is real.
The trade gap shrank. June’s deficit came in at $73.3 billion, down 5.6%, with imports off 1.8% and exports off 0.9%. A smaller deficit sounds like good news, and it can be, but a deficit that shrinks because Americans are buying less tends to show up later as softer corporate orders.
Why a REALTOR® cares: a 10-Year at 4.63% and falling is the best leading indicator you have for where mortgage rates go next. Rates have not followed yet, and they rarely follow on the same day. But two down moves inside a week is the setup you want if you have a buyer waiting on relief.
BTC: $64,835 ▲ 0.84% | ETH: $1,918 ▲ 2.25% | XRP: $1.07 ▼ 0.59%
Quietly green, with Ether the mover at roughly $1,918, up 2.25%. The structural story is bigger than the day’s prices: institutions now account for 72% of Wintermute’s spot trading volume, up from 59%. Professional money trades through options and funds rather than chasing headlines, so as their share climbs, crypto should set prices with less retail hype and, over time, swing less violently. Separately, Nigeria is letting small businesses sell tokenized shares over the counter, aimed at a population where more than 60% are under 30.
Sources
- Mortgage News Daily (mortgage rates)
- Market Briefs (market data)
- U.S. Treasury (10-year yield, daily curve)
- National Association of REALTORS® (Q2 2026 metro home prices)
- Forbes (SpaceX Q2 2026 capital spending)
- CNBC (gold spot)
- Fortune (silver spot)
- CoinGecko (crypto quotes)
- REALTY EXPERTS Live Inventory (5-city MLS board)
Disclaimer: The market data, rates, and information provided are for informational purposes only and should not be considered financial advice. Always verify rates and data with your lender or financial advisor before making any decisions.